BITCOIN Will Go Lower! Sell!
Please, check our technical outlook for BITCOIN.
Time Frame: 9h
Current Trend: Bearish
Sentiment: Overbought (based on 7-period RSI)
Forecast: Bearish
The market is approaching a significant resistance area 116,555.66.
Due to the fact that we see a positive bearish reaction from the underlined area, I strongly believe that sellers will manage to push the price all the way down to 113,250.42 level.
P.S
Please, note that an oversold/overbought condition can last for a long time, and therefore being oversold/overbought doesn't mean a price rally will come soon, or at all.
Like and subscribe and comment my ideas if you enjoy them!
Swing

GBPUSD Will Move Lower! Short!
Take a look at our analysis for GBPUSD.
Time Frame: 12h
Current Trend: Bearish
Sentiment: Overbought (based on 7-period RSI)
Forecast: Bearish
The price is testing a key resistance 1.351.
Taking into consideration the current market trend & overbought RSI, chances will be high to see a bearish movement to the downside at least to 1.339 level.
P.S
We determine oversold/overbought condition with RSI indicator.
When it drops below 30 - the market is considered to be oversold.
When it bounces above 70 - the market is considered to be overbought.
Like and subscribe and comment my ideas if you enjoy them!

GBPCAD Is Bearish! Sell!
Please, check our technical outlook for GBPCAD.
Time Frame: 12h
Current Trend: Bearish
Sentiment: Overbought (based on 7-period RSI)
Forecast: Bearish
The market is trading around a solid horizontal structure 1.882.
The above observations make me that the market will inevitably achieve 1.869 level.
P.S
Overbought describes a period of time where there has been a significant and consistent upward move in price over a period of time without much pullback.
Like and subscribe and comment my ideas if you enjoy them!

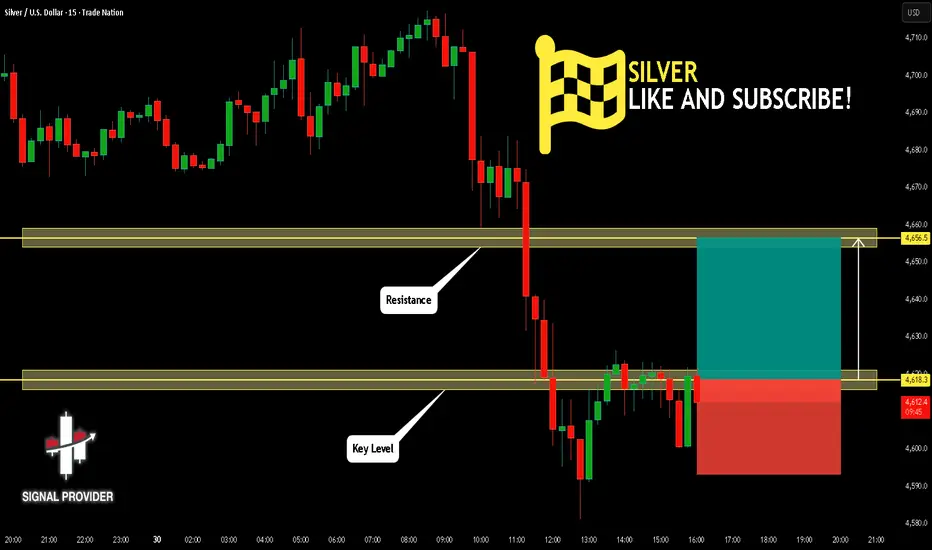
SILVER Is Very Bullish! Buy!
Here is our detailed technical review for SILVER.
Time Frame: 15m
Current Trend: Bullish
Sentiment: Oversold (based on 7-period RSI)
Forecast: Bullish
The market is testing a major horizontal structure 4,618.3.
Taking into consideration the structure & trend analysis, I believe that the market will reach 4,656.5 level soon.
P.S
Please, note that an oversold/overbought condition can last for a long time, and therefore being oversold/overbought doesn't mean a price rally will come soon, or at all.
Like and subscribe and comment my ideas if you enjoy them!
EURUSD Is Going Up! Long!
Take a look at our analysis for EURUSD.
Time Frame: 6h
Current Trend: Bullish
Sentiment: Oversold (based on 7-period RSI)
Forecast: Bullish
The market is approaching a key horizontal level 1.173.
Considering the today's price action, probabilities will be high to see a movement to 1.181.
P.S
The term oversold refers to a condition where an asset has traded lower in price and has the potential for a price bounce.
Overbought refers to market scenarios where the instrument is traded considerably higher than its fair value. Overvaluation is caused by market sentiments when there is positive news.
Like and subscribe and comment my ideas if you enjoy them!

NZDUSD Will Grow! Buy!
Please, check our technical outlook for NZDUSD.
Time Frame: 1D
Current Trend: Bullish
Sentiment: Oversold (based on 7-period RSI)
Forecast: Bullish
The market is approaching a significant support area 0.579.
The underlined horizontal cluster clearly indicates a highly probable bullish movement with target 0.591 level.
P.S
We determine oversold/overbought condition with RSI indicator.
When it drops below 30 - the market is considered to be oversold.
When it bounces above 70 - the market is considered to be overbought.
Like and subscribe and comment my ideas if you enjoy them!

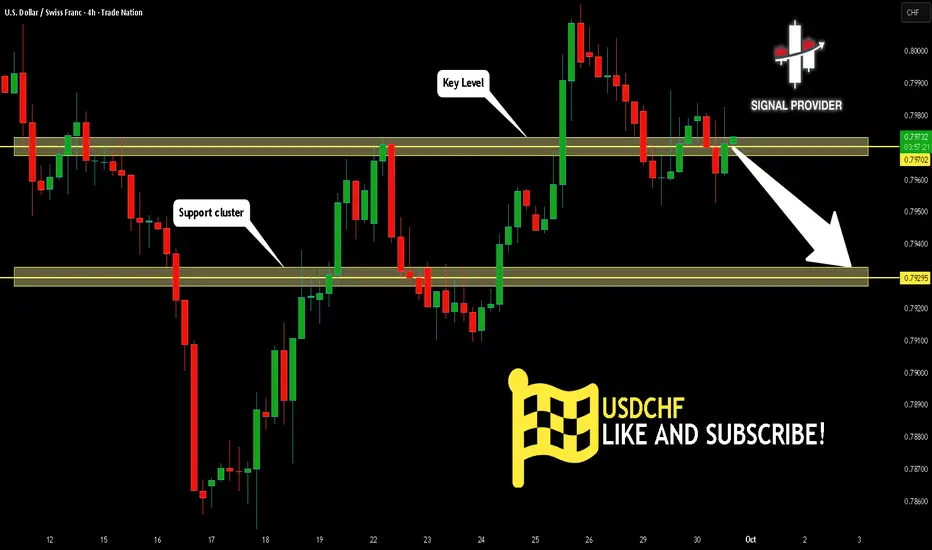
USDCHF Will Go Lower From Resistance! Short!
Here is our detailed technical review for USDCHF.
Time Frame: 4h
Current Trend: Bearish
Sentiment: Overbought (based on 7-period RSI)
Forecast: Bearish
The market is on a crucial zone of supply 0.797.
The above-mentioned technicals clearly indicate the dominance of sellers on the market. I recommend shorting the instrument, aiming at 0.792 level.
P.S
Overbought describes a period of time where there has been a significant and consistent upward move in price over a period of time without much pullback.
Like and subscribe and comment my ideas if you enjoy them!
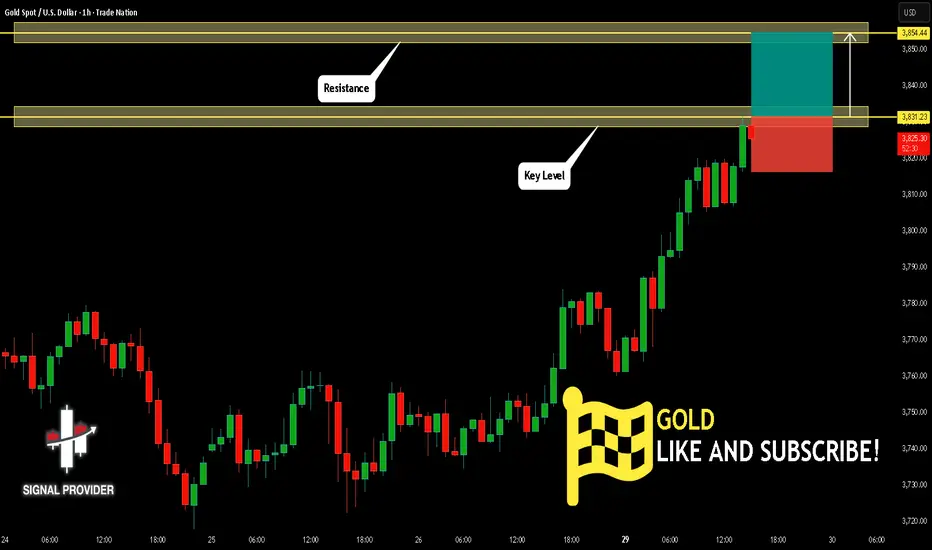
GOLD Will Go Up From Support! Long!
Take a look at our analysis for GOLD.
Time Frame: 1h
Current Trend: Bullish
Sentiment: Oversold (based on 7-period RSI)
Forecast: Bullish
The price is testing a key support 3,831.23.
Current market trend & oversold RSI makes me think that buyers will push the price. I will anticipate a bullish movement at least to 3,854.44 level.
P.S
Please, note that an oversold/overbought condition can last for a long time, and therefore being oversold/overbought doesn't mean a price rally will come soon, or at all.
Like and subscribe and comment my ideas if you enjoy them!
USDJPY Will Go Lower! Sell!
Please, check our technical outlook for USDJPY.
Time Frame: 1D
Current Trend: Bearish
Sentiment: Overbought (based on 7-period RSI)
Forecast: Bearish
The market is trading around a solid horizontal structure 148.642.
The above observations make me that the market will inevitably achieve 146.320 level.
P.S
The term oversold refers to a condition where an asset has traded lower in price and has the potential for a price bounce.
Overbought refers to market scenarios where the instrument is traded considerably higher than its fair value. Overvaluation is caused by market sentiments when there is positive news.
Like and subscribe and comment my ideas if you enjoy them!

GBPUSD Will Go Down! Short!
Here is our detailed technical review for GBPUSD.
Time Frame: 1D
Current Trend: Bearish
Sentiment: Overbought (based on 7-period RSI)
Forecast: Bearish
The market is testing a major horizontal structure 1.343.
Taking into consideration the structure & trend analysis, I believe that the market will reach 1.320 level soon.
P.S
We determine oversold/overbought condition with RSI indicator.
When it drops below 30 - the market is considered to be oversold.
When it bounces above 70 - the market is considered to be overbought.
Like and subscribe and comment my ideas if you enjoy them!

GBPJPY Will Move Higher! Buy!
Take a look at our analysis for GBPJPY.
Time Frame: 6h
Current Trend: Bullish
Sentiment: Oversold (based on 7-period RSI)
Forecast: Bullish
The market is approaching a key horizontal level 199.725.
Considering the today's price action, probabilities will be high to see a movement to 200.402.
P.S
Overbought describes a period of time where there has been a significant and consistent upward move in price over a period of time without much pullback.
Like and subscribe and comment my ideas if you enjoy them!

USDJPY Will Go Lower! Short!
Please, check our technical outlook for USDJPY.
Time Frame: 2h
Current Trend: Bearish
Sentiment: Overbought (based on 7-period RSI)
Forecast: Bearish
The market is approaching a significant resistance area 149.732.
Due to the fact that we see a positive bearish reaction from the underlined area, I strongly believe that sellers will manage to push the price all the way down to 148.888 level.
P.S
We determine oversold/overbought condition with RSI indicator.
When it drops below 30 - the market is considered to be oversold.
When it bounces above 70 - the market is considered to be overbought.
Like and subscribe and comment my ideas if you enjoy them!

BITCOIN Is Going Up! Buy!
Take a look at our analysis for BITCOIN.
Time Frame: 9h
Current Trend: Bullish
Sentiment: Oversold (based on 7-period RSI)
Forecast: Bullish
The price is testing a key support 109,230.63.
Current market trend & oversold RSI makes me think that buyers will push the price. I will anticipate a bullish movement at least to 112,035.52 level.
P.S
We determine oversold/overbought condition with RSI indicator.
When it drops below 30 - the market is considered to be oversold.
When it bounces above 70 - the market is considered to be overbought.
Like and subscribe and comment my ideas if you enjoy them!

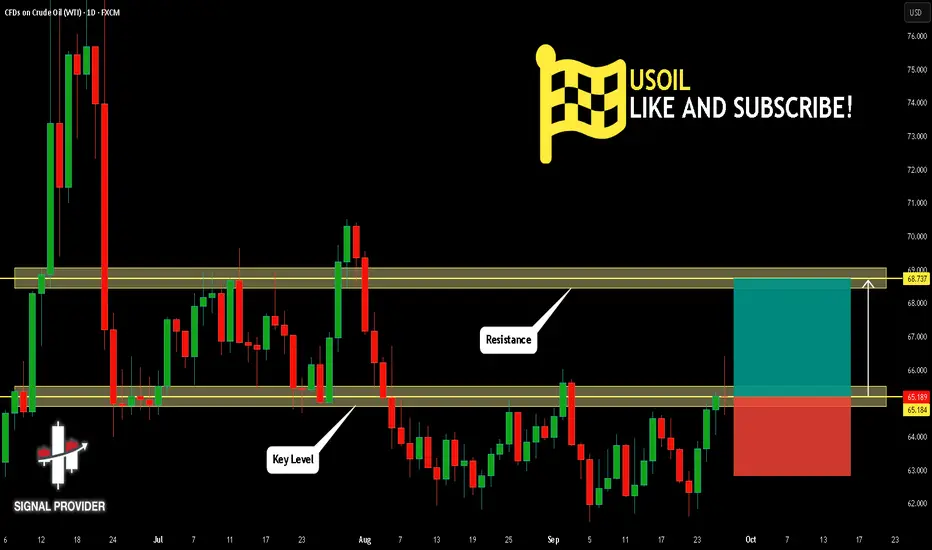
USOIL Is Bullish! Long!
Please, check our technical outlook for USOIL.
Time Frame: 1D
Current Trend: Bullish
Sentiment: Oversold (based on 7-period RSI)
Forecast: Bullish
The market is approaching a significant support area 65.184.
The underlined horizontal cluster clearly indicates a highly probable bullish movement with target 68.737 level.
P.S
Please, note that an oversold/overbought condition can last for a long time, and therefore being oversold/overbought doesn't mean a price rally will come soon, or at all.
Like and subscribe and comment my ideas if you enjoy them!
EURUSD Is Very Bearish! Sell!
Here is our detailed technical review for EURUSD.
Time Frame: 9h
Current Trend: Bearish
Sentiment: Overbought (based on 7-period RSI)
Forecast: Bearish
The market is on a crucial zone of supply 1.170.
The above-mentioned technicals clearly indicate the dominance of sellers on the market. I recommend shorting the instrument, aiming at 1.158 level.
P.S
The term oversold refers to a condition where an asset has traded lower in price and has the potential for a price bounce.
Overbought refers to market scenarios where the instrument is traded considerably higher than its fair value. Overvaluation is caused by market sentiments when there is positive news.
Like and subscribe and comment my ideas if you enjoy them!

AUDNZD at Historical Levels - Layer ShortsAUDNZD at Historical Levels - Layer Shorts
Every once in a while, markets reach extreme levels that can be taken advantage of. This is one of those times.
📊 Technical Analysis:
AUD/NZD D1 RSI is currently trading at its highest daily levels ever. We have only seen this once before, in August 2020. What followed then was a 630-pip downside move over the next 4 months.
Could this happen again, and should you short it? Let’s discuss:
🌍 Fundamental Perspective:
The move higher in AUD/NZD has been largely driven by NZD weakness. This stems from deteriorating economic data for the New Zealand economy. Currently, forward markets are pricing in a 0.5% rate cut at the October 8, 2025 RBNZ meeting. This is VERY dovish, and naturally, banks have been selling NZD heavily (as also reflected in EUR/NZD and NZD/CHF).
However, pricing in a double rate cut at the upcoming RBNZ meeting may already be as dovish as it gets. Yes, another cut later this year is possible, but often currencies show their largest moves around key events like rate decisions. The RBA (Australia’s central bank) is also due to announce policy this coming week. So we have two fundamental catalysts in play.
💡 Potential Trade
How can you take advantage of this setup? I would not short it outright. Instead, I would begin layering in small short positions (maximum of 0.2% per 1 ADR). If the market moves 1 ADR against you, you can add another very small position. This way, your average short entry remains close to current levels. Eventually, we are likely to see a mean-reversion move. This may take time, but history shows that at these RSI levels (and even lower), we have often seen significant pullbacks to the downside.
Keep this pair on your radar—it may pay off nicely with patience.
Best,
Meikel

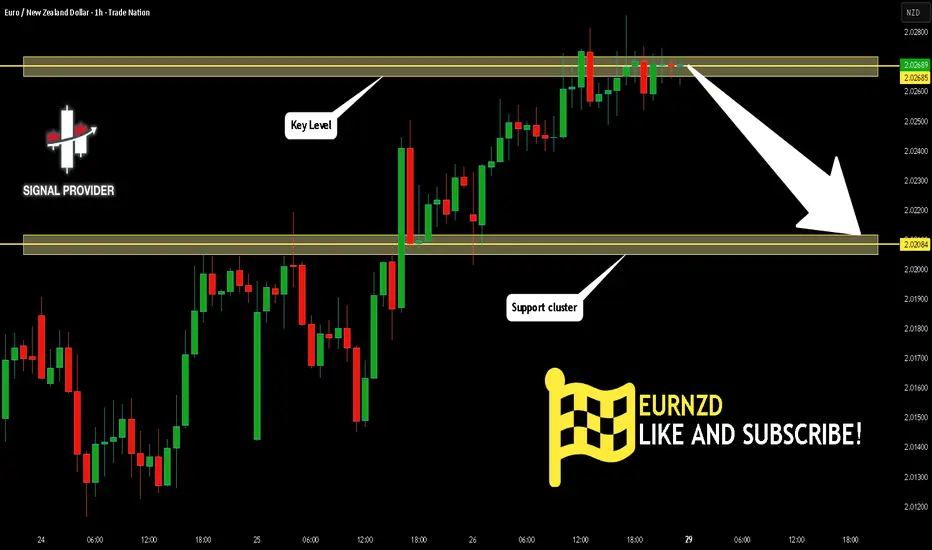
EURNZD Will Fall! Short!
Please, check our technical outlook for EURNZD.
Time Frame: 1h
Current Trend: Bearish
Sentiment: Overbought (based on 7-period RSI)
Forecast: Bearish
The market is trading around a solid horizontal structure 2.026.
The above observations make me that the market will inevitably achieve 2.020 level.
P.S
Overbought describes a period of time where there has been a significant and consistent upward move in price over a period of time without much pullback.
Like and subscribe and comment my ideas if you enjoy them!
GOLD Will Go Up From Support! Long!
Take a look at our analysis for GOLD.
Time Frame: 30m
Current Trend: Bullish
Sentiment: Oversold (based on 7-period RSI)
Forecast: Bullish
The market is approaching a key horizontal level 3,749.63.
Considering the today's price action, probabilities will be high to see a movement to 3,758.56.
P.S
The term oversold refers to a condition where an asset has traded lower in price and has the potential for a price bounce.
Overbought refers to market scenarios where the instrument is traded considerably higher than its fair value. Overvaluation is caused by market sentiments when there is positive news.
Like and subscribe and comment my ideas if you enjoy them!

GBPUSD Will Go Down! Sell!
Here is our detailed technical review for GBPUSD.
Time Frame: 6h
Current Trend: Bearish
Sentiment: Overbought (based on 7-period RSI)
Forecast: Bearish
The market is on a crucial zone of supply 1.336.
The above-mentioned technicals clearly indicate the dominance of sellers on the market. I recommend shorting the instrument, aiming at 1.326 level.
P.S
Overbought describes a period of time where there has been a significant and consistent upward move in price over a period of time without much pullback.
Like and subscribe and comment my ideas if you enjoy them!

GBPCAD Will Move Higher! Buy!
Take a look at our analysis for GBPCAD.
Time Frame: 1D
Current Trend: Bullish
Sentiment: Oversold (based on 7-period RSI)
Forecast: Bullish
The price is testing a key support 1.863.
Current market trend & oversold RSI makes me think that buyers will push the price. I will anticipate a bullish movement at least to 1.884 level.
P.S
Please, note that an oversold/overbought condition can last for a long time, and therefore being oversold/overbought doesn't mean a price rally will come soon, or at all.
Like and subscribe and comment my ideas if you enjoy them!

USDJPY Is Bullish! Buy!
Take a look at our analysis for USDJPY.
Time Frame: 1D
Current Trend: Bullish
Sentiment: Oversold (based on 7-period RSI)
Forecast: Bullish
The market is approaching a key horizontal level 147.322.
Considering the today's price action, probabilities will be high to see a movement to 149.724.
P.S
Overbought describes a period of time where there has been a significant and consistent upward move in price over a period of time without much pullback.
Like and subscribe and comment my ideas if you enjoy them!

USDJPY Will Go Higher! Long!
Take a look at our analysis for USDJPY.
Time Frame: 8h
Current Trend: Bullish
Sentiment: Oversold (based on 7-period RSI)
Forecast: Bullish
The price is testing a key support 148.376.
Current market trend & oversold RSI makes me think that buyers will push the price. I will anticipate a bullish movement at least to 149.207 level.
P.S
We determine oversold/overbought condition with RSI indicator.
When it drops below 30 - the market is considered to be oversold.
When it bounces above 70 - the market is considered to be overbought.
Like and subscribe and comment my ideas if you enjoy them!

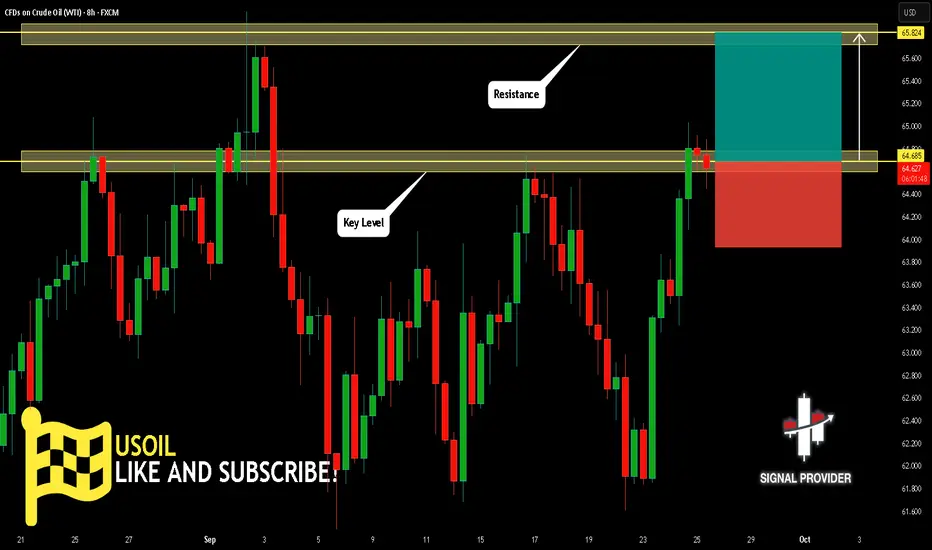
USOIL Is Bullish! Long!
Please, check our technical outlook for USOIL.
Time Frame: 8h
Current Trend: Bullish
Sentiment: Oversold (based on 7-period RSI)
Forecast: Bullish
The market is trading around a solid horizontal structure 64.685.
The above observations make me that the market will inevitably achieve 65.824 level.
P.S
The term oversold refers to a condition where an asset has traded lower in price and has the potential for a price bounce.
Overbought refers to market scenarios where the instrument is traded considerably higher than its fair value. Overvaluation is caused by market sentiments when there is positive news.
Like and subscribe and comment my ideas if you enjoy them!