EURAUD Will Go Down! Short!
Take a look at our analysis for EURAUD.
Time Frame: 1h
Current Trend: Bearish
Sentiment: Overbought (based on 7-period RSI)
Forecast: Bearish
The market is approaching a key horizontal level 1.780.
Considering the today's price action, probabilities will be high to see a movement to 1.774.
P.S
Overbought describes a period of time where there has been a significant and consistent upward move in price over a period of time without much pullback.
Like and subscribe and comment my ideas if you enjoy them!
Swing

NZDJPY Will Move Higher! Long!
Please, check our technical outlook for NZDJPY.
Time Frame: 1D
Current Trend: Bullish
Sentiment: Oversold (based on 7-period RSI)
Forecast: Bullish
The market is approaching a significant support area 86.830.
The underlined horizontal cluster clearly indicates a highly probable bullish movement with target 88.074 level.
P.S
Please, note that an oversold/overbought condition can last for a long time, and therefore being oversold/overbought doesn't mean a price rally will come soon, or at all.
Like and subscribe and comment my ideas if you enjoy them!

GOLD SELLERS WILL DOMINATE THE MARKET|SHORT
GOLD SIGNAL
Trade Direction: short
Entry Level: 3,698.25
Target Level: 3,667.27
Stop Loss: 3,718.92
RISK PROFILE
Risk level: medium
Suggested risk: 1%
Timeframe: 1h
Disclosure: I am part of Trade Nation's Influencer program and receive a monthly fee for using their TradingView charts in my analysis.
✅LIKE AND COMMENT MY IDEAS✅

GBP/USD - 1H Forecast - YoYo Trade Setups🇬🇧🇺🇸 GBP/USD – 1H Breakdown
Cable’s been wildin’ 🤯 — we smashed into that daily imbalance, tapped supply, and now price is bleeding lower straight into demand.
🔑 What’s Cooking:
Price tagged the Daily IMB + 71% retrace, then dumped.
Now chilling near demand around 1.345 – 1.348 (possible snack stop 🍫).
If bulls defend here → we get a bounce back toward 1.357 – 1.360 supply for a cheeky liquidity grab 🏹.
From there? Expect a heavy distribution dump back toward 1.3350 lows 📉
🎯 Playbook:
Demand bounce → push into 1H / 4H supply.
Reject at supply → sell-off continuation.
🔍 Outlook
Short-term: Relief bounce incoming 🕺
Mid-term: Looking heavy, bears wanna drag this lower.
Bias : Bounce first → then bigger dump 🚀🔪

AUD/USD - Forecast (To fall further)🇦🇺🇺🇸 AUD/USD – 8H Breakdown
AUD/USD just wrapped up that juicy Wave 3 run and topped near 0.6780. Now we’re cooling off with a corrective pullback — perfect spot to hunt buys 👀
🎯 Buy Zones
Buy Zone 1: 0.6520 – 0.6530 → first bounce area ⚡
Buy Zone 2 (Preferred): 0.6460 – 0.6480 → 71% retrace + wedge support 🏹
📈 Playbook
Let price dip into demand (ideally Buy Zone 2).
Load up → ride it back toward 0.6700.
If bulls flex, we sweep those 0.6780 highs for liquidity. 🚀
🔍 Outlook
Short-term: Expect deeper retrace into demand.
Mid-term: Bulls looking for another leg higher.
Bias : Pullback → Buy continuation 🔥

USD/JPY - Fake Breakout. Is price Distributing💹 USD/JPY – 4H Forecast
Weekly Structure:
Price is still holding strong above demand, with 151.0 acting as the big liquidity magnet.
Daily Structure:
We’ve been stuck in a wide consolidation range between 146.0 support and 150.9 resistance. Market keeps faking both sides, but bulls are slowly regaining control.
4H Structure:
Recent fake breakout/manipulation flushed stops before shifting bullish.
Imbalances (Daily + Weekly) got filled on the push up.
Price is now respecting the bullish structure, eyeing a move higher.
Buy Zone 1 (Preferred): 146.7 – 147.0
Buy Zone 2 (Needs confirmation): 146.1 – 146.2
Upside liquidity target sits around 150.9 – 151.0 BSL.
🔍 Outlook
Short-term: Pullback into demand zones.
Mid-term: Bullish continuation → eyes on 150.9 – 151.0.
Bias : Short-term retrace → Mid-term bullish.

USDJPY Is Bullish! Buy!
Here is our detailed technical review for USDJPY.
Time Frame: 1D
Current Trend: Bullish
Sentiment: Oversold (based on 7-period RSI)
Forecast: Bullish
The market is on a crucial zone of demand 147.950.
The oversold market condition in a combination with key structure gives us a relatively strong bullish signal with goal 150.890 level.
P.S
The term oversold refers to a condition where an asset has traded lower in price and has the potential for a price bounce.
Overbought refers to market scenarios where the instrument is traded considerably higher than its fair value. Overvaluation is caused by market sentiments when there is positive news.
Like and subscribe and comment my ideas if you enjoy them!

AUDUSD Is Very Bullish! Long!
Take a look at our analysis for AUDUSD.
Time Frame: 6h
Current Trend: Bullish
Sentiment: Oversold (based on 7-period RSI)
Forecast: Bullish
The price is testing a key support 0.659.
Current market trend & oversold RSI makes me think that buyers will push the price. I will anticipate a bullish movement at least to 0.666 level.
P.S
We determine oversold/overbought condition with RSI indicator.
When it drops below 30 - the market is considered to be oversold.
When it bounces above 70 - the market is considered to be overbought.
Like and subscribe and comment my ideas if you enjoy them!

Gold Forecast (XAUUSD)🟡 GOLD – 1H Breakdown
Alright traders, here’s the scoop 👀
We’re chopping around mid-range after that last BOS. Liquidity is literally everywhere — BSLs chilling above the highs, SSLs hiding under the lows. Market’s teasing both sides like it’s fishing for stops 🎣.
🔑 Levels to Watch:
Buy Zone 1 (Preferred snack stop): 3,600 – 3,620 🍫
Buy Zone 2 (Deeper dip special): 3,560 – 3,580 🥤
Trendline liquidity just waiting to get grabbed… you know how it goes 😏
Upside target: 3,700+ — where the big liquidity bags are stacked 🎯
🛠 Possible Plays:
Quick liquidity sweep under the lows → tap into Buy Zone 1 or 2 → rocket launch 🚀
If demand fails, we’re diving into the swing range 3,530 – 3,550 for a bigger reload.
🔍 Outlook
Short-term: Expect a cheeky stop-hunt under the lows.
Mid-term: Bulls still in control, eyes on that juicy 3,700+ grab.
Bias : Liquidity sweep down → Buy for continuation 📈✨

SILVER Is Going Down! Sell!
Please, check our technical outlook for SILVER.
Time Frame: 1h
Current Trend: Bearish
Sentiment: Overbought (based on 7-period RSI)
Forecast: Bearish
The market is trading around a solid horizontal structure 4,309.9.
The above observations make me that the market will inevitably achieve 4,247.3 level.
P.S
Overbought describes a period of time where there has been a significant and consistent upward move in price over a period of time without much pullback.
Like and subscribe and comment my ideas if you enjoy them!

EURGBP Will Fall! Short!
Here is our detailed technical review for EURGBP.
Time Frame: 1D
Current Trend: Bearish
Sentiment: Overbought (based on 7-period RSI)
Forecast: Bearish
The market is testing a major horizontal structure 0.871.
Taking into consideration the structure & trend analysis, I believe that the market will reach 0.864 level soon.
P.S
Please, note that an oversold/overbought condition can last for a long time, and therefore being oversold/overbought doesn't mean a price rally will come soon, or at all.
Like and subscribe and comment my ideas if you enjoy them!

GBPJPY Will Go Higher From Support! Buy!
Take a look at our analysis for GBPJPY.
Time Frame: 1D
Current Trend: Bullish
Sentiment: Oversold (based on 7-period RSI)
Forecast: Bullish
The market is approaching a key horizontal level 199.349.
Considering the today's price action, probabilities will be high to see a movement to 200.763.
P.S
The term oversold refers to a condition where an asset has traded lower in price and has the potential for a price bounce.
Overbought refers to market scenarios where the instrument is traded considerably higher than its fair value. Overvaluation is caused by market sentiments when there is positive news.
Like and subscribe and comment my ideas if you enjoy them!

BITCOIN Will Go Higher From Support! Long!
Please, check our technical outlook for BITCOIN.
Time Frame: 1h
Current Trend: Bullish
Sentiment: Oversold (based on 7-period RSI)
Forecast: Bullish
The market is approaching a significant support area 116,794.22.
The underlined horizontal cluster clearly indicates a highly probable bullish movement with target 117,811.55 level.
P.S
We determine oversold/overbought condition with RSI indicator.
When it drops below 30 - the market is considered to be oversold.
When it bounces above 70 - the market is considered to be overbought.
Like and subscribe and comment my ideas if you enjoy them!

GBPUSD Will Go Higher! Buy!
Take a look at our analysis for GBPUSD.
Time Frame: 1D
Current Trend: Bullish
Sentiment: Oversold (based on 7-period RSI)
Forecast: Bullish
The price is testing a key support 1.349.
Current market trend & oversold RSI makes me think that buyers will push the price. I will anticipate a bullish movement at least to 1.366 level.
P.S
Please, note that an oversold/overbought condition can last for a long time, and therefore being oversold/overbought doesn't mean a price rally will come soon, or at all.
Like and subscribe and comment my ideas if you enjoy them!

GBPAUD Will Go Up! Long!
Please, check our technical outlook for GBPAUD.
Time Frame: 9h
Current Trend: Bullish
Sentiment: Oversold (based on 7-period RSI)
Forecast: Bullish
The market is trading around a solid horizontal structure 2.047.
The above observations make me that the market will inevitably achieve 2.062 level.
P.S
The term oversold refers to a condition where an asset has traded lower in price and has the potential for a price bounce.
Overbought refers to market scenarios where the instrument is traded considerably higher than its fair value. Overvaluation is caused by market sentiments when there is positive news.
Like and subscribe and comment my ideas if you enjoy them!

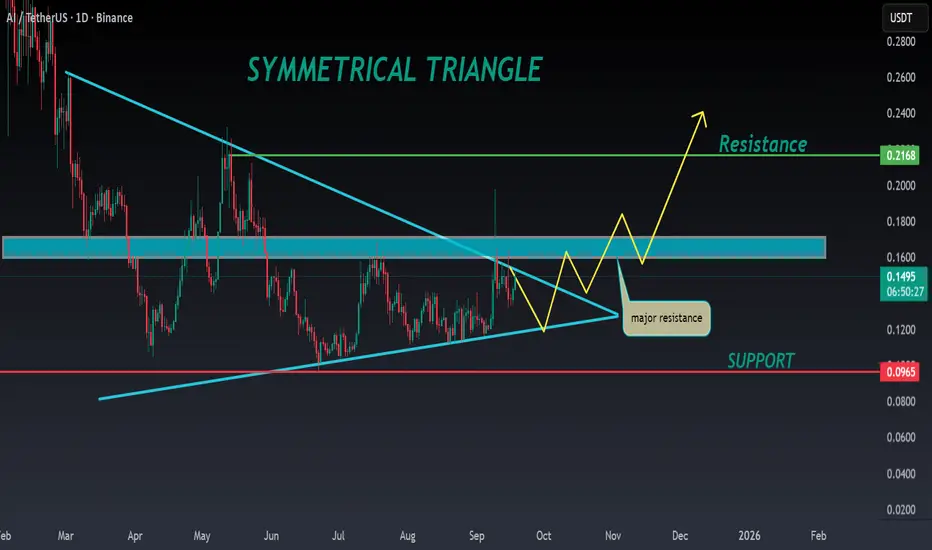
AI ANALYSIS🔮#AI Analysis 💰💰
#AI is trading in a symmetrical triangle in a weekly time frame and if it breakouts with high volume then we can see a bullish momentum in #AI. Before that we will see little bit bearish movement .
🔖 Current Price: $0.1490
⏳ Target Price: $0.2100
⁉️ What to do?
- We can trade according to the chart and make some profits in #AI. Keep your eyes on the chart, observe trading volume and stay accustom to market moves.💲💲
#AI #Cryptocurrency #Pump #DYOR
GOLD Will Move Lower! Short!
Here is our detailed technical review for GOLD.
Time Frame: 2h
Current Trend: Bearish
Sentiment: Overbought (based on 7-period RSI)
Forecast: Bearish
The market is testing a major horizontal structure 3,641.09.
Taking into consideration the structure & trend analysis, I believe that the market will reach 3,599.64 level soon.
P.S
We determine oversold/overbought condition with RSI indicator.
When it drops below 30 - the market is considered to be oversold.
When it bounces above 70 - the market is considered to be overbought.
Like and subscribe and comment my ideas if you enjoy them!

AUDUSD Is Very Bullish! Long!
Please, check our technical outlook for AUDUSD.
Time Frame: 12h
Current Trend: Bullish
Sentiment: Oversold (based on 7-period RSI)
Forecast: Bullish
The market is approaching a significant support area 0.662.
The underlined horizontal cluster clearly indicates a highly probable bullish movement with target 0.668 level.
P.S
Please, note that an oversold/overbought condition can last for a long time, and therefore being oversold/overbought doesn't mean a price rally will come soon, or at all.
Like and subscribe and comment my ideas if you enjoy them!

NZDUSD Is Going Up! Buy!
Here is our detailed technical review for NZDUSD.
Time Frame: 9h
Current Trend: Bullish
Sentiment: Oversold (based on 7-period RSI)
Forecast: Bullish
The market is on a crucial zone of demand 0.589.
The oversold market condition in a combination with key structure gives us a relatively strong bullish signal with goal 0.594 level.
P.S
The term oversold refers to a condition where an asset has traded lower in price and has the potential for a price bounce.
Overbought refers to market scenarios where the instrument is traded considerably higher than its fair value. Overvaluation is caused by market sentiments when there is positive news.
Like and subscribe and comment my ideas if you enjoy them!

NZD/USD - Forecast Update 🕰 Weekly Structure
Price has been holding above 0.58 strong support.
Currently ranging between 0.58 – 0.62.
A break above 0.60 – 0.605 could open the door for a run into 0.62 supply.
Failure here and a drop below 0.58 would confirm deeper downside.
📉 Daily View
Price is testing 0.5950 key zone.
Strong liquidity sits above 0.60, while demand has been respected around 0.585 – 0.59.
Daily structure favors a push higher toward 0.61 – 0.62, unless sellers reclaim 0.585.
⏱ 8H Structure
Bounce seen from major buyer level at 0.59.
Short-term target is 0.60 – 0.605 resistance.
If that zone breaks, upside continuation into 0.617 – 0.62 is next.
📌 Outlook
Short-term bullish bounce → Watching 0.60 – 0.605 for reaction.
Break higher → rally toward 0.62.
Rejection here → possible retrace back into 0.585 – 0.59 support.
Bias : Short-term bullish 🔼 → Mid-term depends on 0.60/0.605 breakout.

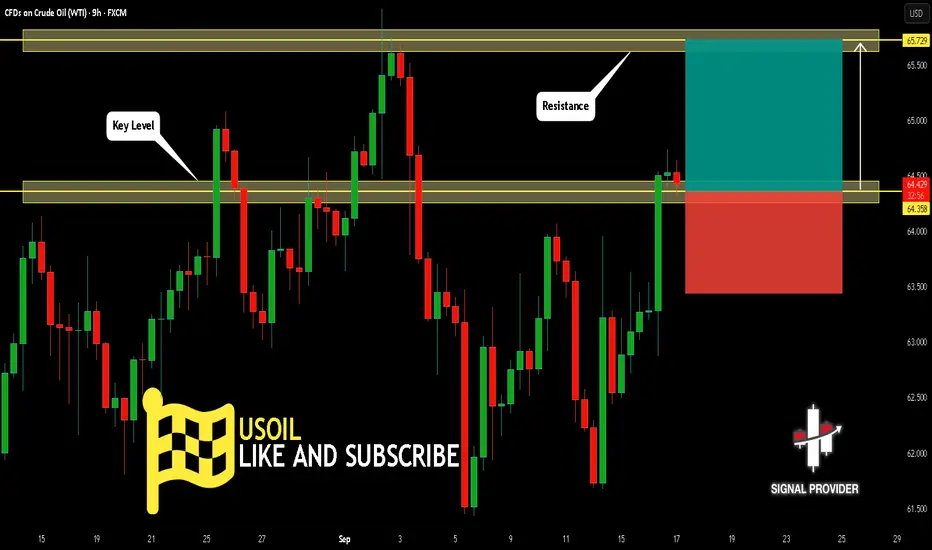
USOIL Will Grow! Long!
Take a look at our analysis for USOIL.
Time Frame: 9h
Current Trend: Bullish
Sentiment: Oversold (based on 7-period RSI)
Forecast: Bullish
The price is testing a key support 64.358.
Current market trend & oversold RSI makes me think that buyers will push the price. I will anticipate a bullish movement at least to 65.729 level.
P.S
We determine oversold/overbought condition with RSI indicator.
When it drops below 30 - the market is considered to be oversold.
When it bounces above 70 - the market is considered to be overbought.
Like and subscribe and comment my ideas if you enjoy them!
GBPJPY Will Go Lower! Short!
Here is our detailed technical review for GBPJPY.
Time Frame: 3h
Current Trend: Bearish
Sentiment: Overbought (based on 7-period RSI)
Forecast: Bearish
The market is testing a major horizontal structure 199.845.
Taking into consideration the structure & trend analysis, I believe that the market will reach 199.284 level soon.
P.S
Please, note that an oversold/overbought condition can last for a long time, and therefore being oversold/overbought doesn't mean a price rally will come soon, or at all.
Like and subscribe and comment my ideas if you enjoy them!

GBPCHF Will Go Up! Buy!
Take a look at our analysis for GBPCHF.
Time Frame: 3h
Current Trend: Bullish
Sentiment: Oversold (based on 7-period RSI)
Forecast: Bullish
The market is approaching a key horizontal level 1.073.
Considering the today's price action, probabilities will be high to see a movement to 1.077.
P.S
The term oversold refers to a condition where an asset has traded lower in price and has the potential for a price bounce.
Overbought refers to market scenarios where the instrument is traded considerably higher than its fair value. Overvaluation is caused by market sentiments when there is positive news.
Like and subscribe and comment my ideas if you enjoy them!
