XAUUSD Bearish Retracement Targeting $4,000 SupportContext and Trend
Prior Bullish Trend: The chart clearly shows a strong, sustained uptrend leading up to October 22nd, with the price moving from below $3,920 to a peak near $4,200.
Recent Sharp Reversal: This strong bullish move was abruptly interrupted by a massive bearish candlestick on October 22nd, indicating a sharp and significant sell-off from the high. This move marks a potential shift in the short-term momentum.
Current Price Action and Key Zones
Current Consolidation/Retracement: Since the sharp drop, the price has entered a phase of consolidation or a retracement (a move back up) within the area that saw the sharpest selling pressure.
Supply/Resistance Zone: The blue shaded rectangle, which ranges roughly from $4,080 to $4,120, is a key area. This zone represents an area where the market may have found previous support or, more likely, is now acting as a supply zone (resistance) after the large drop. Traders often look to sell when the price re-enters a zone that previously broke down quickly, anticipating fresh selling pressure.
Price Prediction (The Path): The drawn arrows indicate a predicted move:
The price moves up to test the $4,080 - $4,120 supply zone.
Upon hitting resistance, the price is expected to reverse and fall.
The predicted target for the drop is the dashed green line at $4,009.10 (a level very close to the significant psychological support level of $4,000).
Conclusion
The chart suggests a high-probability short-term selling opportunity (or "short" trade) if the price reaches the supply zone, with the trade aiming for the major support level just above $4,000. The setup is based on the technical analysis pattern of a bearish continuation after a strong impulse move down.
Swingtrade

OP/USDT – Order Block Accumulation + RSI OversoldOP is currently bound within a consolidation range, showing signs of a potential order block formation—a zone where larger players may be accumulating. These structures often precede impulsive, expansive moves once the range is broken. We're seeing tight price action between $0.400 and $0.410, which could act as a springboard.
🔍 The RSI is deep into oversold territory, signaling that the selling momentum may be fading. This aligns with the idea of a reversal or breakout from the current accumulation zone. Watch for volume spikes or candle structure shifts as potential early signals.
📊 Trade Idea:
Entry Zone: $0.400 – $0.410
Take Profit Targets: $0.462 → $0.499 → $0.570
Stop Loss: Below $0.39

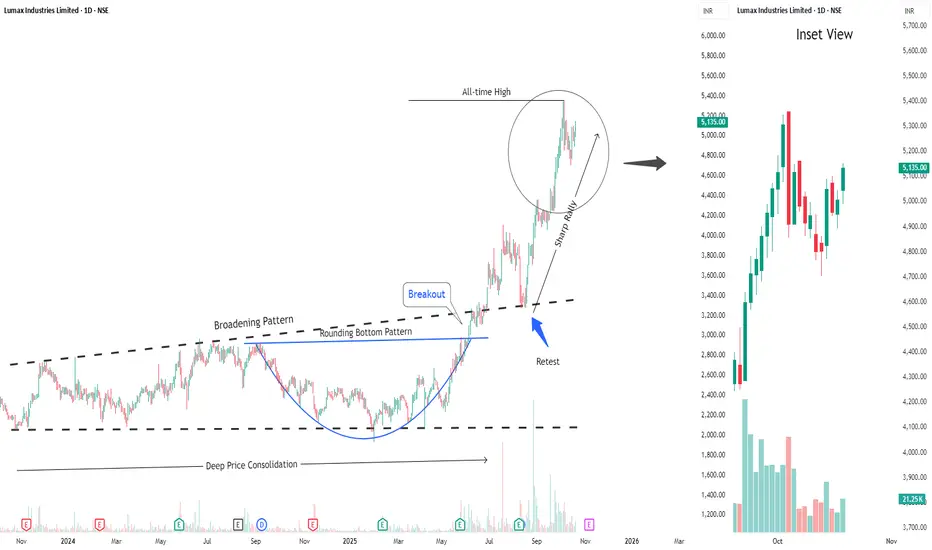
Buy Lumax IndustriesShort Term Trading Advice by Goodluck Capital
Buy Lumax Industries
● Buy Range- 5050 - 5150
● Target- 5350 - 5450
● StopLoss- below 4850
● Upside Potential- 5% -7%
● Approx trade duration 12 - 14 days
XAUUSD Bullish Continuation Setup: Post-Correction Rally to ?Key Observations and Strategy:Prior Momentum: The market showed a strong, rapid bullish move throughout October 2025.Current Price Action: The price is undergoing a healthy pullback (correction) from its recent high, currently sitting around 4,246.78.
Support Zone: The critical demand area is highlighted in light blue, acting as a Support zone roughly between 4,155}$ and 4,223. This is where buying pressure is expected to resume.
Trade Setup (Long/Buy): The strategy is to enter a long position (buy) on a rebound from the support area, banking on the continuation of the primary uptrend.
Stop-Loss: The trade is protected by a Stop-Loss placed just below the support at 4,155.67. This is the point where the bullish view would be invalidated.
Target (Take Profit): The anticipated peak for this move is the Target at 4,426.70.
Conclusion: This setup represents a high-probability trade for a bullish continuation pattern following a recent, significant rally.

BTC/USD: Potential Bearish Continuation After Support BreakKey Technical Observations
Prior Consolidation and Support: The price appears to have been trading within a range, with a significant support level identified around $109,000 to $110,000 (marked by the lowest horizontal black line). This level had been tested and held multiple times, particularly throughout late August and September.
Support Break: A large bearish candlestick (red) recently broke decisively below this key support level. This is a strong technical signal indicating that the bears have taken control and that the prior consolidation range is over.
Setup for a Short Trade (Short Entry): The chart illustrates a classic "break and retest" strategy, often used in technical analysis:
Entry/Re-entry Zone: The suggested trade entry (indicated by the blue box and the curved arrow) is a retest of the broken support level, which now acts as new resistance around the $109,000 mark.
Stop Loss: The Stop Loss is strategically placed above the most recent cluster of resistance, specifically above $112,682, to limit potential losses if the price moves against the trade and re-enters the previous high-value area.
Target: The Target price is set significantly lower at $104,001, suggesting the expectation of a strong downward momentum move, possibly towards the next significant support area not explicitly marked on the visible chart.
Risk/Reward Ratio: The setup shows a favorable risk/reward ratio, as the potential gain (Target to Entry) is visibly larger than the potential loss (Stop Loss to Entry).
Conclusion
The current chart structure strongly favors a short position on BTC/USD, anticipating a bearish continuation. The breakout below a critical support zone suggests the path of least resistance is now to the downside, with traders looking to enter a short position on a pullback to the broken support-turned-resistance area.

BTC: Monthly FVG Retest Before New ATHCurrent Status: The price is around $104,447 and is currently in a strong corrective move after reaching a recent high.
All-Time High (ATH): The previous peak is marked near $126,311. This is the key long-term target.
Monthly Fair Value Gap (FVG): The blue box between approximately $95,000 and $98,000 is a "Monthly FVG". This area is expected to act as a magnet for the price to retrace to.
Projected Path: The analyst expects the price to drop further into the Monthly FVG (the $95k - $98k zone) before finding strong support. Following this test, a major rally is projected to push the price back up to hit the All-Time High near $126,311.
The main idea is a deep correction to a technical support level (FVG) followed by a bullish continuation to a new ATH.

Bitcoin Bearish Continuation from Daily FVGa bearish continuation setup on Bitcoin (BTC/USD) in the daily timeframe.
After a sharp rejection from the Daily Fair Value Gap (FVG) zone between roughly $114,000–$120,000, price shows strong bearish momentum. The large red candle indicates sellers’ dominance, and the marked downward arrow projects a potential move toward lower support zones around $108,000 and $105,000, which act as the next liquidity levels or demand areas.

XAUUSD: $4,400 Target Next! Gold Bull Run ContinuesKey Observations:
Massive Uptrend: The chart clearly displays a strong, multi-day uptrend, marked by a series of high-momentum green (bullish) candlesticks.
Recent Price Action: Price has recently surged, followed by a minor retracement (the most recent red candle), but remains near the top of the move. This indicates the primary momentum is still firmly to the upside.
Key Support/Demand Zones:Immediate Demand (Yellow Box): A small yellow box is marked around the $\$4,250$ area. This represents a very recent, short-term support or 'flip' zone where price broke out and could potentially retest before moving higher.Deeper Demand (Blue Box): A larger blue box (around $\$4,130$ to $\$4,190$) represents a more significant, underlying demand zone.
Projected Price Action: The hand-drawn path suggests a direct continuation with potentially only a minor dip:
The path shows a small pullback toward the $\$4,300$ area (not explicitly marked by a zone) or a brief sideways move.
The black arrow points to an anticipated strong push up to the final target, resuming the dominant uptrend without necessarily hitting the marked yellow or blue zones.
Target: A dotted blue line at $\$4,400.69$ is the clear final target for this trade setup.

Gold Bullish Continuation Toward 4,300 TargetTrend Direction: The overall structure is clearly bullish, with price continuing to rise after breaking previous resistance levels.
Price Action: After a strong impulsive move upward, a small corrective phase (pullback) is visible — represented by the zigzag arrow — suggesting a healthy retracement before continuation.
Key Zone: The highlighted blue-green box marks a demand or fair value gap (FVG) region where buyers previously entered strongly, likely acting as a support area for future pullbacks.
Current Price: Around $4,195.84, maintaining bullish momentum.
Target: The projection line points toward a target zone near $4,300, indicating the next resistance or profit-taking level.
Overall Sentiment: Bullish continuation toward the upper target, provided the price sustains above the previous support zone around $4,100–$4,000.

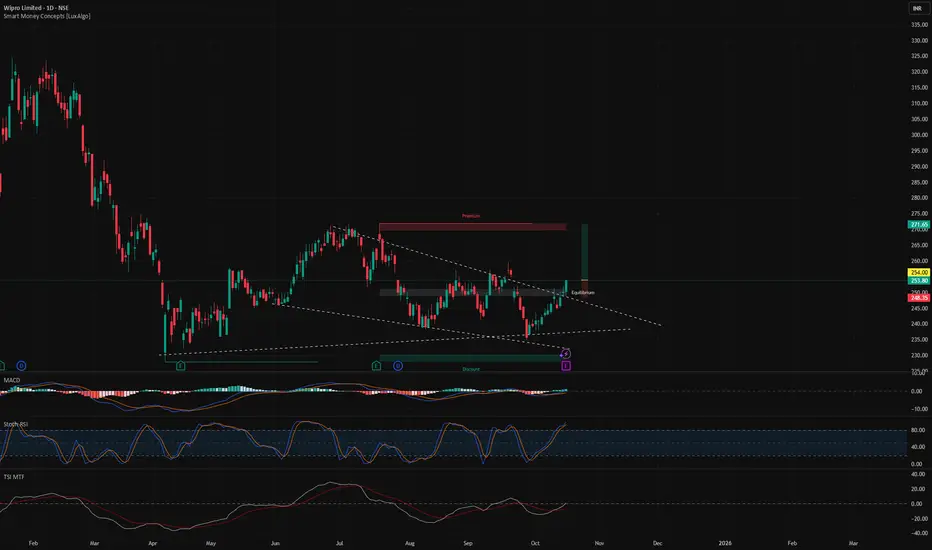
Breakout in WIPROBreakout in WIPRO.
Entry - 254
Targets - 270, 285 & 310
SL - 248
DISCLAIMER: I am not SEBI registered and the ideas posted are only for educational purpose. Do a proper analysis and always trade with STOP LOSS.
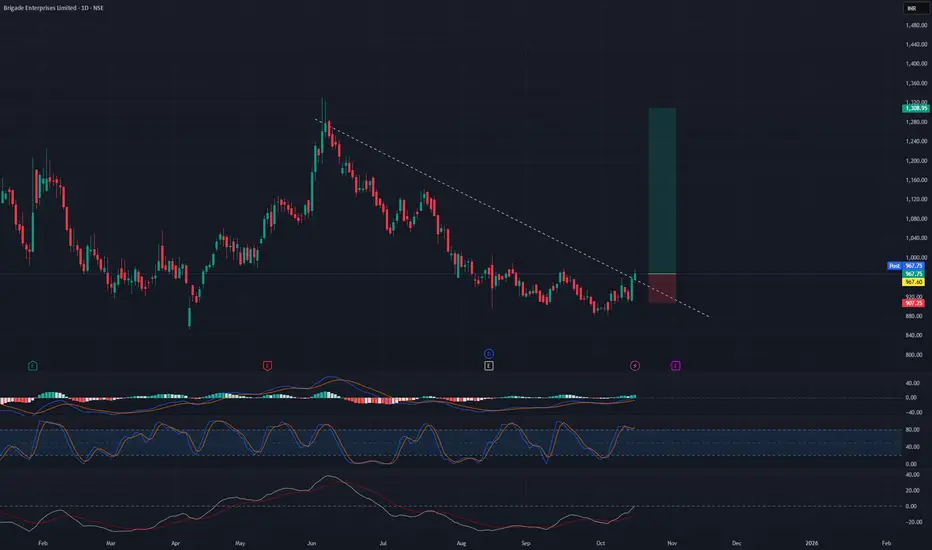
Breakout trading in BRIGADESwing trading opportunity in BRIGADE.
Entry - 970
Targets - 1130 & 1300
SL - 904
DISCLAIMER: I am not SEBI registered and the ideas posted are only for educational purpose. Do a proper analysis and always trade with STOP LOSS.
Swing trade opportunity in INOX WINDSwing trade opportunity in INOX WIND.
Entry - 150
Targets - 175 & 190
DISCLAIMER: I am not SEBI registered and the ideas posted are only for educational purpose. Always trade with proper STOP LOSS.

ETH/USD Bearish Retracement from Daily FVG Zonea bearish retracement setup on Ethereum (ETH/USDT) in the daily timeframe. After a strong bearish impulse, the price entered a highlighted Daily Fair Value Gap (FVG) zone — a potential area of supply where sellers may regain control. The projection indicates a likely short-term pullback into the FVG before continuing downward toward Target 1 (≈ $3,601) and Target 2 (≈ $3,399).

Gold (XAU/USD) Bearish Pullback from Resistance Zonea potential bearish setup forming after a strong bullish rally. The price recently surged upward, reaching a key resistance zone (highlighted in light blue). This zone aligns with previous structural highs, making it a likely area for sellers to step in.
After testing this resistance, the chart indicates a pullback or retracement setup — the black curved arrow suggests an expected downward move. The Stop Loss is placed just above the resistance zone around $4,167, protecting against a breakout continuation. The Target is marked near $4,121, where prior support and a minor demand level coincide.
This setup represents a short-term bearish retracement within a potentially larger bullish context, aiming to capitalize on short-term rejection from resistance before any continuation move.

XAUUSD: Targeting New Highs After PullbackKey Observations:
Recent Momentum: The market has shown strong recent bullish (upward) momentum, indicated by a series of large green candles leading up to the current price level.
Current Price: The current price is around $4,102.61.
Continuation Pattern: The analysis shows a bullish continuation pattern overlaid on the chart (the black curved line and green arrow). This suggests the trader anticipates a brief pullback followed by a strong move up to the target. The anticipated pattern resembles a potential bull flag/pennant or an "S-curve" retest before continuation.
Entry/Pullback Zone: The immediate blue zone below the current price (around $4,085 - $4,090) and the lower blue zone (around $4,060 - $4,067) represent likely support areas where a pullback might occur before the rally resumes.
Trading Setup Details:
Target (Take Profit): $4,130.20 (A clear horizontal resistance or projected high).
Stop Loss (Risk Limit): $4,045.45 (Placed well below the lower support zone, indicating a protective measure against a reversal of the bullish trend).
Conclusion:
The analysis is strongly bullish. The setup is based on expecting the current upward trend to continue after a minor technical correction/retest of a key support level.

XAUUSD 4H: Bullish Continuation Trade SetupKey Observations:
Bullish Momentum: The chart displays a large bullish candle breaking significantly upward just before the potential entry point. This suggests strong recent buying pressure and momentum.
Support Zone: A "Support Zone" is highlighted in red/blue, centered around the Entry Point of 4,080.06 and 4,079.58. This zone likely represents a recent area of consolidation or previous resistance that has been broken and is expected to now act as support.
Entry and Exit:
Entry Point: ≈4,080.06 (indicated by the solid line at the bottom of the green potential profit box).
Stop Loss (Risk): 4,065.61 and 4,065.63 (indicated by the bottom of the red box, representing the maximum acceptable loss).
Take Profit (Reward): 4,100.22 (indicated by the dashed line at the top of the green box, representing the target price).
Risk/Reward Ratio (R:R): The setup suggests a favorable risk/reward ratio, as the potential profit (distance from Entry to Take Profit) is visibly larger than the potential loss (distance from Entry to Stop Loss).
Calculation: Risk ≈4080.06−4065.61=14.45. Reward ≈4100.22−4080.06=20.16. The R:R is ≈20.16/14.45≈1.39:1.
Trading Hypothesis:
The strategy shown is a "buy the pullback" or "continuation" strategy. The expectation is that after the initial sharp bullish move, the price might briefly pull back to the identified Support Zone (the Entry Point) before continuing its upward trajectory toward the Take Profit target of 4,100.22.

After a strong downward movement, the price has formed a base anAfter a strong downward movement, the price has formed a base and is now showing signs of upward momentum. The chart suggests a long trade setup, with clear targets at 113,052 (Target 1) and 114,037 (Target 2), while maintaining a stop loss around 111,000.

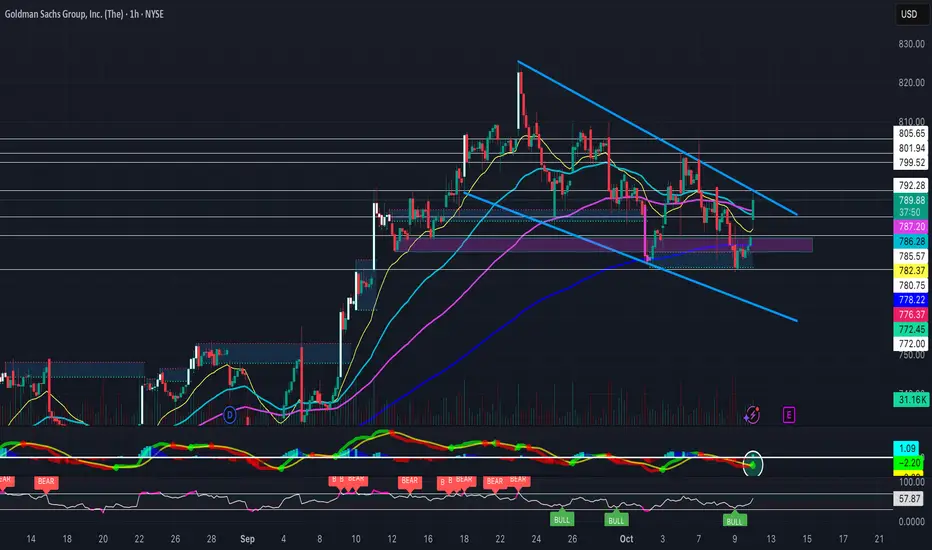
Falling Wedge Heading into EarningsAfter previously breaking out of a falling wedge to hit new ATH's, NYSE:GS is holding yet another falling wedge heading into earnings next week. (Previous Chart Below)
Its EMA's are curling upwards, some bullish hidden divergence on the RSI, a MACD golden cross, and a bullish FVG formed as support- Will definitely be watching this one.
GMDC Breakout Setup: Buy Above 637Entry: Buy above 637 (recent resistance and Fibonacci breakout spot).
Target 1: 673 (Fibonacci 0.382 retracement).
Target 2: 703 (Fibonacci 0.5 retracement).
Target 3: 733 (Fibonacci 0.618 retracement).
Stoploss: 615 (below recent support and trendline).
Volume spike and RSI uptick signal momentum

Gold Daily Bullish FVG Reaction with Upside Targetsa bullish setup on Gold (XAU/USD) in the daily timeframe. After a sharp decline, price has entered a highlighted “Daily Fair Value Gap (FVG)” zone, suggesting a potential area of demand or price imbalance. From this zone, a possible bullish reaction is indicated with an upward arrow, projecting a retracement toward three target levels: Target 1 at 3,970, Target 2 at 3,980, and Target 3 at 3,990. The chart implies that if the price maintains support within the FVG area, a move toward these targets could follow, signaling a short-term bullish correction in the broader market structure.

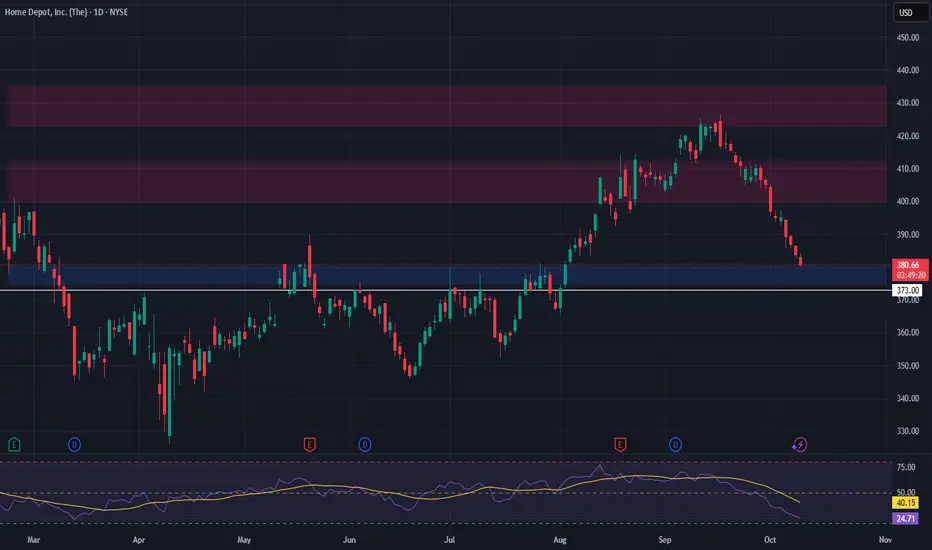
Home Depot (HD) – Long Setup at Key Support | Spot Trade IdeaHome Depot NYSE:HD has retraced into a crucial support zone between $375 – $380, offering a potential long entry opportunity. This level aligns with prior consolidation and buying interest, and while broader US indices hint at a possible correction, HD is holding this support relatively well.
🔹 Entry Zone: $375 – $380
🔹 Stop Loss: Below $373 (tight, risk-defined)
🔹 Take Profit Levels:
• TP1: $400 – $412
• TP2: $423 – $435
We’re approaching this trade with tight risk management, as market sentiment remains mixed. The setup favors a quick bounce or potential continuation if HD finds strength relative to the S&P 500. Watch volume and price action around the entry zone for confirmation.
Long Setup — FIG (130m)🎯 Strategy Overview
We’re positioning long from the retracement zone between $59.65 – $49.52, aligning with Fibonacci retracement levels and anchored VWAP support.
⚙️ Trade Plan
We’ll execute this setup in two steps to scale into strength.
🟩 Trade #1
Entry: $53.50
Stop: Below $49.52
Target: $58.44
Risk/Reward: 2.3 R
Rationale: Entry at the 0.382 Fib level after a bullish reaction around the VWAP and reclaim of short-term structure.
🟩 Trade #2 (Add-Up Position)
Entry: $56.21
Stop: Below $49.52
Target: $62.32
Risk/Reward: 2.1 R
Rationale: Add exposure once price clears the local resistance and confirms strength above the 80 MA, signaling momentum continuation.
📊 Technical Context
Retracement range: $59.65 → $49.52
Confluence: Fibonacci + VWAP + volume confirmation
RSI recovering from mid-40s and turning upward
Volume expansion near breakout attempt suggests accumulation

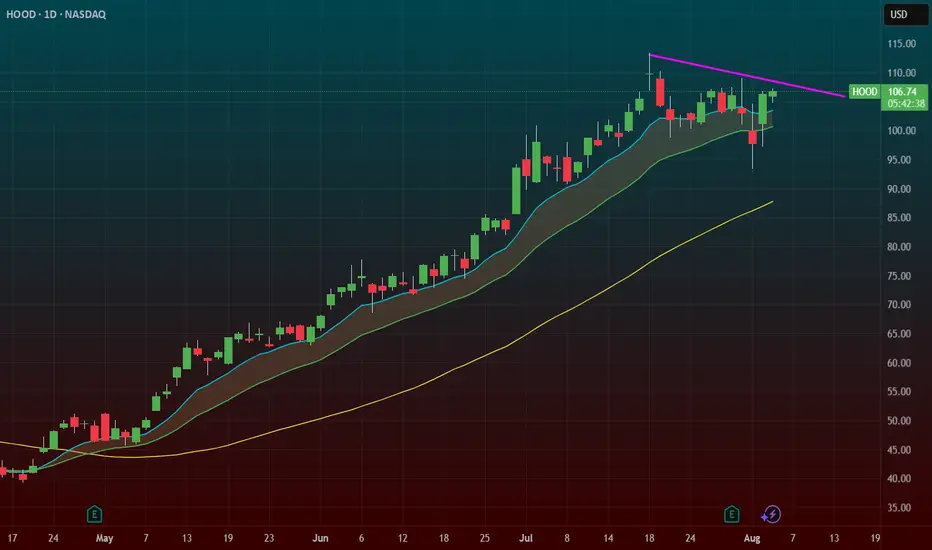
$HOOD – Flag Breakout Setup with Post-Earnings Shake & BakeNASDAQ:HOOD – Hot Momentum + Crypto Tailwind + Flag Breakout in Motion
Robinhood ( NASDAQ:HOOD ) is setting up for a momentum breakout after delivering a perfect post-earnings shake & bake — and now it’s reclaiming key levels with force.
🔹 The Setup:
After earnings, NASDAQ:HOOD flushed under $100, shaking out weak hands and triggering stop runs.
Since then, it's remounted the moving averages and is now pushing through the $107 breakout zone.
Price is flagging cleanly — compression before expansion.
🔹 Why It’s Got Juice:
Strong bounce post-earnings = real buyer interest.
Flag breakout forming with crypto sector strength ( CRYPTOCAP:BTC , CRYPTOCAP:ETH running).
NASDAQ:HOOD often rides crypto momentum — it’s a sleeper sector sympathy play.
🔹 My Trade Plan:
1️⃣ Position: Picked up $105 calls on the morning dip.
2️⃣ Add: Eyeing $110 calls with a few weeks out if we clear the flag.
3️⃣ Stop: Under today’s low or 9 EMA, depending on how it behaves into the breakout.
Why I Like It:
Shakeout + reclaim = powerful combo.
Flag structure is clean, volume is stabilizing, and crypto sector tailwinds add fuel.
When NASDAQ:HOOD runs, it runs fast — and it loves trending when sentiment flips.