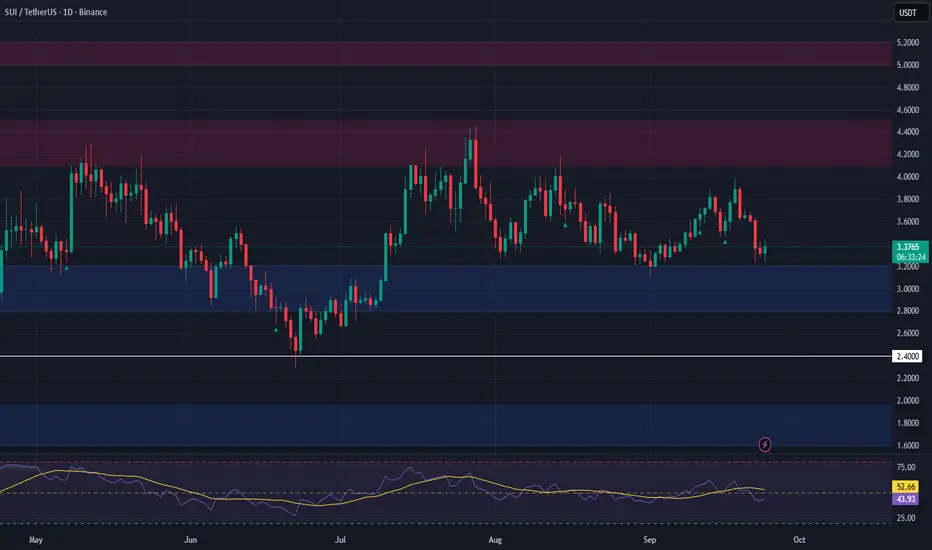
SUI Swing Trade Setup – Accumulation at Key SupportSUI has retraced to a major support zone, presenting a potential long swing setup. Price action is showing signs of a possible base, with another dip into early September likely before a reversal.
The strategy here is to ladder into long positions between $2.80–$3.20, aiming for a bounce toward previous resistance zones. Risk is managed with a tight invalidation below the last major support.
• Entry Zone: $2.80–$3.20
• Targets: $4.10–$4.50, $5.00–$5.20
• Stop Loss: Below $2.40
Swingtrade
HBARUSDT – Support Retest Could Spark a BounceHBAR is currently retesting a key support zone between $0.22 and $0.23, an area that has acted as a strong demand level over the past few sessions. Despite some recent pullbacks, the broader structure remains bullish, and price action suggests buyers are still defending this zone.
A successful hold here could lead to a short-term rally, with targets aligned to previous resistance levels. Risk is clearly defined, offering an attractive risk-to-reward setup for spot traders.
🔹 Trade Setup:
• Entry Zone: $0.22 – $0.23 (Support zone)
• Take Profit Targets:
🥇 $0.28 – $0.31
🥈 $0.36 – $0.40
• Stop Loss: Daily candle close below $0.21

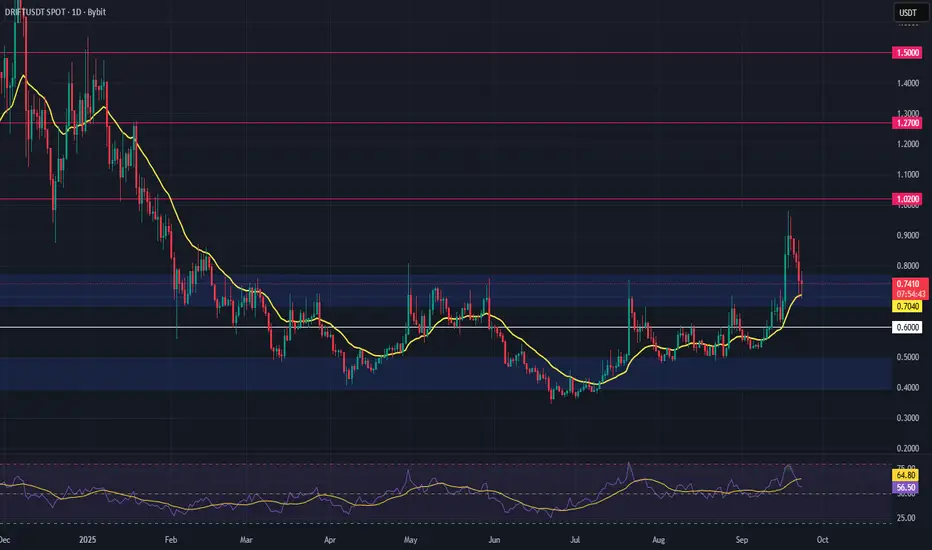
DRIFT Breakout Setup – Higher High + Retest in PlayDRIFT is showing strong bullish momentum after months of accumulation. The token has broken out, printed a higher high, and is now retesting the previous range high as support — a classic setup for continuation.
With price hovering near the 21-day EMA, this zone could act as a launchpad if sentiment holds. The structure supports a potential leg higher, making this a high-reward, low-risk opportunity for swing traders.
🔹 Trade Setup
Entry Zone: $0.68 – $0.72
Take Profit Targets:
🥇 $1.02
🥈 $1.27
🥉 $1.50
Stop Loss: Daily candle close below $0.60
📊 Keep an eye on volume confirmation and overall market sentiment. A clean bounce from this support zone could validate the setup.
📌 Like, comment, or share your thoughts below!
🔔 Follow for more crypto setups and technical insights.
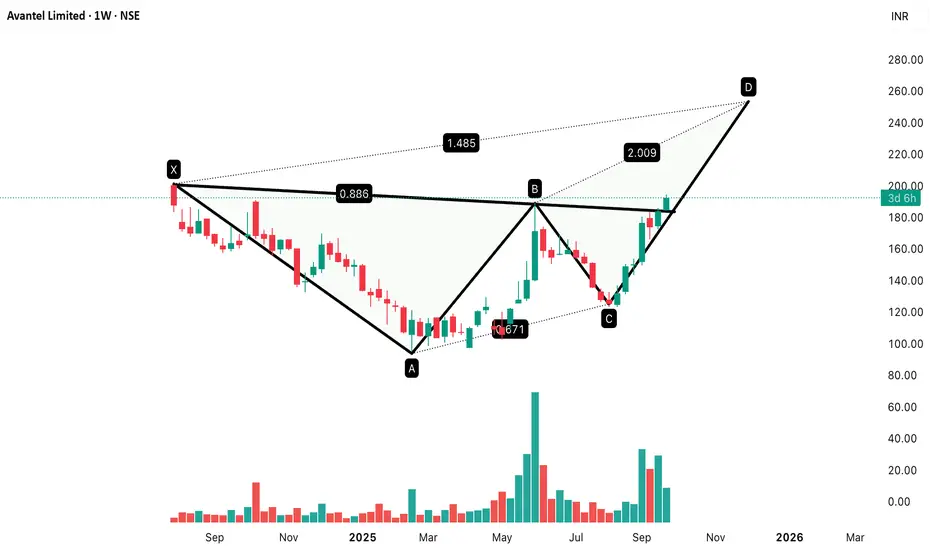
Bullish Harmonic (Potential Bullish Bat/Alt Bat)Pattern: Bullish Harmonic (Potential Bullish Bat/Alt Bat)
Currently moving from C → D leg.
Breakout above point B (~₹185) confirmed with good volumes.
D zone projection near ₹240–260.
✅ Buy Zone: ₹185–195
🎯 Target 1: ₹220
🎯 Target 2: ₹250
🛑 Stop Loss: ₹170 (below recent swing low)
Ashapura Minechem LtdPattern: Cup & Handle Breakout
Price has broken out above the resistance zone (~₹620–630).
Strong volume confirmation (blue arrow).
Momentum indicates possible continuation.
✅ Buy Zone: ₹635–650
🎯 Target 1: ₹690
🎯 Target 2: ₹720
🛑 Stop Loss: ₹600 (below breakout zone)

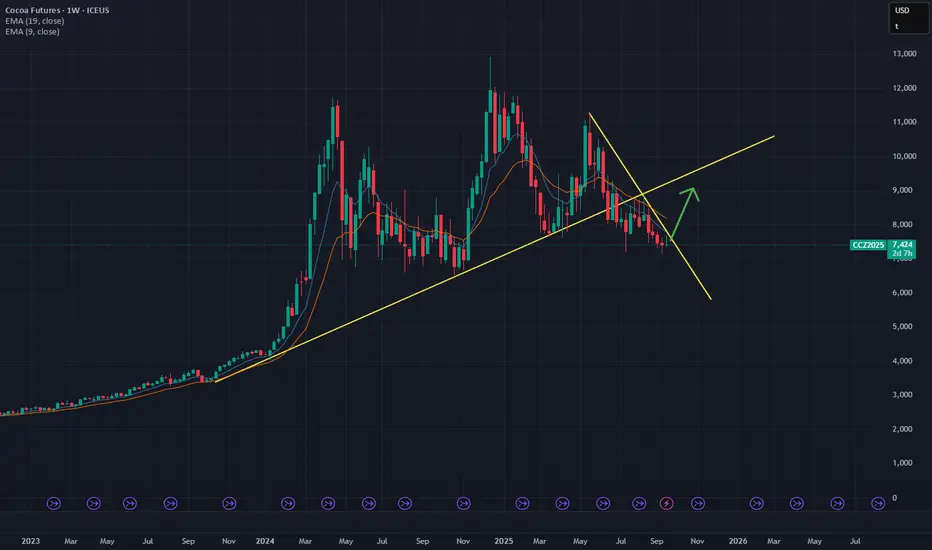
Cocoa Futures (ICE) – Long Trade Setup🍫 Cocoa Futures (ICE) – Long Trade Setup
Direction: Long Bias
Contract: Cocoa (NY / ICE)
Current Price: ~7,437
🔍 Technical Setup
Price has been consolidating after the sharp run-up and has now pulled back into a key long-term trendline (yellow support).
A downtrend channel breakout is forming – if price clears this, it opens the door to a relief rally.
I’m looking for price to push back toward the 8,500–9,000 zone as a first target (previous structure resistance).
EMA cross (9 vs 19) is flattening, signaling potential shift in momentum.
📊 COT & Sentiment
Speculators remain net long in cocoa, reflecting continued bullish sentiment.
Commercials (hedgers) are still short, but that’s typical for producers – nothing extreme.
Fundamentals remain tight:
Black pod disease in Cameroon hitting yields.
Stockpiles in London/NY at multi-year lows.
Consumer demand holding up despite high prices.
This alignment supports a bullish recovery if technicals confirm.
🎯 Trade Plan
Entry: Current levels around 7,400–7,500, scaling in on confirmation.
Target 1: 8,500 (previous resistance zone).
Target 2: 9,000+ if momentum extends.
Stop Loss: Below 7,000 to protect against breakdown.
Risk/Reward: ~1:2 setup.
⚠️ Risks
Stronger-than-expected supply recovery in Ivory Coast/Ghana.
Weak grind demand data (sign of demand destruction).
Speculators cutting long positions aggressively.
✅ Conclusion
Cocoa has pulled back into long-term support, with positioning and fundamentals still supportive of higher prices. If the descending trendline breaks, I’m positioning for a long swing toward 8,500–9,000.
This cocoa strategy has a profitability rate of 66% and average 9.4% gain on a long position.
FIL | Swing Trade Setup from Key Support ZoneFilecoin (FIL) is hovering near a major support zone between $2.47 and $2.55, offering a high-probability swing trade opportunity. The recent pullback has brought price action into a known demand area, and while momentum has cooled off, the broader market structure remains bullish. If the level holds, FIL could rebound toward multiple resistance targets in the coming sessions.
🔹 Trade Setup
• Entry Zone: $2.47 – $2.55
• Take Profit Targets:
🥇 $2.67 – $2.80
🥈 $3.00
• Stop Loss: Daily candle close below $2.36
#FIL #Filecoin #CryptoTrading #SwingTrade #SupportAndResistance #Altcoins #TradingSetup #TechnicalAnalysis #CryptoIdeas

WLDUSDT – Approaching Key Support | Long Setup AheadWLD had a powerful rally last week, but recent price action has seen a healthy retracement. This pullback is bringing the price into a critical support zone between $1.25 and $1.35, which previously acted as a strong base for bullish momentum.
The overall structure remains bullish, and this zone presents a high-confluence area for a potential long spot entry. If buyers step in here, we could see a strong reaction and continuation toward higher targets.
🔹 Trade Setup
• Entry Zone: $1.25 – $1.35
• Take Profit Targets:
🥇 $1.80 – $2.00
🥈 $2.40 – $2.65
• Stop Loss: Daily close below $1.20
#WLD #Worldcoin #CryptoTrading #Altcoins #CryptoSetup #LongTrade #TechnicalAnalysis #SupportZone #CryptoRally #SpotTrade #CryptoChart #WLDUSDT #BreakoutSetup #SwingTrade #CryptoBullish

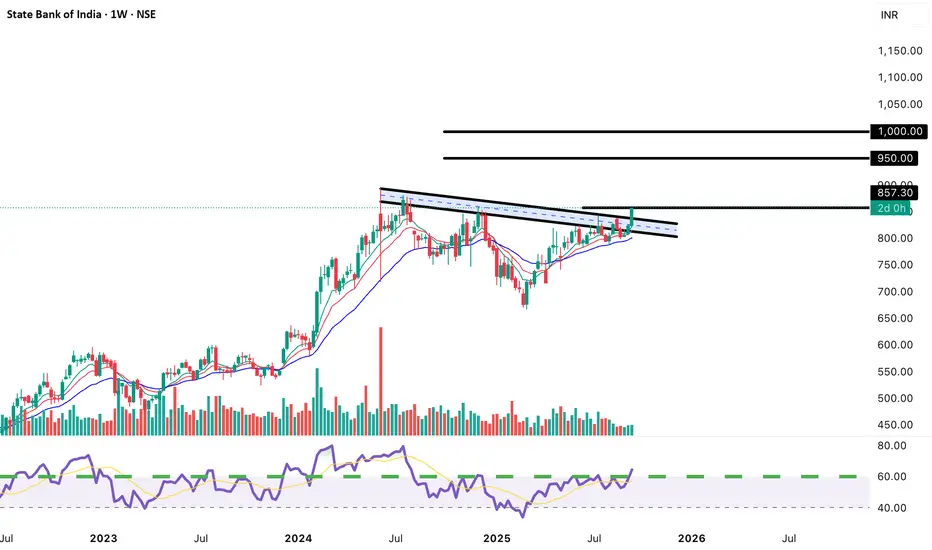
"SBIN Weekly Breakout: Target ₹950–₹1,000 with a Stop at ₹820"State Bank of India (SBIN) has broken above a multi-month resistance trendline on the weekly chart with strong bullish momentum and volume. The breakout is supported by a positive RSI and rising moving averages, confirming strength.
Buy Price: ₹857 (current close)
Target: ₹950–₹1,000
Stop-Loss: ₹820–₹830
Trade Plan: Buy on weekly close above resistance. Target the next psychological and technical resistance zone. Maintain tight stop-loss below breakout levels to manage risk.
Chart and technicals suggest a sustained move up if support holds!
GBPAUDI set and forget this trade for many reasons.
overall daily and weekly are bullish.
we made a retracement and now forming a double bottom.
while it might be a bit early, this trade has a potential of continuing the trend from the 4h supply and demand zone plus W shape

SUI | Watching for Key Resistance Flip — Long Setup BuildingDescription:
Sui (SUI) is shaping up for a potential bullish continuation, with price action currently hovering just below a critical resistance zone. A confirmed break and retest of this level could open the door for a strong upside move.
📍 Trade Setup:
Entry Zone: $3.40 – $3.60
Stop Loss: Just below $3.30
Take Profit Targets:
TP1: $4.00 – $4.20
TP2: $5.00 – $5.20
This setup is built around a support-to-resistance flip. If bulls can reclaim the overhead resistance and turn it into a base, it could confirm bullish momentum continuation.
#SUI #Crypto #Altcoins #SwingTrade #TechnicalAnalysis #TradingSetup

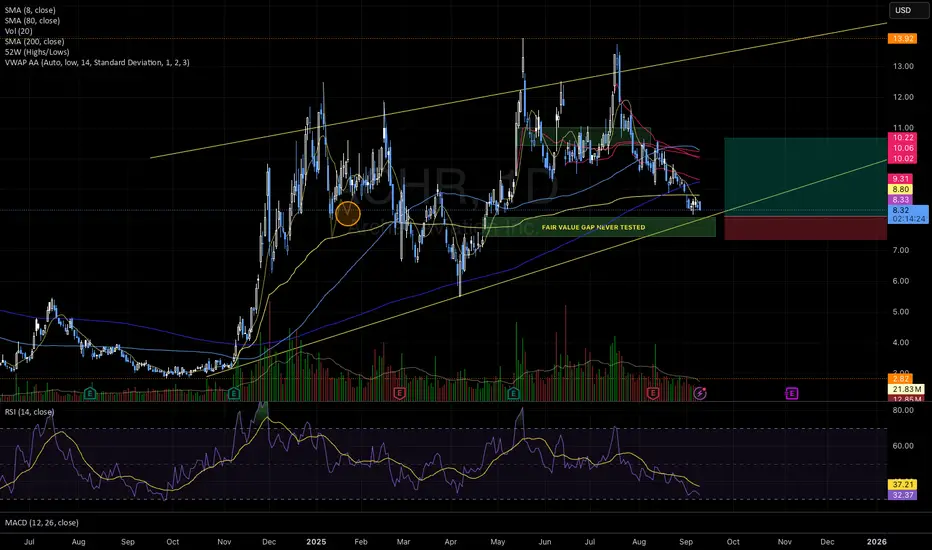
Bullish Setup Forming: Approaching Untested FVG + Oversold RSIACHR is setting up for a potential bounce based on multiple confluences:
Price is heading straight into a fair value gap that was never tested — could be a solid bounce spot;
Daily RSI is oversold (~32), often a sign the move down is stretched;
It’s also right on top of a rising trendline that has held for almost a year;
Volume is drying up, which might mean sellers are losing steam;
🎯 First target: $10.91
🏁 Final target: $12.00
❌ Stop-loss: just under the FVG zone, in case it breaks down.
Watching closely 👀
And remember: respect both your stop loss and position sizing.
EUR/USD Poll: 1.2000 here we come?EUR/USD: 1.2000 Bank Target?
I am usually not a trend-trader (I prefer Mean Reversion), but this looks like a bullish setup to me: Breakout attempt + inverse head and shoulder.
Almost all banks have 1.2000 as a year-end-target for the Euro.
Fundamental reasons:
1. USD weakness due to weakening Jobs-Date
2. Increasing odds of a FED rate cutting cycle
3. USD-Outflows due to lost confidence in US-government
4. EUR Inflows due to fiscal measures in Germany
What do you guys think? 1.2000 just a matter of time?
Let me know in the comments!

Link has a good entry today.enter if Link price is within ±2% of 22.40.
take profit at 27.70.
this is a swing trade, not a quick one. patience pays off.
nb: if price goes against you, hold or move it to a Smart Rebalance Bot until the market turns.
don't allocate more than 5% of your portfolio per trade.

Buy Jones Lang LaSalleShort Term Trading Advice by Naranj Capital
Buy Jones Lang LaSalle
● Buy Range- 297 - 300
● Target- 312 - 316
● StopLoss- Below 285
● Potential Return- 4-5%
● Duration- 14-15 Trading Days

Wall Street Weekly Outlook - Week 37 2025Wall Street Weekly Outlook - Week 37 2025
Starting this week, I will release a weekly outlook video for the TradingView community. Get ready for the new week from an institutional perspective!
***
This week, markets are once again dominated by 🏦 central banks, 📊 inflation data, and the ongoing debate about whether the global economy is heading for a soft 🪂 or hard 🛬 landing.
We’ll look at the major themes 🔎 banks and institutions are focusing on, analyze key charts 🖥️, and highlight what could move markets 🔥 in the coming days.
🥇 Gold and 🥈 Silver remain in the spotlight as investors hedge against uncertainty, while 📉 equities are testing important resistance levels. In 💵 currencies, the USD is positioning itself ahead of crucial macroeconomic data.
👉 Join me as we break down what really matters on Wall Street this week — and how it could impact the markets.
Best,
Meikel

BTC Breakdown Alert: Bears Eye $106K Next!
🔥 **BTC Bears Ready to Attack? 🚨 Target \$106K Incoming!** 🔥
📊 **Market Bias**
⏳ **Intraday → 4H**: 🟥 Bearish (⬇️ below EMA9/21/20SMA, 📉 MACD negative, 💥 sell volume)
📅 **Daily → Weekly**: ✅ Mixed-to-Bullish (📈 above 200 SMA ≈ 101.3k)
⚖️ → Tactical short only, ⚠️ size carefully.
🎯 **Trade Plan**
💰 Entry: **109,200**
🛑 Stop Loss: **110,800**
🎯 Take Profit: **102,400** (⚡ 50% at 105,900 / 50% at 102,400)
📏 Size: **1 BTC** (risk \~1%)
💪 Confidence: **60%**
⏰ Timing: **Market Open**
🧠 **Why Short?**
* 📉 EMAs/SMA bearish stack
* 🔻 Expanding negative MACD
* 🧊 Heavier sell volume
* 🎯 BB extension aligns w/ \~102.4k
⚠️ **Risks**
* ❓ Missing OI/liquidity data = squeeze risk
* 📈 Long-term bullish structure > 200 SMA
* 🌍 Macro shocks (ETF/reg headlines, DXY swings)
---
📊 **TRADE JSON (automation/record):**
```json
{
"instrument": "BTC",
"direction": "short",
"entry_price": 109200.00,
"stop_loss": 110800.00,
"take_profit": 106000.00,
"size": 1.0,
"confidence": 0.60,
"entry_timing": "market_open",
"signal_publish_time": "2025-09-01 17:02:46"
}
```
---
🏷️ **Hashtags:**
\#BTC 🚀 #Bitcoin 💎 #CryptoTrading 📊 #TradeSetup 🐻 #ShortTrade ⚡ #DayTrading ⏳ #RiskManagement 🛡️ #SwingTrade 🎯

BONK Approaching Key Support – Potential Long Swing Setup
BONK is pulling back and approaching a major support zone, where buyers previously stepped in. With price action slowing down, this could present a low-risk, high-reward swing trade opportunity.
Trade Setup:
🔹 Entry Zone: $0.0000183 – $0.000016
🔹 Take Profit Targets:
🥇 $0.0000226
🥈 $0.000026
🔹 Stop Loss: Close below $0.0000155
#BONK #CryptoTrading #SwingTrade #Altcoins #TechnicalAnalysis

AMD Pullback Opportunity After 70%+ Rally – Watching $111–$120 📈 AMD Update – Strategic Re-Entry Plan
From our original buys at $108, AMD has delivered an impressive 70%+ rally. This strong momentum reflects continued bullish sentiment and growth potential in the semiconductor sector.
We’re now looking to add on a pullback into a confluence support zone between $111 and $120. This level aligns with the:
61.8% Fibonacci retracement
99-day TRAMA
Horizontal support at $120
📍 Entry Zone: $111–$120
🎯 Take Profit Targets: $160 / $220 / $300
❌ Stop Loss: Weekly close below $100
#AMD #NASDAQ #SwingTrade #Fibonacci #TechnicalAnalysis #StockMarket #TradingIdeas

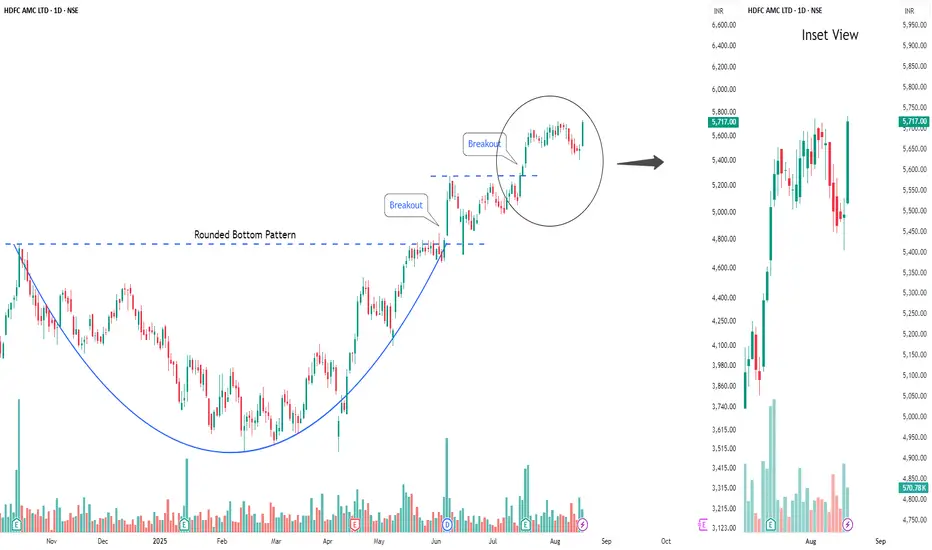
Buy HDFC AMCShort Term Trading Advice by Goodluck Capital
Buy HDFC AMC
● Buy Range- 5600 - 5700
● Target- 5900 - 6000
● StopLoss- below 5380
● Upside Potential- 4% -5%
● Approx trade duration 14 - 15 days
possible swing point on GBPJPY Alright, let’s dive into the exciting world of trading, shall we?
So, here's the scoop: we’re on the lookout for potential swing points, those sweet spots where the market might just take a turn. It's like waiting for the perfect wave while surfing—the key is to recognize the signs before riding it out. Typically, one of the best indicators we have is a classic momentum drop. Picture it: as the price rises, there’s a little dip in momentum that signals a shift is on the horizon.
Now, once we spot that drop, we keep our eyes peeled for a lovely shift in price action. That’s our cue! When we see everything aligning just right, we can jump in with a smooth swing entry on this pair. It’s all about catching that rhythm and flowing with the market's natural ebb and flow.
So, dust off those charts and let your creative side take control! Map out your strategies, draw your lines, and visualize your plan of action. Trading is as much an art as it is a science, and every eye you lay on the charts brings you closer to mastering it.
Remember, though, as tempting as it is to get swept away by the possibilities, nothing in trading is guaranteed. Embrace the journey; it's all part of the fun and learning. Let’s see how this plays out together! Happy trading!

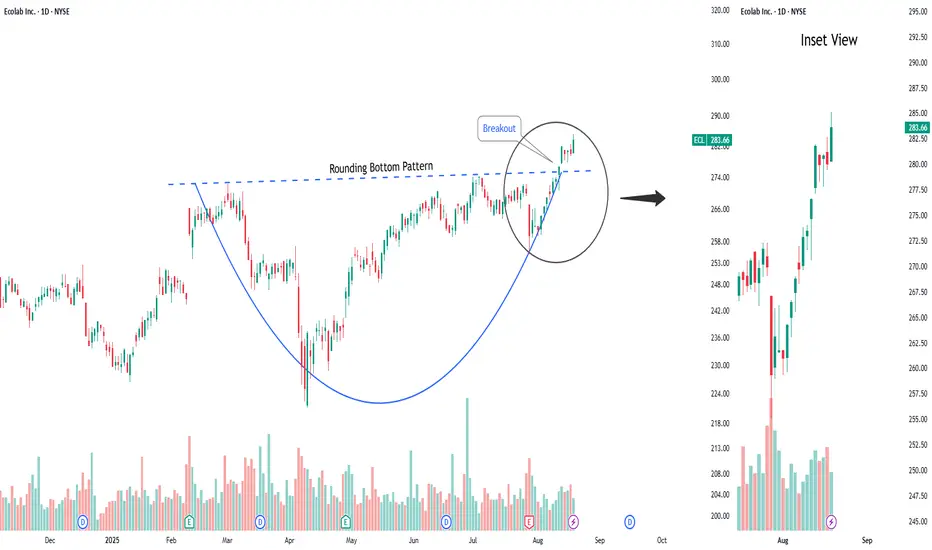
Buy EcolabShort Term Trading Advice by Naranj Capital
Buy Ecolab
● Buy Range- 282 - 285
● Target- 295 - 300
● StopLoss- Below 276
● Potential Return- 4-5%
● Duration- 12-14 Trading Days
Strong daily supply level in control on EURUSDThere is a strong daily supply level in control on EURUSD the 19th of August 2025. Will the EURUSD drop much further. Hopefully it will.
