GBPJPY: Last 600+ Bullish Push Before Major Swing Sell! HAPPY NEW YEAR 2026🎇
GBPJPY Overview📊
🔺The most significant buying move we anticipate will shape the market. The current price is extremely bullish and is likely to continue building new highs; the buying zone we presented has substantial volume.
🔺The British Pound is likely to remain bullish as it has been since the last few months while the Japanese Yen is likely to continue to depreciate.
Entry, Stop Loss and Take Profit📈👨💻
🔺Enter around the blue-marked zone, set a stop-loss below the buying zone and take profit at 218.
🔺Please like, comment and share which will support us to post such more analysis!
Team SetupsFX_
Swingtrader

Micron Technology - The bullrun will end today!🏒Micron Technology ( NASDAQ:MU ) is now starting a correction:
🔎Analysis summary:
Over the course of the past couple of months, Micron Technology rallied an expected +350%. However, with the current retest of major resistance, it is quite likely that this bullrun will end soon. Just wait for sufficient bearish confirmation after this long rally.
📝Levels to watch:
$350
SwingTraderPhil
SwingTrading.Simplified. | Investing.Simplified. | #LONGTERMVISION

Gold (GC1!) Forecast: The Squeeze & Release Path via DSRTL MatriCategory: Trend Analysis / Chart Patterns
Symbol: GC1! (Gold Futures)
In this analysis, we use the DSRTL-ML (Dynamic Support & Resistance) engine to map the current structural context for Gold. The indicator is tagging the state as “TESTING RES – Bias: Neutral”, highlighting a consolidation phase right underneath a major resistance band. Structurally, this is a spot where static friction meets dynamic momentum.
1. The Current Structure: Compression Phase
The Matrix currently sits at S2 | D3 (Testing Resistance).
- The Ceiling (Static R): Price is capped by a high-volume resistance node (orange zone: ~4.24K–4.31K), acting as a lid on price action.
- The Floor (Dynamic S): At the same time, the rising DSRTL trend line (dynamic support) is pushing the lows higher inside the channel.
Taken together, this can be viewed as an early ascending-triangle–style squeeze: price is consolidating between a flat static lid and a rising dynamic floor, while DSRTL keeps the official bias neutral and labels the state as a resistance test.
2. Path of Least Resistance
The dashboard shows a positive Net Delta of +8.36K, suggesting that buyers have been active right below the resistance band.
- Projected Path: In the absence of a clear break, price can continue to oscillate within this narrowing pocket between static resistance and the rising channel.
- Breakout Vector: The combination of constructive volume flow and an upward-sloping dynamic channel creates a supportive backdrop if an upside break occurs, even though DSRTL itself still prints a Neutral bias here.
3. Scenario & Structural Objectives
- Trigger: A confirmed close above the top of the Static R band (~4.31K) would move the Matrix out of its S2 “testing” state toward an S1-type breakout environment.
- Next Structural Area: Above that level, the next area of interest becomes the upper rail of the DSRTL dynamic channel (pink line), where the system could start migrating toward its higher “extension” states.
Invalidation:
If price breaks and closes below the rising pink dynamic support, the bullish squeeze thesis is invalidated. In that case, the Matrix would likely rotate toward Neutral/Bearish or Bearish-Pullback configurations, depending on how price interacts with the underlying static support band.
Disclaimer: This forecast is based on structural scenarios derived from the DSRTL-ML engine and is provided strictly for educational and illustrative purposes.

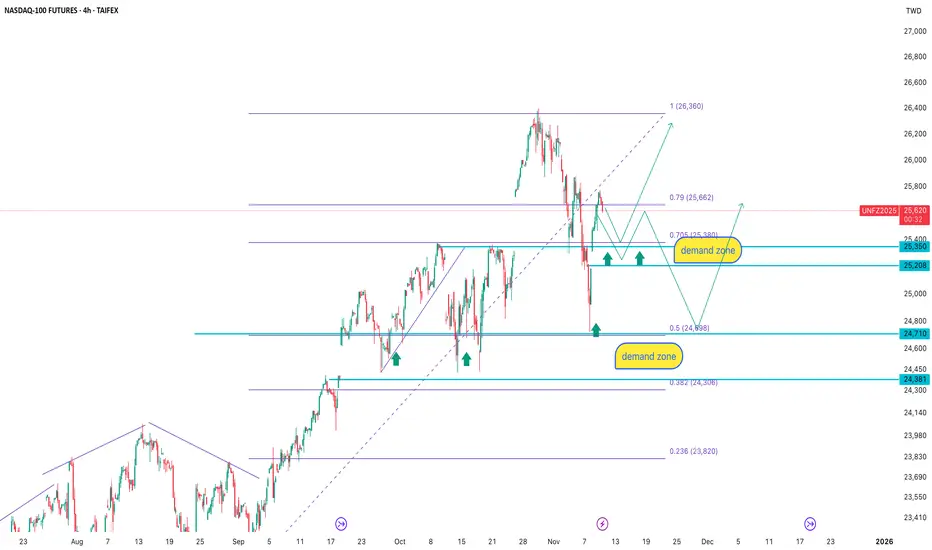
NASDAQ-100 4H: demand is not gone, only waiting for the priceAfter the recent upward impulse, the price retraced into the key demand zone at 25 350–25 208, an area that has repeatedly triggered buying reactions in the past. T
he latest correction pushed the price into the 0.79–0.705 Fibonacci range, which frequently acts as a retest zone before continuation.
Below that lies an even stronger demand zone at 24 710–24 381, aligning with the 0.5 Fibonacci level and previous volume accumulation.
The trading logic here is simple: don’t chase the move, let the price come to demand and wait for confirmation.
As long as the market structure holds, the primary scenario remains bullish from demand zones with a target toward 26 360 and potentially higher.
Fundamentally, NASDAQ remains supported by expectations of softer Fed policy, strong tech capital inflows, and continued investment in AI, cloud, and data-center infrastructure. Smart money accumulates on corrections, not on peaks.
When price falls into demand, it’s not fear — it’s opportunity.
AUDCHF: Important Breakout 🇦🇺🇨🇭
AUDCHF broke and closed above a significant daily resistance cluster.
The next historic resistance is 0.5287.
It will most likely be the next goal for the buyers.
❤️Please, support my work with like, thank you!❤️
I am part of Trade Nation's Influencer program and receive a monthly fee for using their TradingView charts in my analysis.

Breakout in CAMSBreakout in CAMS
Entry - 3967
Target - 4370
SL - 3870
DISCLAIMER: I am not SEBI registered and the ideas posted are only for educational purpose. Do a proper analysis and always trade with STOP LOSS.

NZDJPY: Important Breakout 🇳🇿🇯🇵
NZDJPY broke and closed above a significant horizontal
resistance cluster on a daily.
There is a high chance that the market will go higher soon.
Expect a bullish continuation to 88.3 level.
❤️Please, support my work with like, thank you!❤️
I am part of Trade Nation's Influencer program and receive a monthly fee for using their TradingView charts in my analysis.

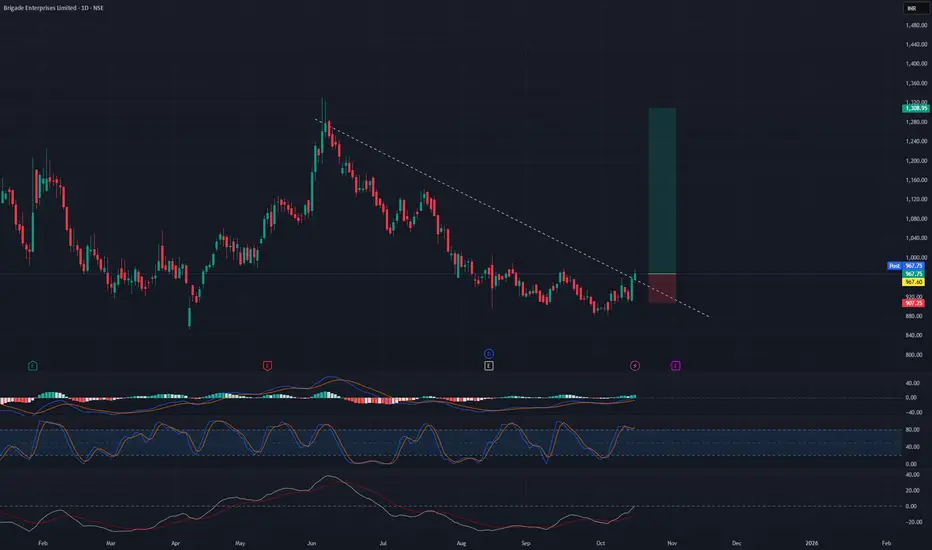
Breakout trading in BRIGADESwing trading opportunity in BRIGADE.
Entry - 970
Targets - 1130 & 1300
SL - 904
DISCLAIMER: I am not SEBI registered and the ideas posted are only for educational purpose. Do a proper analysis and always trade with STOP LOSS.
GBPUSD: Bullish Continuation Ahead?! 🇬🇧🇺🇸
GBPUSD violated a significant resistance cluster yesterday.
The market broke through that with a high momentum bullish candle.
Chances will be high that the pair will continue rising.
The next goal for the buyers is 1.35 psychological resistance.
❤️Please, support my work with like, thank you!❤️

#DOGEUSDT: Swing Trade Targeting $0.50| Swing Trade| Setupsfx_|Hey there! Everyone
DOGEUSDT is at a turning point right now, and it looks like it might just reverse course and head towards its target price of $0.50. This is a swing trade, which means it could take a few weeks, or even months, to complete.
We’d really appreciate your support.
Thanks
Team Setupsfx_

AUDJPY 4hour TF - June 29th, 2025AUDJPY 4hour Neutral Idea
Monthly - Bullish
Weekly - Bearish
Dailly - Bearish
4hour - Ranging
AJ is currently sitting at a major daily resistance area around 94.500. We have to wait for price action to make a move and show some conviction before we can become confident in a setup.
Lucky us, price action is usually easy to follow when waiting for a break of a range. The way I see it, we have two great options.
Bullish Breakout - In the scenario where we see price action break above the 94.500 zone we will look for long setups. Ideally, we spot some clear higher lows above 94.500 with strong bullish conviction. Look to target higher resistance levels like 96.500.
Bearish Continuation - If we see this resistance level at 94.500 continue to hold we could see a daily bearish continuation happen. Look for strong bearish candles rejecting the current zone followed by clear lower highs. We’re targeting lower if that happens to around the 92.000 area.

GOLD[XAUUSD]: Breakthrough the bearish pressure, What next?Evening Everyone,
Hope you are doing great, price recently breakthrough the current price inducement, showing a strong bullish volume emerging in the market. Long term approach remain bullish ultimately taking the price towards the new high.
Good luck
Team Setupsfx_

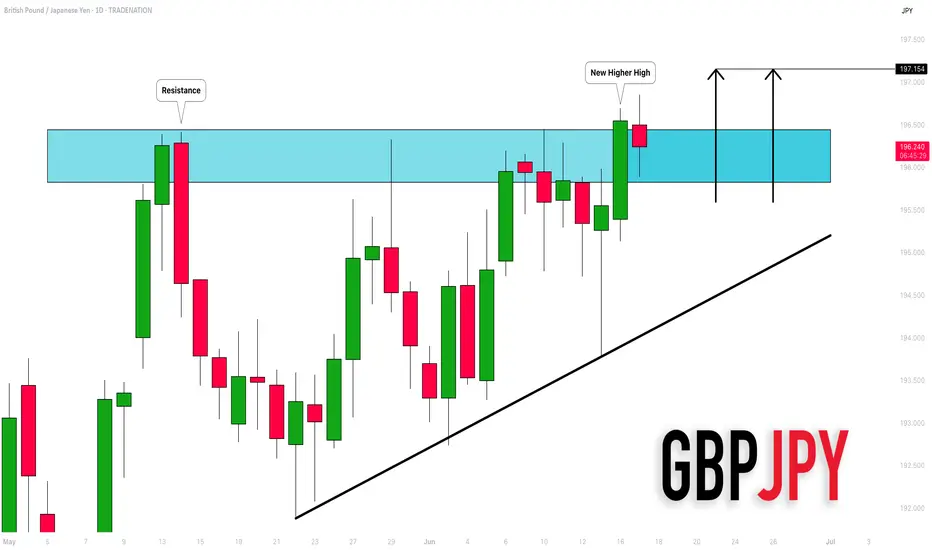
GBPJPY: Important New High 🇬🇧🇯🇵
GBPJPY set a new higher high higher close on a daily,
violating a key horizontal resistance cluster.
I think that it opens a potential for more growth.
Next strong resistance is 195.15
❤️Please, support my work with like, thank you!❤️
I am part of Trade Nation's Influencer program and receive a monthly fee for using their TradingView charts in my analysis.
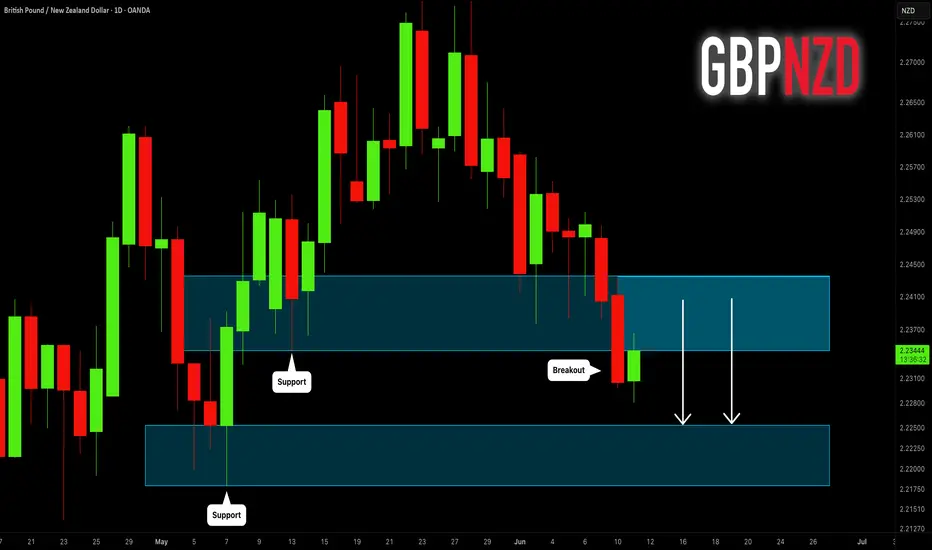
GBPNZD: Important Breakout 🇬🇧🇳🇿
GBPNZD broke and closed below a key daily support cluster.
The broken structure turned into a strong resistance.
I will expect a bearish movement from that at least to 2.2255 support.
❤️Please, support my work with like, thank you!❤️
EURJPY: Important Breakout 🇪🇺🇯🇵
EURJPY broke a significant resistance cluster on a daily.
We see its retest now.
I think that the price will start rising from that and reach
at least 164.5 level.
❤️Please, support my work with like, thank you!❤️
I am part of Trade Nation's Influencer program and receive a monthly fee for using their TradingView charts in my analysis.

XAUUSD Swing TradeXAUUSD Swing Trade
Market Overview:
Gold remains in an overall uptrend, currently facing resistance around 3350.
At present, price is pulling back with key support levels at:
3333, aligning with a Fair Value Gap
3310, the midpoint of the base structure
3295, a major Order Block zone
Strategy:
Look for buy opportunities on pullbacks at key support levels.
Wait for reversal candlesticks or clear reversal patterns before entering positions.
Take-Profit Targets:
Initial targets: 3380 and 3400, which align with the Volatile Day High range
Extended target for the week: 3450, the Volatile Week High

EURCAD: Another Bearish Pattern 🇪🇺🇨🇦
Earlier, we spotted a head & shoulder pattern on EURCAD on a daily
and a confirmed breakout of its neckline.
Analysing a price action, I spotted another bearish formation today.
The price formed a bearish flag pattern, and it is retesting a broken
trend line at the moment.
I think that the pair may drop lower soon.
Next support - 1.5503
❤️Please, support my work with like, thank you!❤️
I am part of Trade Nation's Influencer program and receive a monthly fee for using their TradingView charts in my analysis.

GBPJPY: Important Breakout 🇬🇧🇯🇵
GBPJPY successfully violated and closed above a major
daily resistance cluster.
It opens a potential for more growth now.
Next resistance - 197.3
❤️Please, support my work with like, thank you!❤️
I am part of Trade Nation's Influencer program and receive a monthly fee for using their TradingView charts in my analysis.

A Short USDJPY Buy🌞 Good Morning, Traders! 🌞
It’s a beautiful, great morning — let’s get ready to learn and earn! 💪📊
Here’s something I want you to understand today:
📈 Price always moves from one zone to another.
When it reaches a zone, it often pauses (rests) before continuing its movement — depending on whether buyers or sellers are in control at that moment.
🧠 Here’s a key insight:
Most times, buyers are positioned around the middle of the 4H candle.
That’s exactly why we're taking this BUY trade — the price is resting and showing signs of buyer strength from that level.
So keep your eyes sharp and your mind focused. 👀
Understanding why we take trades is what separates smart traders from lucky ones.
Let’s stay patient, stay consistent, and grow together. 🚀

Is There the Best Moving Average For Swing Trading?Is There the Best Moving Average For Swing Trading?
In swing trading, moving averages are widely used to analyse market trends and identify potential turning points. In this article, we’ll dive into the most commonly used MAs, their unique characteristics, and how they can be applied in swing trading strategies.
What Are Moving Averages?
You definitely know what moving averages are. However, we need to start our article with a brief introduction to this market analysis tool.
A moving average (MA) is a fundamental tool in technical analysis that helps traders understand the direction of a market trend by smoothing out price fluctuations, often touted among the best indicators for swing trading. Instead of focusing on the volatile ups and downs, MAs calculate an average of prices over a specific period, such as 20, 50, or 200 periods. This gives traders a clearer picture of the overall trend by filtering out short-term volatility.
There are different types of moving averages, but they all work on the same principle: tracking the average price over time to highlight the market's trajectory. For example, a 20-period MA shows the average (usually closing price but a trader can choose highs, lows, and opens) over the past 20 periods, updating as new prices come in. This rolling calculation creates a line on the chart, making it easy to identify whether the market is trending upwards, downwards, or moving sideways.
Types of Moving Averages
Moving averages come in various forms, each with unique characteristics that cater to different trading styles and strategies.
Simple Moving Average (SMA)
The simple moving average (SMA) is the most straightforward type, calculated by averaging the closing prices (but a trader can choose any price type) over a set number of periods. For example, a 20-period SMA adds up the last 20 closing prices and divides by 20. It’s popular among traders who want a broader view of price trends without overreacting to short-term fluctuations, making it a contender for one of the best moving averages for swing trading. However, SMAs can lag behind price action, as they give equal weight to all prices in the calculation.
Hull Moving Average (HMA)
The hull moving average (HMA) is designed to reduce lag while maintaining a smooth line. By combining weighted averages with additional smoothing techniques, the HMA offers a balance of speed and clarity, making it an underrated moving average for swing trading.
Exponential Moving Average (EMA)
The exponential moving average (EMA) prioritises recent prices, giving them more weight in the calculation. This makes it more responsive to price changes compared to the SMA. Swing traders often use EMAs in faster-moving markets, where quick adjustments to trend shifts are crucial, with 8- and 21-period EMAs considered by some traders as two of the best EMAs for swing trading. For instance, a 20-period EMA reacts faster to sudden price movements than a 20-period SMA, helping traders spot potential reversals sooner.
Weighted Moving Average (WMA)
Similar to the EMA, the weighted moving average (WMA) also gives more importance to recent prices but does so with a linear weighting system. This means the most recent price has the greatest impact, gradually decreasing with older data. WMAs are less common but useful when traders want a more precise reflection of recent price action.
How to Use Moving Averages in Swing Analysis and Trading
Moving averages are versatile tools that can provide valuable insights for swing traders. Beyond highlighting trends, they can help identify potential turning points and dynamic support or resistance levels. Here’s how they’re commonly used in swing trading:
1. Identifying Trends
MAs are widely used to assess the direction of a trend. For instance, if the price consistently stays above a rising moving average, it suggests an upward trend. Conversely, when prices remain below a declining moving average, the market could be trending downward. Swing traders often rely on shorter moving averages, like the 20-period, for identifying trends that align with their trading horizon.
2. Spotting Reversals with Crossovers
Crossovers happen when two MAs intersect. A common example is a shorter MA crossing above a longer one, which may indicate a shift towards bullish momentum and vice versa.
3. Dynamic Support and Resistance
MAs act as floating support and resistance levels. MAs serve as a support level in an uptrend, with the price bouncing off it repeatedly. In a downtrend, the same moving average might act as resistance, limiting upward moves.
4. Filtering Market Noise
In choppy markets, MAs can smooth out minor fluctuations, making it easier to focus on the bigger picture. Swing traders often use longer MAs, such as the 50-day or 200-day, to filter out irrelevant short-term movements.
5. Timing Entry and Exit Zones
Many traders use crossovers to time their entries and exits, though it’s worth noting their lagging nature means they can result in untimely trades. They can also provide context. For example, if the price approaches a key moving average after a strong move, it might indicate a consolidation phase or a potential reversal, allowing traders to adapt their analysis.
Common Moving Averages for Swing Trading: The 20, 50, and 200 MAs
Swing traders often turn to the 20-, 50-, and 200-period moving averages as their go-to tools for analysing market trends. Each serves a specific purpose, helping traders gauge short-, medium-, and long-term price movements. These moving averages are often used together.
20-Period Moving Average
The 20-period MA is a favourite for short-term trend analysis. It reacts quickly to price changes; therefore, traders use it to identify recent momentum or potential trend shifts. Traders frequently watch for price “bounces” off the 20-period MA as potential indications of continuation in the current trend.
50-Period Moving Average
The 50-period MA provides a medium-term perspective, offering a smoother look at price trends. It’s slower to react than the 20-period MA but avoids being overly lagging. This balance makes it useful for identifying sustained trends while filtering out minor price noise. When prices interact with the 50-period MA, it often acts as a dynamic support or resistance level.
200-Period Moving Average
The 200-period MA is the benchmark for long-term trend analysis. It’s often used to determine the overall market direction. This MA is also a widely followed indicator for institutional traders, adding weight to its significance. Interactions with the 200-period MA often mark key turning points or areas of consolidation.
Traders also monitor crossovers between the 50- and 200-period MAs, recognised by some as the best moving average crossover for swing trading. For instance:
- Golden Cross: When the 50-period MA crosses above the 200-period MA, it suggests potential bullish momentum.
- Death Cross: When the 50-period MA drops below the 200-period MA, it signals a possible bearish shift.
Using Them Together
Using the 20-, 50-, and 200-period MAs together offers a comprehensive approach to identifying the best moving average crossover setups, allowing traders to see the bigger picture while still tracking short-term shifts. For instance, when the price breaks above the 200-period MA while the 20-period MA crosses above the 50-period MA, it may signal the beginning of a broader bullish trend. Meanwhile, a price drop below all three MAs could suggest broader bearish momentum.
Other Moving Average Combinations for Swing Trading
While the 20, 50, and 200-period MAs are staples in swing trading, exploring other combinations can offer nuanced insights tailored to specific trading strategies. Some alternative moving average setups that traders often employ include:
8-Period and 21-Period Exponential Moving Averages (EMAs)
This pairing is favoured by traders seeking to capture short-term price movements with greater sensitivity. They call this the best EMA crossover strategy. The 8-period EMA responds swiftly to recent price changes, while the 21-period EMA provides a slightly broader perspective.
10-Period and 50-Period Simple Moving Averages (SMAs)
Combining the 10- and 50-period SMAs offers a balance between short-term agility and medium-term trend identification. This combination helps traders filter out minor price fluctuations and focus on more sustained movements.
28-Period and 50-Period HMAs
For traders focused on short-to-medium-term trends, the 28- and 50-period HMAs offer a balanced approach. The 28-period HMA reacts quickly to price changes, while the 50-period HMA provides a steadier view of the broader trend. Crossovers between the two can signal potential bullish or bearish momentum shifts, benefiting from the HMA’s reduced lag.
13-Period and 34-Period WMAs
Rooted in Fibonacci sequences, the 13- and 34-period WMAs are employed by traders who believe in the natural rhythm of the markets. A 55-period WMA can also be included for a longer-term perspective. Crossovers between these WMAs can highlight potential trend reversals or continuations, with the WMA adapting more quickly than other MAs due to its weighted calculation.
Implementing These Combinations
When applying these moving average combinations, it's crucial to consider the following:
- Market Conditions: These combinations often perform better in trending markets versus ranging markets. Moreover, shorter MAs might be more effective in capturing quick price movements during high volatility.
- Timeframes: Traders align MAs with their trading horizon. Shorter periods like the 5-period or 8-period MAs are usually used by traders focusing on brief swings, while longer periods like the 50-period MA cater to those looking at extended trends.
- Confirmation with Other Indicators: Relying solely on moving averages can lead to false signals. Traders corroborate these signals with other technical indicators, such as Bollinger Bands or the Relative Strength Index (RSI).
What Moving Averages Should You Use for Swing Trading?
There is no best moving average for swing trading. The choice of MAs ultimately depends on a trader's strategy and preferences. The combinations discussed provide a framework, but experimenting with different setups can help identify what aligns with individual trading styles and objectives.
The Bottom Line
Moving averages are powerful tools for swing trading, offering insights into trends and potential market turning points. Whatever your unique preference for different types and lengths, understanding their application can refine your strategy.
FAQ
Which Moving Average Is Good for Swing Trading?
The 20-period, 50-period, and 200-period moving averages are widely used in swing trading. However, different combinations, like the 8- and 21-period or 13- and 34-period MAs can offer equally valuable insights; it ultimately comes down to the trader’s preference.
What Is the Most Popular Moving Average to Use?
The most popular moving average depends on a trader’s trading style and goals. Shorter MAs, like the 20-day MA, are popular for quick trend identification, while longer ones, such as the 200-day MA, provide a bigger picture. Many traders combine MAs to cover different timeframes.
Is 200 EMA Good for Swing Trading?
The 200-period EMA is useful for swing traders seeking to understand long-term trends. It reacts faster than the 200-period SMA, making it suitable for traders looking to incorporate a responsive indicator in their analysis.
Which Indicator Is Most Popular for Swing Trading?
There isn’t a single best indicator for swing trading. Moving averages, RSI, MACD, and volume indicators are commonly used. Combining these can provide a more comprehensive analysis.
Which Volume Indicator Is Popular for Swing Trading?
The On-Balance Volume (OBV) and Volume Weighted Average Price (VWAP) are popular volume indicators for swing traders, helping assess market momentum.
Which RSI Indicator Is Popular for Swing Trading?
The standard 14-period RSI is widely used. Swing traders often adjust it to shorter periods (e.g., 7) for faster signals or longer periods (e.g., 21) for smoother trends.
This article represents the opinion of the Companies operating under the FXOpen brand only. It is not to be construed as an offer, solicitation, or recommendation with respect to products and services provided by the Companies operating under the FXOpen brand, nor is it to be considered financial advice.

CADCHF: Still Bullish 🇨🇦🇨🇭
Last week, I shared a very bullish outlook for CADCHF
based on a breakout and a retest of a key daily structure.
I keep holding a long trade on the pair and still expect growth.
Goal - 0.602
❤️Please, support my work with like, thank you!❤️
I am part of Trade Nation's Influencer program and receive a monthly fee for using their TradingView charts in my analysis.

USDJPY Buy UpdateUSDJPY Buyers stepping in fully...
Analyzing the information from what the yearly candle printed a strong buy is building up at these level

U.S. Stock Swing TradeBRK.B
This stock remains one of the few in the U.S. market that continues to exhibit technical strength, maintaining a well-defined uptrend.
Current price action suggests a potential buy-on-dip opportunity near key support levels.
Entry Zone: 494 – 501
Take-Profit Target: 518 – 530
Stop Loss: 488
That said, it remains essential to closely monitor the S&P 500 index, along with prevailing macroeconomic developments, which continue to exert significant influence on market sentiment.
