2026 - A prosperous year is coming!🙏2026 will be a very prosperous year:
-> Focus on financial health
-> Focus on physical health
-> Focus on social health
and always remember to keep your #LONGTERMVISION
SwingTraderPhil
SwingTrading.Simplified. | Investing.Simplified. | #LONGTERMVISION
Swingtrading

EUR/NZD – Weekly breakdown trigger from rising wedgeEUR/NZD is getting squeezed.
Price has been walking up inside a rising wedge for a while, but it’s starting to look tired right around that 2.02–2.05 area. I’m not interested in guessing the top. I only want it if it actually breaks.
Game Plan
No trade unless we get a weekly close under 2.020
Ideally it breaks, then comes back to 2.02 and fails.
Targets
1.990 first trouble area
1.980 next support
Invalidation
If it reclaims and holds above 2.050, I’m out / not taking it. That’s basically the wedge saying “false alarm”.
Simple one: wait for the weekly confirmation. If it doesn’t give it, I’m happy to sit on my hands.

GBPJPY: Bullish Continuation Ahead 🇬🇧🇯🇵
GBPJPY broke and closed above a resistance line of a
bullish flag pattern on a 4h time frame.
With a high probability, the price will continue rising and
reach 211.95 level soon.
❤️Please, support my work with like, thank you!❤️
I am part of Trade Nation's Influencer program and receive a monthly fee for using their TradingView charts in my analysis.

Home ConstructionLooking at ITB, home construction could be finally waking up. I'm going to add this to my watch list for both my Trend Following account (weekly charts) and Swing Trading account (daily charts). I've got a list of stocks with good volume to consider buying once we get a pullback and an entry signal. As soon I notice a good setup that I like I'll try to go ahead and post it. Cheers!!

TSLA (swingtrading)this is a topic where we can talking about TSLA's next move.
-Looks like TSLA is still respecting its trendline support.
-Should we enter now, or wait for a correction?

Silver Long Setup – Support Zone in Play The Silver 4H chart🪙 Silver Long Setup – Support Zone in Play
The Silver 4H chart (XAGUSD) is flashing a compelling long opportunity as price rebounds from a well-defined Support Zone. After a corrective dip, bulls are stepping in near the 74.55–73.73 region, which aligns with structural support and prior accumulation. With volume stabilizing and price reclaiming momentum, this setup offers a clean risk/reward profile for upside continuation.
🟢 Trade Setup Details
- Buy Zone: 74.5592 to 73.7359
- Max. Stop Loss: 73.7359 (conservative SL at 73.8163 also valid)
- Take Profit Targets:
- 🎯 TP1: 79.4363
- 🎯 TP2: 80.5171
- 🎯 TP3: 81.3697
The current price action around 77.98 suggests bullish intent, with a breakout above the descending trendline adding fuel to the move.
🔍 Technical Highlights
- Price has respected the Support Zone, forming a base for potential reversal.
- A descending trendline has been breached, signaling a shift in short-term sentiment.
- Volume shows accumulation behavior, supporting the bullish thesis.
- The profit zone offers a risk/reward ratio near 2:1, ideal for swing entries.
📈 Bullish Scenario
If Silver holds above the support base, we could see a steady climb toward TP1 and TP2, with TP3 as an extended target. Watch for:
- Bullish candles with strong body and volume confirmation
- Retest of broken trendline as support
- Momentum indicators crossing into bullish territory
⚠️ Risk Management
- SL placement below 73.73 protects against deeper pullbacks.
- Consider partial exits at TP1 and TP2 to secure gains.
- Avoid chasing if price runs too far—wait for pullbacks or consolidation near breakout zones.
💡 Summary: Silver is bouncing off a key Support Zone, with bullish structure forming and upside targets clearly mapped. With TP1–TP3 offering layered exits and a tight SL, this setup blends precision with potential.
📊 Whether you're trading the breakout or riding the wave toward 81+, this setup deserves your attention.

CADJPY Long Setup – Buy Zone ActivateThe CADJPY 4H chart is presenting a clean long opportunity with a well-defined structure. Price has pulled back into a tight Buy Zone between 113.302 and 113.305, showing signs of stabilization after a short-term dip. This zone aligns with prior demand and Fibonacci confluence, making it a high-probability area for bullish continuation.
🟢 Trade Setup Overview
- Buy Zone: 113.302 – 113.305
- Stop Loss (SL): 113.027
- Take Profit Targets:
- 🎯 TP1: 113.715
- 🎯 TP2: 113.920
- 🎯 TP3: 114.099
The setup offers a solid risk/reward ratio of 2.21, making it attractive for swing traders and intraday momentum players alike.
🔍 Technical Highlights
- Price has retraced into a key support zone, showing rejection wicks and volume stabilization.
- The Fibonacci 61.5% retracement sits near TP2, reinforcing the bullish roadmap.
- Volume is tapering off during the pullback, suggesting sellers are losing steam.
📈 Bullish Scenario
If price holds above the Buy Zone, we could see a clean push toward TP1 and TP2, with TP3 as an extended target. Watch for:
- Bullish engulfing candles or pin bars near 113.30
- Volume spike confirming buyer interest
- Break above 113.500 to accelerate momentum
⚠️ Risk Management
- SL is placed just below the Buy Zone to protect against false breaks.
- Consider scaling out at TP1 and TP2 to lock in gains while letting runners aim for TP3.
- Avoid chasing if price moves too far from the zone—wait for a retest or fresh setup.

MDLZ Swing Long 1H Aggressive TradeAggressive Trade
- short impulse
+ exhaustion volume T1
+ support level
+ exhaustion volume 2Sp+
+ weak test
+ first bullish bar close entry
Calculated affordable stop limit
1 to 2 R/R take profit
1D CounterTrend
"- short impulse
+ volumed TE/T1
+ support level
- below volume buildup
+ reverse volume weak approach
+ exhaustion volume Sp"
1M CounterTrend
"- short impulse
+ exhaustion volume TE/T1
+ support level
+ weak approach
+ exhaustion volume manipulation bar without result"
1Y Trend
"+ long impulse
+ 1/2 correction
- SOS above JOC level
+ support level
- ultravolumed manipulation bar"

CADJPY: Important Breakout 🇨🇦🇯🇵
CADJPY broke and closed below a support line
of a rising parallel channel on a daily time frame.
With a high probability, the price will drop to even
lower structure levels.
The next key support is 112.5
❤️Please, support my work with like, thank you!❤️
I am part of Trade Nation's Influencer program and receive a monthly fee for using their TradingView charts in my analysis.

AuropharmaNow the pharma sector is showing some move after a long consolidation. One can look for longs in Auropharma as it has given a breakout of a falling trendline and is coming out of a range.
Entry- 1253-1255
Support- 1225/1220
Target- 1280, 1300
Declaimer- This is just for educational purpose.
JAI SHREE RAM.

Recent Movers – Pullback ExamplesRecent session showed several short-term momentum opportunities. The watchlist was created based on a normalized condition: stocks that made a 52-week high within the last three months. From this scan multiple names were selected with focus on viable pullback trades.
A pullback is a short-term counter-move in response to an impulse move. It represents a controlled reversion toward the mean and provides a structured way to participate if momentum resumes.
There is a pullback indicator is shown on the charts as a visual reference. It shows when price moves outside recent behavior and marks the subsequent reversion. The indicator was not made for entries, but for standardization and consistent evaluation.
Example Charts:
ADI
CPRI
CTRI
SOLV
RF
PFG
NTRS
More than 35 percent of the current watchlist is concentrated in the financial sector. This was also visible through sector relative strength over the past month, led by XLB (Materials) and XLF (Financials). This view can support a top-down perspective but is not required.

Tata ElxsiTata Elxsi gave a breakout of a falling trendline few days back. Now it has given a retest of the trendline and has started its uptrend again. You can a small tight consolidation and a breakout of that range in 4hr timeframe today. A closing of this candle can be a buying opportunity.
Check the chart image for all the entry targets and stoploss and reason for the trade.
Target 1 and stoploss is for short term traders. For long term traders they can look for target 2 and even higher target as this is good pick for long-term.
Disclaimer- This is just for educational purpose.
Jai Shree Ram.

SOLUSD: Deciphering the Neutral Zone with Intrabar⚠️ ANALYTICAL METHODOLOGY: READ FIRST ⚠️
This analysis utilizes a 100% VOLUME-BASED ALGORITHM powered by Lower Timeframe (LTF) intrabar data . unlike standard Price Action, we are scanning the internal structure of every candle to pinpoint liquidity.
📊 DATA PRECISION USED:
For this specific SOL/USD reading, the system is running on 1S (1-Second) data resolution. This ensures that the Support/Resistance zones shown below are derived from real-time volume distribution, not just visual highs and lows.
💡 WHY THIS MATTERS:
Standard charts hide the battle between buyers and sellers. By using intrabar volume geometry, we filter out the noise and only focus on where the "Smart Money" is actually defending positions.
SOLUSD: Trapped in the "Dead Center" Liquidity Void 📉
Most traders guess where the breakout will happen. The math suggests we are currently in a "No-Trade Zone."
Using the DSRTL-ML engine, we have identified a "Neutral / Choppy" regime (S3-D3 State).The price is literally sitting in the dead center of the structure, sandwiched between dynamic buying and selling pressure.
1. The Structural Squeeze
The market is compressing. We are seeing a classic "Energy Build-up."
The algorithm flags this area as Low Probability for trend setups. Why? Because we are far from the "Iron Floor" (Value) and equally far from the "Iron Fortress" .
📐 CRITICAL LIQUIDITY LEVELS:
Static Resistance (Supply Wall):
Dynamic Control Zone (Immediate Cap):
Static Support (Demand Floor):
2. Order Flow & Delta Divergence
Total Volume: 43.24K
Net Delta: -10.45K (Sellers Dominant)
The Trap: Although price is trading ABOVE the Point of Control (POC at 133.08), the negative Delta indicates that every small rally is being sold into. The buyers are not aggressive here; they are merely absorbing. This divergence often precedes a liquidity flush or a fake-out.
🧠 The Smart Play (Scenario Logic)
We do not predict; we react to confirmed structure breaches.
🐂 Bull Confirmation: Price must reclaim 142.69 with positive Delta to prove buyers have absorbed the supply.
🐻 Bear Confirmation: A loss of the dynamic floor at 135.95 validates the negative delta and likely targets the 131.00 demand zone.
Current Verdict: Patience. Let the liquidity reveal its hand before committing capital.
⚠️ DISCLAIMER:
This reading is generated entirely by the algorithmic calculations and outputs of DSRTL-ML; it is absolutely NOT financial advice . Always Do Your Own Research (DYOR).
⏱️ REAL-TIME DATA SNAPSHOT:
Please note that the Volume, Delta, and Level figures presented below are captured at the exact moment of analysis . Since the DSRTL-ML algorithm processes live intrabar ticks in real-time, these numbers will naturally evolve and update on your chart as new market activity occurs from the time of writing to publication.

BG Trade ReviewRecent sessions produced several short-term momentum opportunities. The watchlist was created from a scan for stocks making new 52-week highs within the last three months. From this scan, about 20 names were selected.
There were multiple continuation setups, for example BG, BTU, ADI, M, SOLV, PFG, NTRS, RF, and others. Some names remain indecisive so far, such as CPRI and CSIQ.
The approach is to enter within the pullback rather than on late breakout entries, with the purpose of selling into momentum. This means entries should not be chased and stops are placed at a reasonable distance, since the time of expansion is not predictive.
In this post, I review one of several trades. This is not a best-case setup, but simply the most recently closed trade. In BG, there was a prior momentum move followed by a controlled, somewhat complex pullback, which I most of the time tend to avoid. In this case, however, entry was taken on expansion from a lower reference point. Entry was at 90.70, and the position was sold into third-day highs near 95, resulting in a 1R outcome.
Risk is standardized. Position size is fractal 2% of account, stop is placed at 2-3 ATR with a fixed 1R target. These values and brackets are automated via the risk module . Hopefully, I can review more clear setups in the near future.

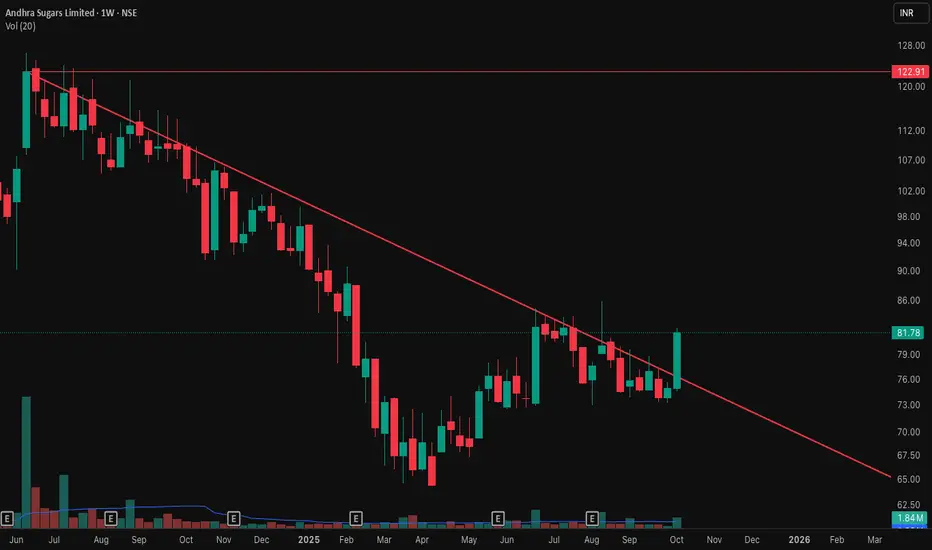
Andhra Sugars Ltd - Weekly Chart📊 Andhra Sugars Ltd – Trendline Breakout on Weekly Chart 🚀
📅 Chart Date: October 12, 2025 | Timeframe: Weekly
📈 CMP: ₹81.78 (+9.01%)
📍 Symbol: NSE:ANDHRSUGAR
🔍 Technical Analysis
📉 Downtrend Line Broken After Months of Consolidation
The stock had been trading under a strong falling trendline since mid-2024.
This week’s bullish candle successfully closed above the trendline, indicating a potential reversal from the long-term downtrend.
💥 Volume Confirmation
Noticeable rise in weekly volume (1.84M) compared to the recent average of 1.06M, showing buying interest emerging from the support zones.
🟡 Key Resistance Level: ₹122.91 (previous swing high from June 2024).\
A breakout and weekly close above ₹123 could confirm a major trend reversal and open up higher targets.
📌 Key Levels
Immediate Support (Breakout Retest Zone): ₹75–₹77
Resistance Zone: ₹122.91
Next Targets: ₹95 / ₹110 / ₹123
Stoploss (Weekly Close Basis): ₹70
⚠️ Disclaimer
This analysis is for educational and charting purposes only. Not financial advice. Please do your own research before making any investment decisions.
SEAMEC LTD - Weekly Falling Trendline Breakout📊 SEAMEC LTD – Weekly Falling Trendline Breakout Attempt 🚀
📅 Updated: Dec 03, 2025 | ⏱️ Timeframe: 1W
CMP: ₹987.85 (+2.81%)
Ticker: NSE:SEAMECLTD
🔍 Technical Overview
SEAMEC is showing strong bullish momentum on the weekly timeframe, attempting a breakout above a 1.5-year falling trendline drawn from 2024 highs.
A strong base formation is also visible:
🟦 Demand Zone (Support Block): ₹830–₹870
Price has respected this demand zone multiple times, creating a rounded accumulation base.
📈 Current Move:
Breakout candle touching the trendline
Higher lows forming since August 2025
Volume expansion on recent bullish candles indicating accumulation
A confirmed breakout above the falling trendline could mark the beginning of a fresh medium-term uptrend.
🎯 Chart Summary
SEAMEC is showing signs of reversing its prolonged downtrend.
Breakout confirmation above ₹1,030 may open the path toward:
🎯 Targets:
₹1,120 (supply zone)
₹1,210 (swing high)
A close above the trendline with volume would validate the reversal.
⚠️ Disclaimer
This analysis is for educational and chart-study purposes only. Not financial advice. Always do your own research before trading.

Buy Citizens Financial GroupShort Term Trading Advice by Naranj Capital
Buy Citizens Financial Group
● Buy Range- 60 - 61
● Target- 64 - 65
● StopLoss- Below 58
● Potential Return- 5-7%
● Duration- 12-14 Trading Days

EURCAD: Strong Bullish Sentiment 🇪🇺🇨🇦
EURCAD broke and closed above a significant supply cluster
on a 4h time frame.
It opens a potential for more growth.
The next strong resistance that I see is 1.6167.
The price will likely reach that soon.
❤️Please, support my work with like, thank you!❤️
I am part of Trade Nation's Influencer program and receive a monthly fee for using their TradingView charts in my analysis.

USDJPY: Breakout & Bullish Continuation 🇺🇸🇯🇵
There is a high probability that USDJPY will rise more,
following a confirmed breakout of a key daily horizontal resistance.
The next strong key level is 157.6.
It will most likely be the next goal for the buyers.
❤️Please, support my work with like, thank you!❤️
I am part of Trade Nation's Influencer program and receive a monthly fee for using their TradingView charts in my analysis.

central bank of IndiaPlease read other post also of 4 psu banks that can give multi bagger result.
central bank of India- Keep an eye over 40.50 levels
breaking above level will result in trend reversal and can reach upto the levels of 46,60,70

IDBI BANK SOLID BREAKOUTIDBI BANK has given a solid breakout with 10x the average volume.
Very beautiful cup and handle breakout
Though RSI is little stretched on daily time frame but looks good on weekly, safe traders can add only 50% of qty here and rest at retest.
Target -128 and 145

GOLD (XAUUSD) – Inverted Head & Shoulders Setup📊 Technical Outlook
Gold is currently forming an inverted head & shoulders pattern, with the right shoulder established around 4308. Price action is consolidating near the neckline zone (4380–4400), and a confirmed breakout above this level would validate the bullish continuation.
🎯 Upside Targets
• TP1: 4540 – First long-term target aligned with measured move projection.
• TP2: 4650 – Extended bullish target, continuation of momentum.
📈 Trade Plan
• Entry Zone: Accumulation around 4308–4320, confirmation above 4380–4400.
• Stop-Loss: Below 4300 (invalidates right shoulder).
• Take Profit:
• TP1: 4540
• TP2: 4650
⚠️ Risk Notes
• A breakdown below 4308 risks invalidating the bullish setup.
• Watch for false breakouts at 4380; volume confirmation is key.
• Macro drivers (Fed policy, inflation, geopolitical tensions) may add volatility.
📌 Summary: As long as 4308 holds, gold remains bullish with potential continuation toward 4540 and 4650. Breakout above 4400 is the trigger for momentum buyers.

Micron Technology - The bullrun will end today!🏒Micron Technology ( NASDAQ:MU ) is now starting a correction:
🔎Analysis summary:
Over the course of the past couple of months, Micron Technology rallied an expected +350%. However, with the current retest of major resistance, it is quite likely that this bullrun will end soon. Just wait for sufficient bearish confirmation after this long rally.
📝Levels to watch:
$350
SwingTraderPhil
SwingTrading.Simplified. | Investing.Simplified. | #LONGTERMVISION
