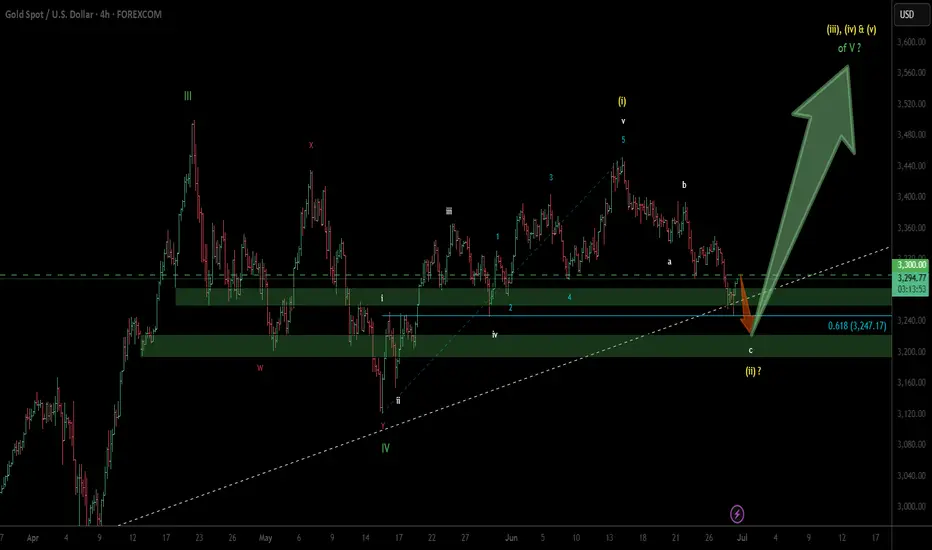
GOLD - next wave up soon...Updated Wave Count... still holding long...
Wave (ii) in yellow is possibly nearing completion.
3200 should limit any move to the downside.
previous wave count...
Swingtrading
Market BreadthMarkets are still in 'Bull' mode going into the 4th. Keeping a eye on the 9-EMA which I use as a trailing stop on my long positions. Not likely to pick up any new positions for now.

XAUUSD 4hour TF - June 29th, 2025XAUUSD 4hour Neutral Idea
Monthly - Bullish
Weekly - Bullish
Daily - Bullish
4hour - Bearish
Gold has been on the rally of a century for a while and isn’t showing too many signs of slowing down long term. For now we do have a couple opportunities I can bring to your attention.
4hour bearish continuation - For this to happen we would like to see price action come back to our pocket of confluence near the 3,320.000 level followed by bearish conviction. If this happens look to target lower toward major support levels like 3,225.500.
4hour trend reversal - If we are to see a reversal of the 4hour trend we would need to see price action pop back above the 3,320.000 resistance area. Look for strong bullish conviction above this level and target higher toward appropriate levels of resistance.

EURJPY 4hour TF - June 29th, 2025EURJPY 4hour Bullish Idea
Monthly - Bullish
Weekly - Bullish
Daily - Bullish
4hour - Bullish
EJ has been in a bullish trend on all timeframes and doesn’t really show any signs of stopping. Currently we are right near major monthly resistance around 171.000. It is likely we will see price action push into this zone but we want to identify a potential trade beforehand.
Here are two potential scenarios for this week on EJ
Bullish Continuation - We are a bit close to the 171.000 monthly zone so we would like to see price action come back to our 168.500 4hour support zone before targeting higher.
Trend Reversal - If we see price action fall below 168.500 we want to see bearish conviction and rejection from that same zone. If this happens we can start to consider short scenarios and target lower support levels like 166.250.

USDJPY Daily TF - June 29th, 2025USDJPY Daily Neutral Idea
Monthly - Bullish
Weekly - Bearish
Daily - Bearish
I’m looking at the Daily time frame here as this is the only clear picture for price action in terms of trends. The 4hour looks like price action can’t make a decision so we will wait for price action to get closer to some major zones.
Bearish Continuation - Ideally, we want to see price action touch 147.500 again followed by convincing bearish rejection. Look to target lower toward major support levels if this happens.
Aside from this potential setup we don’t have much to look at here on UJ.

XAUUSD 4H Analysis – Possible Break Below Key StructureStructure Overview:
After printing a multi-month high around 3,473, price has formed a clear rounded top followed by lower highs, showing weakening bullish momentum. Gold is now retesting a key structure zone near 3,270–3,275, which has acted as previous support several times.
📉 Key Technical Observations:
Trend: Short-term bearish within a broader consolidation
Support Zone: 3,270–3,250 (watch closely for a break)
Resistance Levels:
Minor: 3,340
Major: 3,390–3,400
📊 Scenario Outlook
🔻 Bearish Bias (Preferred Scenario)
If price closes below 3,270, expect:
Initial target: 3,210–3,220 zone (clean imbalance + previous resistance)
Secondary target: 3,130–3,150 (March structure break zone)
This would confirm a transition into a mid-term bearish leg unless a fakeout occurs.
🔺 Bullish Recovery (Alternative Scenario)
If price reclaims 3,305 with strength:
A move back toward 3,340–3,360 is possible
Needs volume + momentum confirmation, ideally with a bullish engulfing candle
⚠️ What to Watch
Daily candle close relative to 3,270
Reaction at 3,250–3,260 demand zone
Gold often sweeps key lows before reversing — watch for liquidity grab wicks
📌 Conclusion
Gold is sitting at a critical level — a confirmed close below 3,270 could open the doors for a deeper retracement toward March’s breakout levels. Until then, this remains a watch and react environment. Avoid chasing.

HYPE — How to Combine Fibonacci, VWAP and Market StructureAfter an explosive +392% rally in just 70 days — from $9.298 to a peak of $45.8 — HYPE has entered a consolidation range as expected. Structurally, this appears to be a 5-wave impulse now transitioning into a corrective ABC pattern. Based on current structure, we may now be forming wave B.
What’s Unfolding Now?
A potential Head & Shoulders pattern is developing, with price currently working on the right shoulder. The $40 mark stands out as a key resistance — both technically and psychologically:
0.618 Fibonacci retracement of the down move sits at $40.108
Structural resistance from prior highs
Ideal area for a short rejection
🎯 Short Setup:
Entry: Laddered short between 0.618 ($40.108) and 0.786 ($42.611)
Stop-Loss: Above $44 (after rejection adjust to entry)
Target: $28–$27 zone
R:R potential: 1:3 up to 1:9 depending on entry quality
📍 Why $28–$27 Is Key Support:
0.5 Fibonacci retracement of entire +392% rally sits at $27.549
Anchored VWAP from the rally origin ($9.298) aligns around this zone
Weekly & Monthly S/R convergence
VAH (Value Area High)
0.618 Fibonacci Speed Fan also aligns as dynamic support
Fair Value Gap (FVG) lies in this region
Weekly 21 EMA at $28.05/Weekly 21 SMA at $24.10 — both key moving averages providing layered support and trend structure
📐 Bonus Confluence Insight:
If this is indeed wave B, then projecting a 0.786/1.0 Trend-Based Fib Extension from wave A aligns well with the 0.5 fib retracement at $27.5.
📚 Educational Insight:
Stacking confluences such as Fibonacci retracements, anchored VWAPs, volume zones, EMA/SMA levels, and harmonic structures helps identify high-probability zones where smart money is likely to act. These levels become even more powerful when they align across multiple tools and timeframes. Always confirm with price action.
_________________________________
💬 If you found this helpful, drop a like and comment!
Want breakdowns of other charts? Leave your requests below.


BANCOINDIA - Earnings Gap up (EP)
- Strong prior buying force
- Narrow range consolidation near ATH
- Volume dry up
- Small SL , High R:R

Broadcom - This was just the first all time high!Broadcom - NASDAQ:AVGO - just created new highs:
(click chart above to see the in depth analysis👆🏻)
Over the course of the past three months, Broadcom has been rallying an impressive +80%. However looking at market structure, all of the previous "dump and pump" was not unexpected. Following this recent bullish strength, Broadcom is likely to channel a lot higher.
Levels to watch: $250, $400
Keep your long term vision!
Philip (BasicTrading)

Bitcoin Controlled consolidation above 106,480 Technical Overview – Summary Points
➤ BTC trades in the 1st quartile of its yearly range (100k – 111k).
➤ Stacked resistance zone: 108,239 to 110,603 USDT → potential seller exhaustion.
➤ Key support at 106,480; defensive cluster 102,626–99,581.
➤ Risk On / Risk Off Indicator = Strong Buy; ISPD Divergence = Neutral.
➤ Normal volume, but lack of fresh capital → sustainability of rally questionable.
__________________________________________________________________________________
Strategic Summary
➤ HTF trend bullish above 106,480; breakout > 108,239 targets 109,950 / 110,600.
➤ Buy swing pullbacks on 106,480 or 104,600. Invalidation < 102,626 = drop to 99k.
➤ Tactical short scalps around 108,250–109,000.
➤ Core PCE = major catalyst (June 27).
➤ Watch spot volumes, funding, and Risk On / Risk Off signals.
__________________________________________________________________________________
Multi-Timeframe Analysis
➤ 1D : bullish bias > 106,480; danger < 102,626.
➤ 12H : bullish consolidation; confirmed breakout > 108,239.
➤ 6H : compression; buy dips 106,480 / 104,600.
➤ 4H : lateral-bullish; key support = 104,600.
➤ 2H : neutral-bullish; triggers = 107,800 / 106,000.
➤ 1H : bull flag; micro-divergence, prefer long > 106,950.
➤ 30 min : tight triangle; breakout at 107,200 / 106,650 = signal.
➤ 15 min : bearish < 106,950, expected bounce on 106,480.
__________________________________________________________________________________
Macro, News & On-Chain Analysis
➤ Macro backdrop: “Higher for longer” stance continues, no FOMC imminent.
➤ Core PCE June 27: upside surprise (2.7% YoY vs 2.6% expected) – USD supported, potential headwind for risk assets.
➤ Pacific Region: ongoing tensions in Taiwan Strait and South China Sea:
- Increased military activity: air incursions, naval maneuvers.
- High risk of escalation flagged by defense analysts & social feeds.
- Risk sentiment: volatile – sudden events could trigger risk-off.
➤ On-chain: Range 100–110k; weak spot volume; cautious leverage; no major sell-side imbalance.
__________________________________________________________________________________
Conclusion
➤ BTC maintains a controlled bullish bias > 106,480.
➤ Swing buy zones = 106,480 & 104,600; targets 109,950 / 110,600.
➤ Main risk: break < 102,626 = sell-off toward 99k.
➤ Monitor Core PCE and geopolitical risk in the Pacific region.
__________________________________________________________________________________

GRAB — Breakout Confirmation and Strong Upside PotentialGrab Holdings (GRAB) is currently forming a promising technical setup supported by a breakout from long-term consolidation. After printing a strong low and breaking out of a multi-year range, the price action confirms a bullish reversal with clear structure.
Technical Analysis
– Trendline breakout and bullish market structure shift
– Price is consolidating above the breakout level, forming a continuation zone
– Valid entries: market execution above $4.50 or limit orders near $4.00 support
– First profit target: $6.60 (around 40% growth)
– Second target: $10.15 (over 100% from entry)
The setup suggests increasing bullish momentum. A clean consolidation above previous resistance strengthens the case for a breakout continuation toward $6.60 and potentially $10.15.
Fundamental Backdrop
Grab is a Southeast Asian tech leader operating across ride-hailing, food delivery, and digital payments. The company continues to reduce losses, improve margins, and expand its fintech arm. With rising digital adoption in the region and a shift toward profitability, GRAB is gaining investor attention. Its most recent earnings report showed improving revenue trends and narrowing net losses — a strong signal of long-term sustainability.
Conclusion
Grab Holdings presents a well-aligned opportunity from both a technical and fundamental perspective. With a clear structure, breakout confirmation, and fundamental turnaround, this setup fits both swing and midterm investment strategies. Risk management is still key — stops should be placed below consolidation lows or key structure levels.

Amd - This is just the beginning!Amd - NASDAQ:AMD - perfectly plays out:
(click chart above to see the in depth analysis👆🏻)
Despite the harsh drop of about -65% which we have been witnessing starting back in 2024, Amd remains bullish. Just three months ago, Amd retested a textbook confluence of support. We saw bullish confirmation, the bottom is in and Amd will rally significantly from here.
Levels to watch: $200, $300
Keep your long term vision!
Philip (BasicTrading)

TSSITSSI had the last two months of fantastic price gains and could be a little overbought now. Looking for a small pull back before the next setup signal.

Nvidia - 100% new all time highs!Nvidia - NASDAQ:NVDA - is just too bullish now:
(click chart above to see the in depth analysis👆🏻)
Honestly it was not unexpected that Nvidia is now the most valuable company in the world. The chart is just so strong and perfectly following structure; it seems to be just a matter of days until Nvidia will create a new all time high. If this happens, a breakout rally will follow.
Levels to watch: $150
Keep your long term vision!
Philip (BasicTrading)

Bitcoin - We have to see new highs now!Bitcoin - CRYPTO:BTCUSD - is now at the previous highs:
(click chart above to see the in depth analysis👆🏻)
It could really not be more exciting on Bitcoin at the moment. With the current "all or nothing" potential breakout or double top creation, we will either see a bullrun or a bear market. So far, bulls are still strong, so the chances of a breakout luckily remain higher.
Levels to watch: $100.000
Keep your long term vision!
Philip (BasicTrading)

New Setup: CMPFound this potential little gem providing IF we continue higher - CMP is now giving me a setup signal for now for a swing trade. Cheers!

Meta Platforms - This stock tastes sooo good!Meta Platforms - NASDAQ:META - will print a new all time high:
(click chart above to see the in depth analysis👆🏻)
Over the course of the past two months, Meta has been rallying +40%. This recent behaviour was not unexpected at all but rather the consequence of the all time high break and retest. Now - back at the previous all time high - Meta will most likely break out higher again.
Levels to watch: $700, $900
Keep your long term vision!
Philip (BasicTrading)

TATAMOTORSi Observed these Levels based on Price Action and Demand & Supply which is my own Concept "PENDAM CONCEPTS"... Please don't take any trades based on this chart/post... Because this chart is for educational purpose only not for Buy or Sell Recommendation... Thank Q

Good move is expected soonhi fellas,
The Weekly trend of cochin shipyard is solid and bullish.
At daily timeframe there is a swing whose target can be till the weekly resistance level as mentioned in the chart.
The risk : reward ratio is 1:3.87
Enter after the daily candle closes above 2243.70
SL and target is mentioned in the chart.

SPY 500 BreadthCurrently see weakness on the breadth of the S&P500. We go back below the 9-EMA and could head back down to the gap-fill area. For now I'm working on my watchlist and looking for potential bounces on leading stocks.

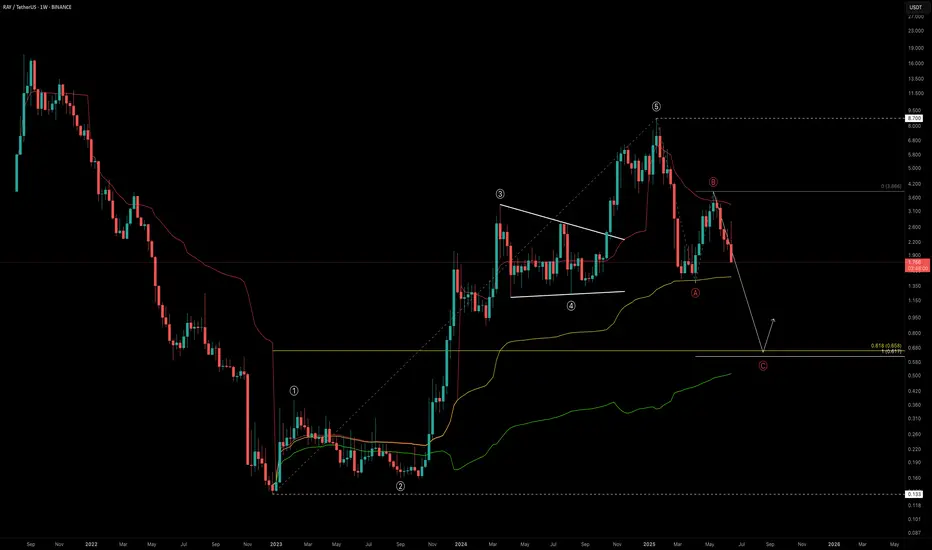
RAY Outlook: Is a -60% Drop the Reset We Need?RAY marked its bottom in December 2022 at just $0.133, entering a prolonged accumulation phase that lasted nearly a year. Then, in late 2023, it broke out into an explosive bull run, skyrocketing +6421% over 756 days and peaking at an impressive $8.70.
This run completed a full five-wave Elliott Wave structure. After topping out, RAY dropped -84% down to $1.388 — likely marking the Wave A correction. A strong relief rally followed into the $4 region before facing rejection at the yearly VWAP, possibly completing Wave B. Now, all signs point toward us being in the final Wave C of the larger corrective structure.
So, where could Wave C bottom out?
🔍 Fibonacci Confluence Zones (Log Scale)
Let’s assess the key levels with log-scaled Fibonacci tools:
🔹 Fib Retracement (from $0.133 low to $8.7 high):
The 0.618 fib retracement lies at $0.658
🔹 Trend-Based Fib Extension (Wave A → B projection for Wave C):
1.0 TBFE sits at $0.617
✅ These two levels align nearly perfectly, giving us a strong confluence zone between $0.62 and $0.66
Additional Confluences
Anchored VWAP Bands:
The 0.618 VWAP band multiplier also aligns with this $0.6 zone
Liquidity Perspective:
This level would wipe out long positions built over the past 550 days — clearing and potentially resetting the market
🚨 Fair Value Trend Model (FV Trend Model):
According to my Fair Value Trend Model indicator, the fair value for RAY currently sits around $0.78 — right in line with the broader confluence zone. This model uses log-log regression to estimate Bitcoin’s and other assets’ fair-value over time.
👉 Feel free to use the indicator
Just head over to my profile, click on the “Scripts” tab, and you can add the Fair Value Trend Model to your charts to experiment with it yourself.
Together, these technical elements form a compelling high-probability zone for long setups around $0.6–$0.8.
💡 Educational Insight — Why 0.618 is a Critical Fib Level
In Elliott Wave theory and harmonic trading, the 0.618 retracement is known as the "Golden Ratio" — often serving as a magnet for price during corrections. When paired with a 1.0 trend-based fib extension, it can mark exhaustion zones where Wave C concludes.
🔭 Summary: What’s Next for RAY?
Potential bottom zone: $0.61–$0.78
Watch for reversal signals like bullish candlestick patterns, volume spikes, or divergences
A drop to this zone would represent a -60% drawdown from current levels
Remember: High-probability setups don’t come every day — patience is your edge
Set alerts. Stay prepared.
_________________________________
💬 If you found this helpful, drop a like and comment!
Want breakdowns of other charts? Leave your requests below.
BTC Loses Key Level — Will 100K Hold or Fold?Bitcoin has been locked in a range for the past 45 days, clinging above the critical psychological support at $100K. But cracks are starting to show…
Every bounce from the key level at $102,430 has been weakening — and now, for the first time, we’re breaking cleanly below it. Things are starting to tilt bearish.
So the question is…
⛏️ Will 100K be tested next?
🔍 Key Support Zone: $97.7K–$96.9K
Using the Fibonacci retracement from the swing low at $74.5K to the recent ATH, the 0.382 retracement lands at $97,655 — just below the $100K mark.
But there’s more…
Here’s why the zone between $97.7K and $96.9K is crucial:
0.382 Fibonacci retracement: A common pullback level in strong uptrends.
Anchored VWAP from $74.5K: Currently sitting around $96.9K, tracking cumulative volume-weighted average price — a key level.
Daily Order Block: Sits right at $96,887, aligning with the VWAP and reinforcing the area as demand-rich.
1.272 Fibonacci extension: From the previous move — providing another layer of confluence.
Fair Value Gap (FVG): The imbalance lies right in this zone. Price often fills these before continuing trend.
All of this stacks up to a high-probability long setup.
🕵️♂️ What to Do Now?
Set alerts at $100K and watch for a reaction. If price slices through, shift focus to the 0.382 Fib — monitor price action closely for signs of a reversal.
The first clean test of this zone could present a solid long — but as usual don’t trade blindly. Wait for confirmation.
_________________________________
💬 If you found this helpful, drop a like and comment!
Want breakdowns of other charts? Leave your requests below.
