CHAMBAL FERTILIZERS FOR SWING TRADECHAMBAL FERTILIZERS a good opportunity for swing trade plan, entry and exit point mention, add your watchlist and observe.
This is for Education purpose only...
Swingtrading

Tesla - There's more after the +60% rally!Tesla - NASDAQ:TSLA - will blow even further:
(click chart above to see the in depth analysis👆🏻)
It is almost incredible to see such a large cap stock rally more than +60% in less than two months. But Tesla is clearly the exception and therefore we should expect the unexpected. What's quite likely is at least another rally of about 25% from here and a retest of the previous all time high.
Levels to watch: $250, $400
Keep your long term vision!
Philip (BasicTrading)

EURGBP forex rallying as expected off weekly demand levelWeekly uptrend. Weekly demand imbalance at 0.83 is still in control and trying to play out as expected. Any swing long positions should be managed. I hope you could take advantage of long positions using the smaller timeframes for those intraday and short-term forex traders.

Review and plan for 10th June 2025 Nifty future and banknifty future analysis and intraday plan.
Positional ideas.
This video is for information/education purpose only. you are 100% responsible for any actions you take by reading/viewing this post.
please consult your financial advisor before taking any action.
----Vinaykumar hiremath, CMT

AUDJPY: Consolidation is Over!🇦🇺🇯🇵
AUDJPY is completed a consolidation, violating
a resistance of a horizontal range on a daily.
The price will most likely continue rising and reach 95.0 level soon.
❤️Please, support my work with like, thank you!❤️

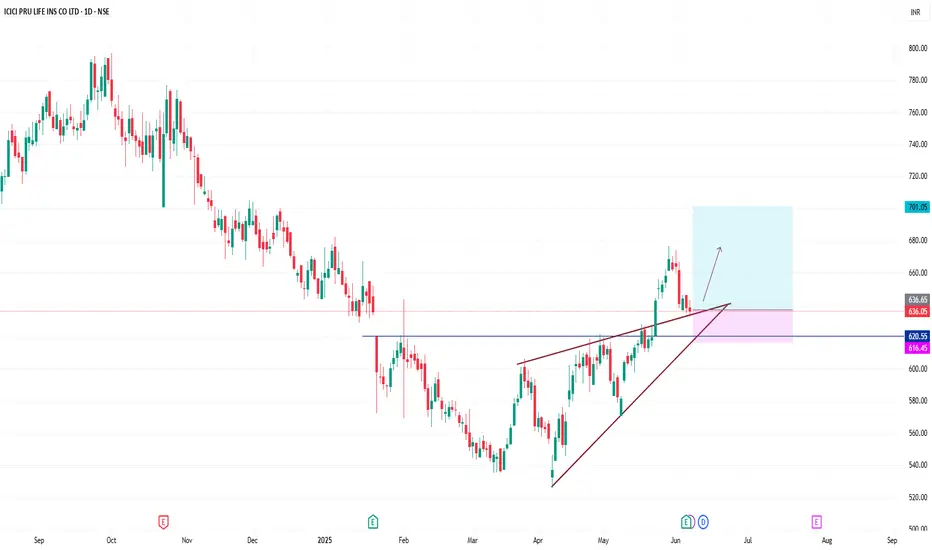
ICICI PRU LIFE INSDaily timeframe, its a swing trade, trendline breakout and retest, stoploss below 620 and target is 700, add your watchlist and observ this stock.
$ENS / USDT 1D FAKEOUT ON FLAG? Incoming Pump? 📊 $ENS/USDT Perpetual Contract – Daily Timeframe Analysis
🟢 Bullish Setup
A bullish flag is forming on the daily chart — a continuation pattern indicating potential upward movement.
- Price recently entered into the golden pocket of the Fibonacci retracement tool marked from $16.881 – $25.241 on the third touch of the flag's resistance, triggering a fakeout, it now rests in the first Fair Value Gap.
- The strong wick rejection on the 3rd retest of the resistance/supply indicates bearish strength, momentarily pushing price lower.
- Despite this, the overall pattern remains valid as long as price respects the Golden Pocket and FVG zone below.
✅ If price closes above the golden pocket, it could present an excellent leveraged entry or spot position, with high reward potential off 67%.
🔴 Bearish Scenario
- So far, every test of the **4H supply zone** has resulted in rejection — showing persistent seller control at short-term resistance.
- If buyers fail to defend the golden pocket and recover the bullish trendline, the structure confirms a break. (Downtrend)
The confirmation of bearish pressure is the:
1) Large wick (Creating a shooting start candle pattern)
- Signaling bearish reversal.
2) Large Bearish Marubozu Candle.
- Indicates strong continuation of a downtrend.
3) Candle close below Trend line support.
- Showing Bears were able to successful make a major move.
🔽 In that case, we look to short after FVG confirmation and scalp down toward the daily demand zone.
📌 Patience is key. Let the price show intent before entering.
Please let me know what your thoughts are!

HYPE Precision Trading — Pattern, Patience, ProfitHYPE has shown strong performance since early April, maintaining a clear uptrend. Currently, the market is consolidating in a range between $30 and $40 and it’s setting up for something interesting. Let’s break it down and map the next high-probability trade setup.
Potential Gartley Harmonic Pattern Forming
A valid Gartley pattern may be developing, with point D potentially forming around the $29 level. This zone offers solid confluence for a high-probability long setup.
🟢 Long Setup – Gartley Harmonic Pattern Completion at around $29
Confluences around $29–$28.3:
0.786 Fib retracement of XA
Trend-based Fib Extension 1:1
Negative -0.618 Fib as take-profit level for prior short
Anchored VWAP (0.666 band multiplier) acting as dynamic support
200/233 EMA/SMA support on the 4H TF
FVG + liquidity pool resting just below $30
Setup Details:
Entry Zone: Trend-based Fib Extension 1:1 or laddered between $30–$28.3
Stop Loss: Below $27.5 (adjust depending on where point D forms)
Target: 0.618 of CD leg ≈ $34.4
R:R ≈ 1:3.5
🔴 Short Setup – look for rejection at $36
0.618 Fib retracement from previous move (ideal short entry)
Invalidation: Break above $38.2 (above point C)
Take Profit: $30-$29
R:R ≈ 1:3
🧠 Educational Insight:
Harmonic patterns offer precise entries and targets by aligning Fibonacci levels with market structure. When combined with tools like Anchored VWAP and liquidity analysis, they become powerful tools for swing trading.
Summary:
HYPE continues to respect structure beautifully, offering repeated swing setups in the 10%–20% range. With clear fib symmetry and predictable behaviour, it remains one of the more technically sound altcoins.
Stay patient. Wait for the pattern to complete. As always — don’t chase. Let the trade come to you.
_________________________________
If you found this helpful, leave a like and comment below! Got requests for the next technical analysis? Let me know.

Intel - This might be the bottom!Intel - NASDAQ:INTC - might create a bottom:
(click chart above to see the in depth analysis👆🏻)
For almost an entire year, Intel has been consolidating at a major horizontal support. Considering the previous significant bloodbath, Intel might soon find its bottom, which is inevitably followed by a major bullish reversal. After all, market structure is slowly shifting bullish.
Levels to watch: $20.0, $25.0
Keep your long term vision!
Philip (BasicTrading)


TURBO ANALYSIS📊 #TURBO Analysis
✅There is a formation of Falling Wedge Pattern on daily chart and currently pullback around its major support zone🧐
Pattern signals potential bullish movement incoming after sustain above the major support zone and breaks the pattern with good volume
👀Current Price: $0.004050
🚀 Target Price: $0.004470
⚡️What to do ?
👀Keep an eye on #TURBO price action and volume. We can trade according to the chart and make some profits⚡️⚡️
#TURBO #Cryptocurrency #TechnicalAnalysis #DYOR

GOLD - Buy the dips toward the 50% / 61% retracement...the decline from the 22nd of April is in a very clear 3 waves with a perfect 100% retracement. the subsequent rally from the 15th of May is in a clear motive sequence. negative RSI divergence signals that some sort of 5th wave is complete.
the characteristics of this motive rally seems like a wave (i) of V is complete and we are now looking for a drop to complete wave (ii) of V.
buying dips toward the 50% / 61% retracement is my preferred strategy for now.
a rally and daily close above 3400 would invalidate this analysis. keep in mind possible volatility due to upcoming event risk.

Tactical BTCUSDT Swing: Persistent Risk On, Key Stop at 103,000__________________________________________________________________________________
Technical Overview – Summary Points
__________________________________________________________________________________
Momentum: Strong bullish sectoral momentum (Risk On / Risk Off Indicator on strong buy across all timeframes), but momentum is fading just below key resistances.
Supports/resistances: Key 104,179–103,086 area tested on every timeframe, consolidating a major price floor. Upside targets: 109,588 then 111,980.
Volume: Stable liquidity, no anomaly spike or structural rupture. Volumes consistent with trend; moderate pickup in activity near supports, no climax.
Market behavior: Investor Satisfaction Indicator is neutral on all timeframes except 1H (behavioral buy signal to monitor). No euphoria or panic, no aggressive accumulation.
__________________________________________________________________________________
Strategic Summary
__________________________________________________________________________________
Global bias: Cautiously bullish as long as 104,179–103,086 pivot support holds. Risk On / Risk Off Indicator gives a strong bullish sector signal. Macro backdrop neutral, low volatility.
Opportunities: Swing timing on pullback to support confirmed on 1H/4H, targets 109,500/111,980. Wait for daily/4H confirmation before full allocation.
Risk zones: Strong invalidation under 103,086, alert under 104,179. Suggested technical stop-loss below 103,000 USDT.
Macro catalysts: Watch ECB and Fed (8:30–9:45 UTC, Thursday). Expect possible volatility spike, adjust sizing and stop accordingly.
Action plan: Active swing trading off support, dynamic stops, partial exposure ahead of major events. Active risk/reward management (>2.5), upside targets on technical pivots, liquidity is normal.
__________________________________________________________________________________
Multi-Timeframe Analysis
__________________________________________________________________________________
: Global uptrend but fading momentum below ATH. Major support 104,179–103,086, no clear behavioral signals. Risk On / Risk Off Indicator strong buy, volumes stable.
: Strong tech sector bias (Risk On / Risk Off Indicator strong buy), support at 104,179. ISPD DIV neutral, volumes normal.
: Pause/consolidation above multidimensional support (104,179). Healthy but cautious structure.
: Consolidation >104,179, long positioning remains valid as long as support holds; no clear short-term behavioral inflow.
: Testing key support, first signs of indecision. Increased watchfulness recommended.
: First short-term behavioral buy signal (ISPD DIV/mason's), optimal tactical allocation timing if 104,179 support is defended.
: Intraday range on support, no emotional spike or break volume.
: Local flush, defensive rebound off support, short-term range scenario; potential technical bounce.
Cross-timeframe summary:
- 104,179 is the key defensive multi-support area, tested across all TFs.
- Risk On / Risk Off Indicator is bullish across the board, except behavioral divergence (ISPD DIV Buy on 1H only).
- No panic or rupture volumes detected.
- Immediate risk if breakdown below 104,179 and/or 103,086: opens door to intraday bearish extension toward 93,377.
__________________________________________________________________________________
STRATEGIC OUTLOOK – Final Summary
__________________________________________________________________________________
Technical setup: Solid consolidation above 104,179/103,086 supports, sectoral buying confirmed. No major deterioration unless a clear breakdown occurs.
Opportunity: Short-term swing entry on 1H/4H signal, target 109,500–111,980. Stop-loss below 103,000 advised.
Risk: Downside acceleration if support breaks, especially if LTH profit taking continues or spot demand fades.
Macro: Calm backdrop, ECB and Fed decisive for short-term volatility. Watch post-announcement market action.
On-chain: Significant profit-taking near highs, no euphoria, positive risk/reward if stops are respected.
Operational summary:
Cautiously bullish while 104,179/103,086 hold.
Tactical swing entry possible on pullback and confirmed signal (1H or 4H).
Strict stop management below 103,000, reduced exposure before key ECB/Fed events.
Upside targets: 109,588 – 111,980.
Monitor volumes and behavioral signals post-news.
Key levels to watch:
Supports: 104,179, 103,086
Resistances: 109,588, 111,980
Macro alerts: ECB/Fed (Thursday morning, 8:30–9:45 UTC)
Behavioral ISPD DIV signal after news
Suggested stop-loss : < 103,000 USDT (as of 01/06/2025, 22:56 CEST)
Comprehensive analysis based on multi-timeframe technical structure, Risk On / Risk Off Indicator and ISPD DIV behavioral/mason's confirmations. Remain disciplined and flexible in risk management.
__________________________________________________________________________________

USDCHF: Bearish Wave Ahead 🇺🇸🇨🇭
Quick update for USDCHF.
Earlier on Monday, I shared a bearish forecast based on a
confirmed violation of a neckline of a head and shoulders pattern on a daily.
We got quite a deep retest of that and bears finally showed their presence.
I remain bearish bias and expect a bearish continuation soon.
❤️Please, support my work with like, thank you!❤️
I am part of Trade Nation's Influencer program and receive a monthly fee for using their TradingView charts in my analysis.

New Setup: DANI got a swing trade setup signal for DAN. I'm looking to enter long if the stock can manage to stay above 16.59. If triggered, I will place a stop-loss if it closes below 16.24. My Take Profit at 18.34 area. Meanwhile using a 9-EMA trailing stop.

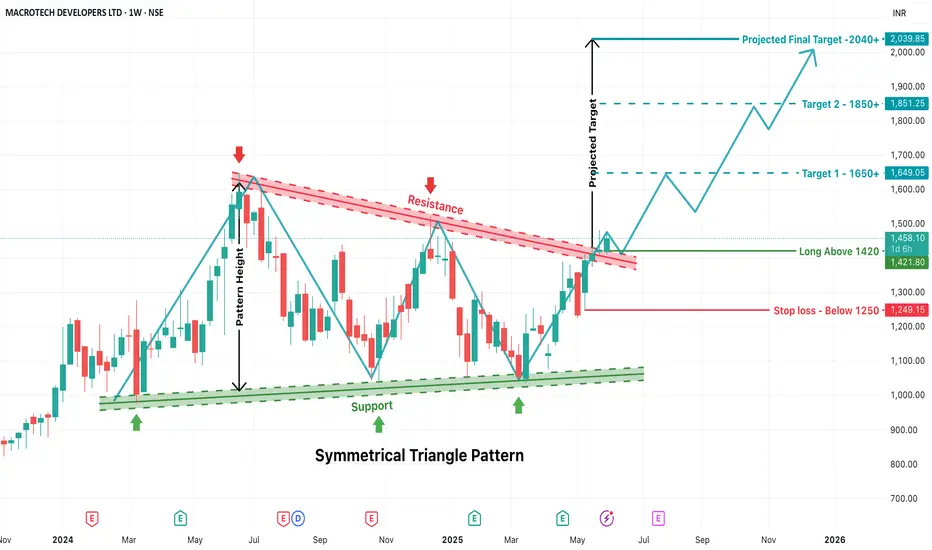
LODHA - Symmetrical Triangle Breakout Trade SetupAbout Pattern:
A Symmetrical Triangle Pattern is a continuation chart pattern formed when price action creates lower highs and higher lows, converging toward a point. It reflects indecision and compression in price before a breakout occurs. The breakout can be on either side, but here, a bullish breakout has occurred.
Support Line: Formed by connecting the swing lows (green arrows), which are gradually increasing.
Resistance Line: Formed by connecting the swing highs (red arrows), which are gradually decreasing.
This convergence of support and resistance forms the triangle.
Breakout Confirmation
Breakout Level: ₹1420
The stock has clearly broken out above the resistance trendline, indicating a strong bullish signal on the weekly timeframe.
Entry and Stop Loss Strategy
Entry Point: Enter the trade only above ₹1420 after confirmation of breakout. This acts as a psychological and technical barrier.
Stop Loss (SL): Set below ₹1250, which is well below the previous swing lows and triangle support. This acts as a safety net in case of a false breakout or reversal.
Target Calculation – Based on Pattern Height
Pattern Height:
Calculated from the highest swing high inside the triangle to the lowest swing low.
This vertical distance is then added to the breakout point (₹1420) to estimate the price targets.
Target 1: ₹1650+
This is the first resistance zone post-breakout and a psychologically important round number.
Target 2: ₹1850+
Based on the full extension of the pattern height and intermediate resistance zone.
Final Projected Target: ₹2040+
This is the complete projection of the triangle pattern height.
This setup is suitable for:
Swing traders looking for positional opportunities
Investors seeking breakout confirmation for fresh entries
Trend followers waiting for consolidation breakouts
Once price sustains above ₹1420, the stock is expected to follow a bullish trajectory toward ₹1650–2040+ over the coming weeks/months.
OptionsMastery: Inverse head and shoulders on UAL! 🔉Sound on!🔉
📣Make sure to watch fullscreen!📣
Thank you as always for watching my videos. I hope that you learned something very educational! Please feel free to like, share, and comment on this post. Remember only risk what you are willing to lose. Trading is very risky but it can change your life!

Nasdaq - The final bullrun breakout!Nasdaq - TVC:NDQ - might break above all structure:
(click chart above to see the in depth analysis👆🏻)
It is quite incredible how volatile stocks have been lately, especially considering that fact that the Nasdaq is about to create new all time highs again. Consequently, we are about to witness a significant structure breakout, which would ultimately lead to another rally of about +30%.
Levels to watch: $21.000
Keep your long term vision!
Philip (BasicTrading)

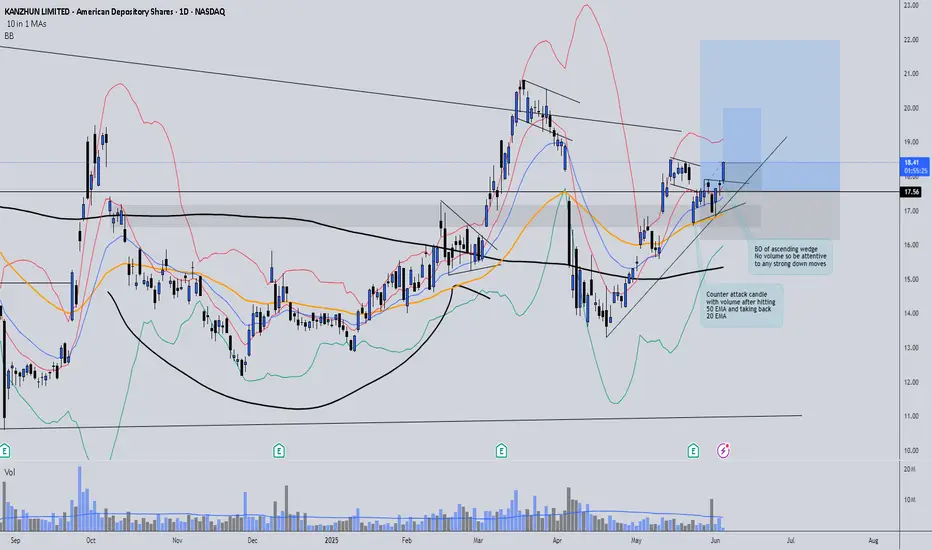
BZ BO of ascending wedgeBZ Trade Update 📈
BZ has shown strong bullish behavior after bouncing off a key support level. It has now broken out of an ascending wedge formation, offering another solid entry opportunity.
I've entered a second position and adjusted risk management accordingly:
✅ SL of the first trade moved to breakeven (BE)
✅ New SL set 1% below the second entry candle
Now it's a matter of patience and discipline, letting the trade play out while following the plan.
Stay consistent and trust your process! 💪
Ethereum - The most important analysis for 2025!Ethereum - CRYPTO:ETHUSD - is clearly shifting bullish:
(click chart above to see the in depth analysis👆🏻)
After four years of trading, Ethereum is now sitting at the exact same level compared to mid 2021. However, Ethereum has been creating a significant triangle pattern and with the recent bullish price action, a breakout becomes more and more likely. Then, the sky is the limit.
Levels to watch: $4.000
Keep your long term vision!
Philip (BasicTrading)

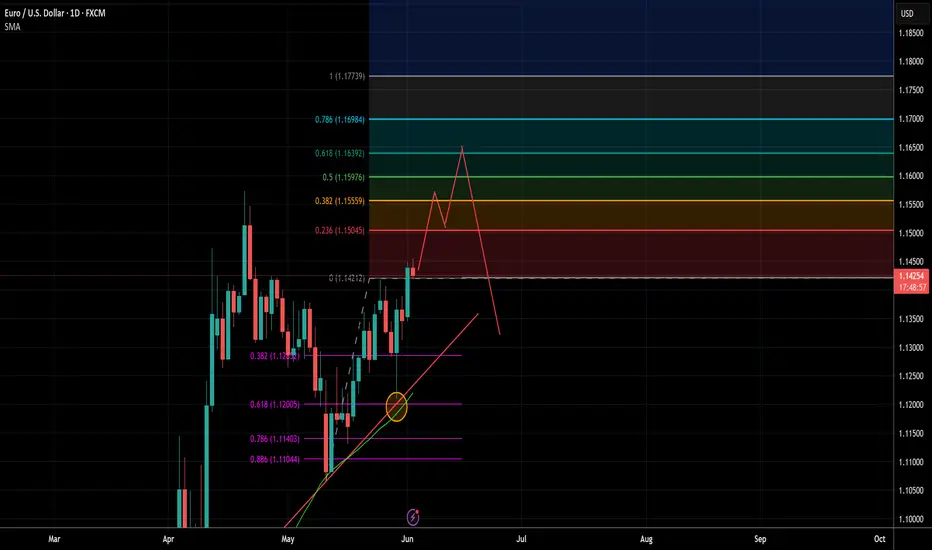
EURUSD: Rise Ahead! 🇪🇺🇺🇸
EURUSD successfully violated a significant horizontal supply area yesterday.
The broken structure and a rising trend line compose a contracting demand zone now.
It will be the area from where I will expect a rise to higher level.
The next strong resistance is 1.151
❤️Please, support my work with like, thank you!❤️
I am part of Trade Nation's Influencer program and receive a monthly fee for using their TradingView charts in my analysis.

USDCHF: Important Breakout 🇺🇸🇨🇭
USDCHF broke and closed below a neckline of a huge
head and shoulders pattern on a daily time frame.
It turned into a strong resistance cluster now.
I believe that the price will drop to that at least to 0.81 support.
❤️Please, support my work with like, thank you!❤️
I am part of Trade Nation's Influencer program and receive a monthly fee for using their TradingView charts in my analysis.

EURUSD - Swing Short Potential OpportunityEURUSD may potentially retest the previous high and trade between fib extension levels 38.2% and then range potentially in that level before pushing higher to the 61.8% extension level retesting and breaking out for a liquidity grab and stop hunt for retails before pushing back down trending back to the mean and retesting previous floor. The 1.1550 & 1.1650 are key historic levels where there has been lots of EURUSD previous action. Expect price to bounce around these areas and trap longs what I think has a high probability of happening per my prediction.