SKYGOLDLooks good on Chart.
Breakout Visible.
Above all key EMA.
Good for Short Term.
Target 410,500.
Do Like ,Comment , Follow for regular Updates...
Keep Learning ,Keep Earning...
Disclaimer : This is not a Buy or Sell recommendation. I am not SEBI Registered. Please consult your financial advisor before making any investments . This is for Educational purpose only.
Swingtrading

EUR/USD Hints At Swing LowA small doji formed on Wednesday, snapping a three-day losing streak for EUR/USD. The session low respected the 100-day EMA as support, while the brief dip below the monthly S1 pivot proved to be a false break.
The bias remains bullish while prices hold above the 1.1544 swing low. Bulls could look to buy dips towards the monthly S1 pivot in anticipation of a move up towards the 1.17 handle and monthly pivot point (1.1754).
Matt Simpson, Market Analyst at City Index and Forex.com

UPS Swing Long 1H Conservative Trend TradeConservative Trend Trade
+ long impulse
- supporting reaction bar
+ support zone
+ 1/2 correction
+ biggest volume Sp
Calculated affordable virtual stop loss
1 to 2 R/R take profit
Daily Trend
+ long impulse
= neutral zone"
Monthly CounterTrend
"+ short impulse
+ biggest volume T1
+ support zone
+ biggest volume manipulation bar
- one bar reversal?"
Yearly trend
"+ long impulse
+ 1/2 correction
+ T2 level
+ support zone
+ biggest volume manipulation bar"

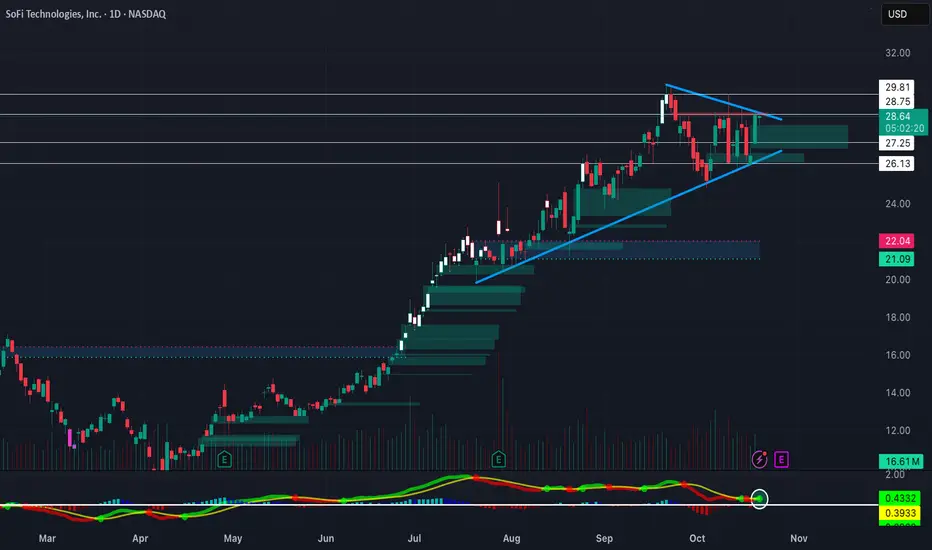
Triangle Break Heading into EarningsNASDAQ:SOFI Forming a big symmetrical triangle on the daily timeframe heading into earnings. EMA's are starting to curl upwards after NASDAQ:SOFI found some support on its 50-day SMA. Bullish long-term on NASDAQ:SOFI , so definitely will be watching this one closely
EURNZD trend breakout and start of correctionEURNZD has broken below the ascending channel and confirmed the breakout under 2.0350. This indicates the start of a corrective phase. Downside targets are 2.0190, 2.0020, and 1.9860. As long as the price stays below the confirmation zone, sellers dominate the market. A return above 2.0370 would cancel the bearish outlook and restore the upward trend.
The New Zealand dollar remains supported by stable macroeconomic data and expectations that the RBNZ will maintain tight policy longer than the ECB. Meanwhile, the euro faces pressure from weak industrial performance and sluggish recovery across the eurozone. These factors favor further downside for EURNZD.
Following the breakout and confirmation, EURNZD is likely to continue its correction. As long as the price remains below 2.0350, the bias stays bearish with targets at 2.0190, 2.0020, and 1.9860.

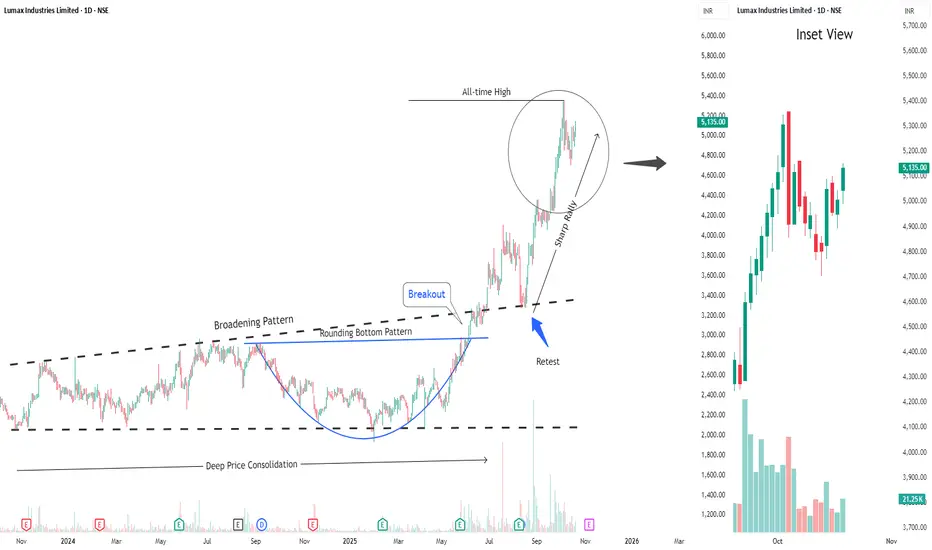
Buy Lumax IndustriesShort Term Trading Advice by Goodluck Capital
Buy Lumax Industries
● Buy Range- 5050 - 5150
● Target- 5350 - 5450
● StopLoss- below 4850
● Upside Potential- 5% -7%
● Approx trade duration 12 - 14 days
Technical Outlook for USD Index, EUR/USD, GBP/USDWhile my bias for the US dollar index remains bearish on the higher timeframes, a near-term bullish setup may have emerged. And that could see a pullback on EUR/USD and possible GBP/USD.
Matt Simpson, Market Analyst at City Index and Forex.com.

1.40 Appears Pivotal For USD/CADUSD/CAD remains in an established uptrend on the daily chart, although momentum showed signs of turning lower on Friday. Still, the 1.40 handle and monthly R1 pivot sit close by as a key support zone, making this area pivotal for both bulls and bears in the near term.
If the support zone holds, the bias favours a move toward 1.41, near the monthly R2 pivot. However, a break below 1.40 would shift focus to the high-volume node (HVN) at 1.3948, where bears may look to extend downside pressure. Given the prevailing uptrend, bulls may continue to watch for evidence of a swing low before re-entering.
Matt Simpson, Market Analyst at City Index and Forex.com

GBP/CAD Looks Set To Mean RevertA two-bar bearish reversal pattern (dark cloud cover) has formed around the monthly D1 pivot, suggesting that momentum could temporarily shift lower. Bears may look to fade retracements within the reversal zone and maintain a short-term bearish bias while prices remain below last week’s high.
The 20-day EMA, 50-day EMA, and monthly pivot point could serve as downside targets for bears — or potential swing-low zones for bulls to monitor.
A break below 1.8550 would signal a deeper correction or potentially a trend reversal in progress.
Matt Simpson, Market Analyst at City Index and Forex.com

Is Restaurant Brands International Burger King stock a buy?Burger King (QSR): Weekly Demand Gaining Strength
Now let’s look at Restaurant Brands International (QSR) — the powerhouse that owns Burger King, Popeyes, Tim Hortons, and Firehouse Subs. QSR has a weekly demand level in control around $63, which has recently produced a strong bullish impulse in the smaller timeframes.
That tells us demand is stepping in — no question about it. However, there’s a difference between having a weekly imbalance and having a monthly one. The weekly demand is shorter-term. It can create powerful moves, but it doesn’t hold the same institutional weight as a monthly imbalance.
Weekly demand means swing traders and shorter-term investors are active, while monthly imbalances indicate long-term capital allocation. So even though QSR looks healthy in the short term, its control zone sits one timeframe below McDonald’s, which automatically makes MCD the stronger and safer play from a structural perspective.

McDonald's stock monthly demand imbalance playing outMcDonald’s (MCD): Monthly Demand Level Still in Control
McDonald’s stock is currently respecting a monthly demand level at $294, which remains firmly in control. That’s a key point — the monthly timeframe is a much larger and more powerful structure than anything happening in the weekly or daily charts.
What I’m seeing now is a new bullish price action pattern forming in the smaller timeframes (weekly and daily), meaning buyers are stepping back in from that institutional zone. That gives me confirmation that demand is in control and that McDonald’s remains one of the strongest bullish stocks in the consumer sector.
A monthly demand level in control means that big money — institutions and funds — are accumulating. Retail traders might think it’s “too expensive” at $290+, but professional traders know that the presence of a monthly imbalance means there’s still room for price expansion to the upside.
This is where patience pays. The art of waiting for the price to return to that imbalance and observing how it reacts separates a disciplined trader from an impulsive one driven by greed or fear.

Data Patterns – Absorption Phase Near Trendline ResistanceData Patterns (India) Ltd – Absorption Phase Near Trendline Resistance
NSE:DATAPATTNS
📈 Pattern & Setup:
Data Patterns is floating right below a crucial descending trendline resistance, showing classic signs of absorption after two consecutive shakeouts. Each shakeout was followed by a recovery with narrowing volatility, suggesting strong hands quietly building positions beneath the surface.
The stock has also formed a “Bull Snort” setup — a rare occurrence where the price absorbs supply near resistance instead of rejecting it. This indicates institutional accumulation and prepares the ground for a clean breakout move.
A close above 2,850–2,860 with strong volume could confirm the breakout, unlocking a potential move toward 3,800+.
📝 Trade Plan:
✍Entry: Above 2,860 (breakout confirmation)
🚩Stop-Loss: 2,700 (below the absorption low)
🎯Targets:
Target 1 → 3,250
Target 2 → 3,800 (38% potential move)
💡 Pyramiding Strategy:
1. Enter 60% above 2,860 on breakout confirmation
2. Add remaining 40% above 2,900 with volume follow-through
3. Trail stop-loss to 2,780 once price crosses 3,100
🧠 Logic Behind Selecting this Trade:
The combination of back-to-back shakeouts, higher lows, and visible absorption reflects smart money activity. The stock’s ability to hold near resistance instead of falling back confirms strength. This kind of coiling price action just below a trendline often leads to a powerful breakout rally once supply is fully absorbed.
Keep Learning. Keep Earning.
Let’s grow together 📚🎯
🔴Disclaimer:
This analysis is for educational purposes only. Not a buy/sell recommendation. Please do your own research or consult your financial advisor before trading.

Asahi India Glass Limited chart analysisEntry: ₹941-945 (Current Level)
Target 1: ₹971-975
Target 2: ₹988-995
Target 3: ₹1,020+ (Extended)
Stop Loss: ₹925
Technical Rationale:
Powerful breakout from prolonged consolidation (870-940)
Strong bullish momentum with +3.02% gain today
Massive volume spike (441.46K) - significantly above average
RSI trending upward near 60, showing strong momentum
Price breaking above key resistance at 931-940 zone
Fresh 52-week high territory - no overhead resistance
Auto sector tailwinds supporting glass demand
Clear support established at breakout level (931)
Risk-Reward: Excellent 1:3+ ratio
Strategy: Momentum breakout play - Book 30% at Target 1, 30% at Target 2, trail remaining with SL at 960 after T1
Key Levels to Watch:
Support: 931, 920
Resistance: 971, 988, 1,000 (psychological)

AUDCAD: Wait for the Close – 0.9130 vs 0.9057AUDCAD is sitting at a make-or-break spot. It’s been climbing in a 4H channel but just topped out and pulled back to support. I won’t guess mid-range—I'll trade the break:
Bull: H4 candle closes above 0.9130 → room toward 0.9165/0.9180, then 0.9230–0.9250.
Bear: H4 candle closes below 0.9057 → opens 0.9000, then 0.8950–0.8920.
I prefer a close and quick retest/hold for confirmation. Watch AUD/CAD news and oil (for CAD).

HealthCare Global Enterprises Ltd. BUY SetupEntry: ₹709-712 (Current Level)
Target 1: ₹723-725
Target 2: ₹737-740
Target 3: ₹755-760 (Extended)
Stop Loss: ₹690

Oberoi Realty Limited chart analysis: BUY SetupEntry: ₹1,687-1,695 (Current Level)
Target 1: ₹1,722-1,725
Target 2: ₹1,754-1,760
Target 3: ₹1,800+ (Extended)
Stop Loss: ₹1,650
Technical Rationale:
Massive bullish momentum with +5.35% surge today
Strong breakout from consolidation zone (1,600-1,690)
Huge volume spike (2.61M) - highest in recent months
RSI spiking above 60, indicating strong bullish momentum
Price breaking above long-term resistance at 1,680
Gap-up opening showing institutional interest
Real estate sector showing strength
Clear resistance levels at 1,722 and 1,754
Risk-Reward: Favorable 1:2.5+ ratio
Strategy: Momentum play - Book partial at Target 1 (1,722), trail SL to 1,670 at Target 2. Hold remaining for extended targets
Caution: Watch for profit booking after such strong rally. Avoid chasing if price goes significantly above 1,700

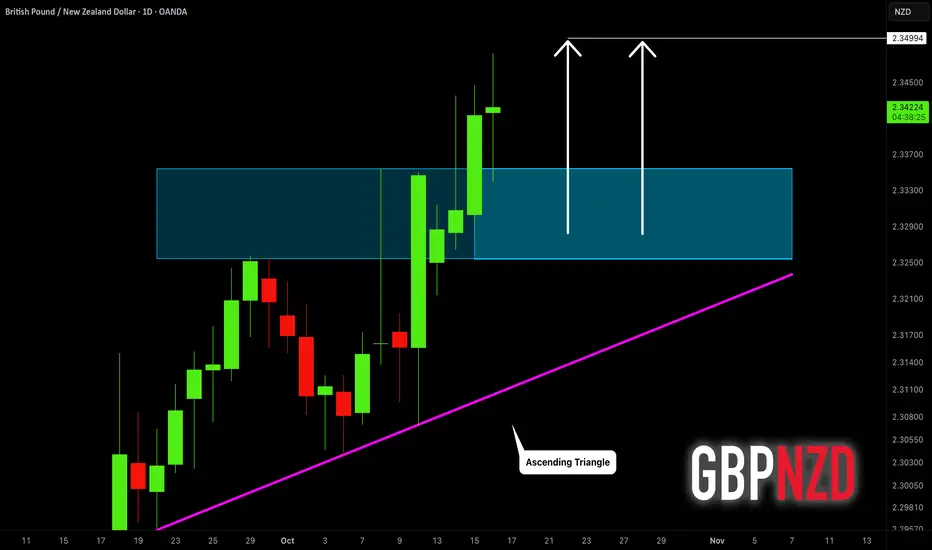
GBPNZD: Bull Run Continues 🇬🇧🇳🇿
GBPNZD will likely grow more following a confirmed
breakout of a resistance of an ascending triangle pattern on a daily.
Next resistance is 2.35
❤️Please, support my work with like, thank you!❤️
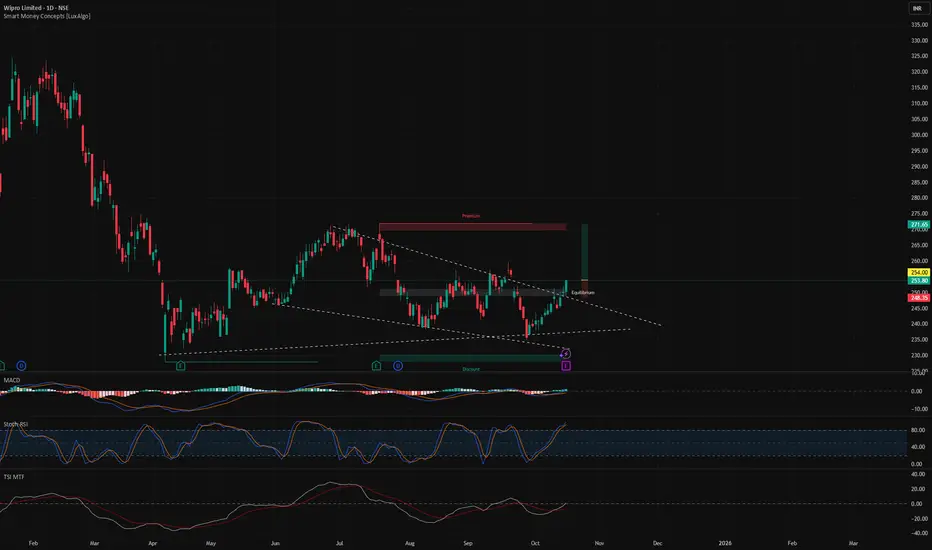
Breakout in WIPROBreakout in WIPRO.
Entry - 254
Targets - 270, 285 & 310
SL - 248
DISCLAIMER: I am not SEBI registered and the ideas posted are only for educational purpose. Do a proper analysis and always trade with STOP LOSS.
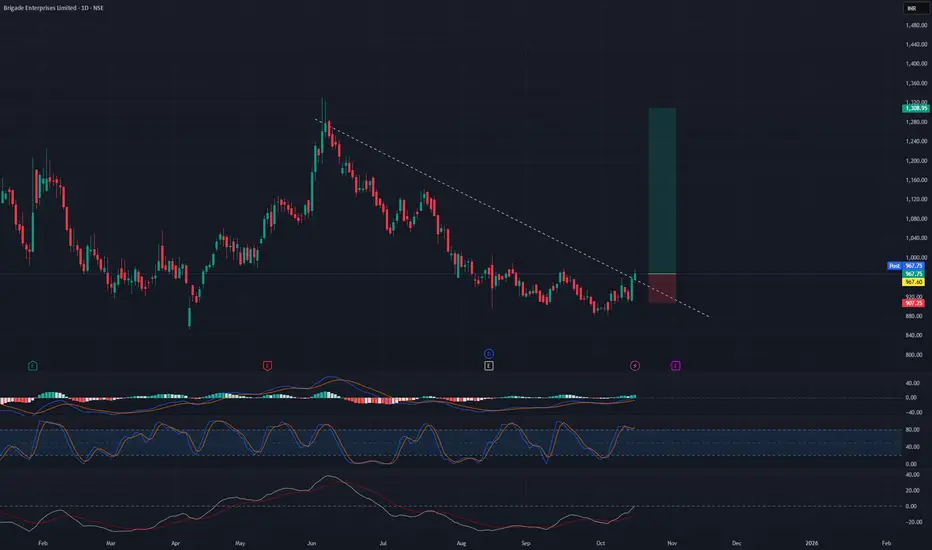
Breakout trading in BRIGADESwing trading opportunity in BRIGADE.
Entry - 970
Targets - 1130 & 1300
SL - 904
DISCLAIMER: I am not SEBI registered and the ideas posted are only for educational purpose. Do a proper analysis and always trade with STOP LOSS.
EURNZD: High Growth Potential 🇪🇺🇳🇿
EURNZD broke and closed above a significant daily
structure resistance, updating a Higher High.
It suggests a highly probable bullish trend continuation after a pullback.
Next resistance - 2.043
❤️Please, support my work with like, thank you!❤️
I am part of Trade Nation's Influencer program and receive a monthly fee for using their TradingView charts in my analysis.

AUD/JPY: Potential Bounce Before Bears Regain ControlAUD/JPY pulled back around 3.1% from its recent high just below the 101 handle, but price has since held above 97.85, showing early signs of near-term strength. A small spinning-top doji formed near the lower end of the range, hinting that dip buyers are starting to step in.
On the 1-hour chart, AUD/JPY has carved out three consecutive higher lows, the most recent appearing as a bullish hammer.
For now, the bias leans toward a minor leg higher before another downside attempt. Key resistance sits between 99.00–100.00, while bears will be watching for a break below 97.85 to target the 97.00 handle and possibly the 96.32 low.
Matt Simpson, Market Analyst at City Index and Forex.com

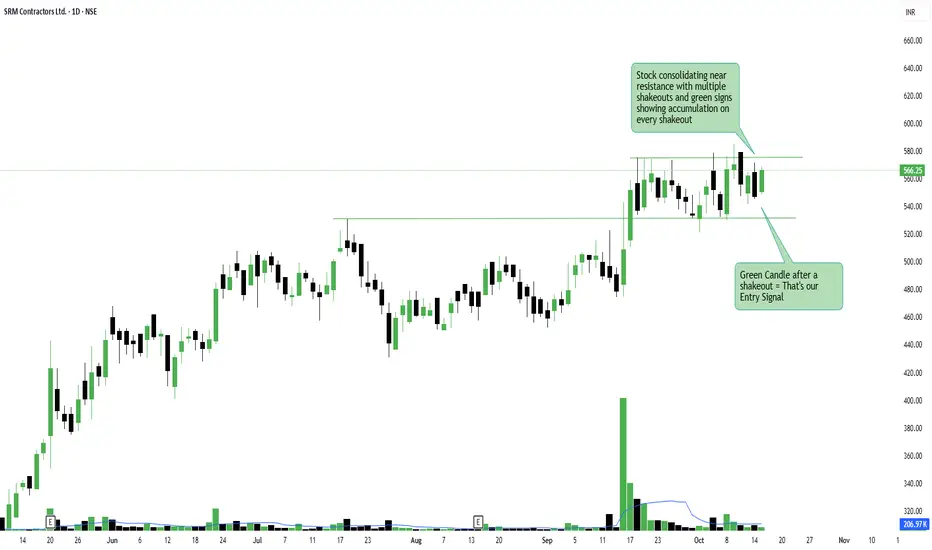
SRM Contractors Ltd – Shakeout-to-Breakout SetupSRM Contractors Ltd – Shakeout-to-Breakout Setup
NSE:SRM
📈 Pattern & Setup:
SRM Contractors is consolidating just below its key resistance around 570 after multiple shakeouts. Each shakeout has been followed by strong green candles and volume spikes — a clear indication of smart money quietly accumulating.
The recent green triangle right after a shakeout marks a potential entry signal, showing that buyers are absorbing every dip near support. The structure is forming a tight range between 540–570, and a breakout above 575 could trigger a new leg of rally continuation.
📝 Trade Plan:
✍Entry: Above 575 (breakout confirmation)
🚩Stop-Loss: 540 (below the latest shakeout low)
🎯Targets:
Target 1 → 610
Target 2 → 648 (13% potential move)
💡 Pyramiding Strategy:
1. Enter with 60% position above 575
2. Add 40% once the stock sustains above 590 with strong volume
3. Trail stop-loss to 555 once price crosses 600
🧠 Logic Behind Selecting this Trade:
This setup fits perfectly into the “shakeout-to-breakout” pattern — a reliable sign of institutional accumulation. Repeated rejections followed by higher lows are signs of pressure building near resistance. With volume steadily improving and market structure tightening, a clean breakout could be imminent.
Keep Learning. Keep Earning.
Let’s grow together 📚🎯
🔴Disclaimer:
This analysis is for educational purposes only. Not a buy/sell recommendation. Please do your own research or consult your financial advisor before trading.
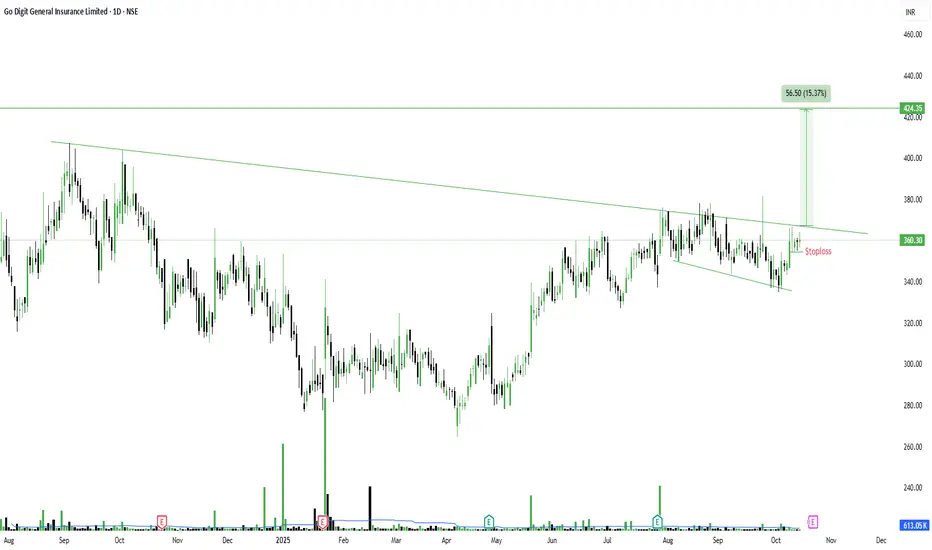
Go Digit - Descending Channel Breakout SetupGo Digit General Insurance Ltd – Descending Channel Breakout Setup
NSE:GODIGIT
📈 Pattern & Setup:
Go Digit is showing signs of a potential breakout from a long-term descending channel. After multiple shakeouts and pullbacks near the lower trendline, the stock has now reclaimed higher ground, moving closer to the upper boundary around 362–365.
The repeated pullbacks with strong recoveries highlight steady accumulation by smart money. Price compression within this narrowing channel is indicating that supply is drying up. A strong breakout above 368–370 with volume could confirm the start of a fresh rally toward 420+.
📝 Trade Plan:
✍Entry: Above 370 (breakout confirmation)
🚩Stop-Loss: 345 (below the recent higher low)
🎯Targets:
Target 1 → 395
Target 2 → 424 (15% potential move)
💡 Pyramiding Strategy:
1. Enter 60% above 370
2. Add remaining 40% once price sustains above 380 with heavy volume
3. Trail stop-loss to 355 once the price crosses 390
🧠 Logic Behind Selecting this Trade:
The price action structure suggests that sellers are gradually losing control while buyers are stepping in near support. The consistent pattern of pullbacks followed by rebounds shows quiet institutional activity. A confirmed breakout from the channel could trigger a sustained move as trapped sellers start covering.
Keep Learning. Keep Earning.
Let’s grow together 📚🎯
🔴Disclaimer:
This analysis is for educational purposes only. Not a buy/sell recommendation. Please do your own research or consult your financial advisor before trading.