USDCHF DAILY CHART LONGUSDCHF is currently trading within a clear buy zone, having completed a 100% measured move from the previous downside breakout. This suggests a full exhaustion of the short-side move, making it an ideal area for profit-taking by sellers and potential long entries on the trendline. Additionally, long positions benefit from positive swap, providing a yield advantage while holding the trade.
Swissfranc

USDCHF Oversold and approaching an 11-year Low.The USDCHF pair has been trading within a Channel Down since its November 2022 High rejection on the 1M MA200 (orange trend-line). This month isn't only approaching the bottom of that pattern but also Support 1, which consists of the January 2015 Low (0.74250).
With the 1M RSI almost oversold and similar to December 2020 (every oversold 1M RSI has historically been a massive long-term buy signal), we don't technically believe that this decline has much more room to extend to, beyond at least the -17.86% of the previous Bearish Leg.
Instead, we treat this as an excellent long-term buy opportunity, with a first Target on the 0.5 Fibonacci retracement level (again similar as the previous Channel Down rebound) at 0.83450. Note that this is more suited to long-term investors and not shorter term traders.
---
** Please LIKE 👍, FOLLOW ✅, SHARE 🙌 and COMMENT ✍ if you enjoy this idea! Also share your ideas and charts in the comments section below! This is best way to keep it relevant, support us, keep the content here free and allow the idea to reach as many people as possible. **
---
💸💸💸💸💸💸
👇 👇 👇 👇 👇 👇

GBPCHF BuyHello traders, I found out this setup. A good bullish flag pattern is formed. I see potential for surge for this pair.

USDCHF Short-term bullish + potential break-out.Early this month (January 08, see chart below) we gave a strong buy signal on the USDCHF pair, which shortly after hit our 0.80350 Target:
As it got rejected just below the 1D MA200 (orange trend-line), the price pulled back to the 7-month Support Zone and turned into a buy opportunity again.
Now, we have Target 1 at 0.80100, just below the Inner Lower Highs trend-line. If we close a 1D candle above that as well, re-buy with Target 2 at 0.80650 (Fibonacci 0.786) just below the Lower Highs trend-line.
---
** Please LIKE 👍, FOLLOW ✅, SHARE 🙌 and COMMENT ✍ if you enjoy this idea! Also share your ideas and charts in the comments section below! This is best way to keep it relevant, support us, keep the content here free and allow the idea to reach as many people as possible. **
---
💸💸💸💸💸💸
👇 👇 👇 👇 👇 👇

USDCHF Moment of truth on the 1D MA200 is coming.The USDCHF pair is on a strong rise since its December 26 2025 Low, which is technically the Bullish Leg of the long-term Descending Triangle. Today it is testing the 1D MA50 (blue trend-line) and if broken, will be the perfect buy continuation signal.
If it breaks, buy and target a potential 1D MA200 (orange trend-line) test at 0.80350. This will be the market's most important test for 2026 as the 1D MA200 has been untouched since April 03 2025.
If it breaks, the long-term trend most likely shifts to bullish, but even on the short-term we can again engage into a quick buy, targeting the top (Lower Highs trend-line) of the Descending Triangle at 0.80650, which is also the 0.786 Fibonacci retracement level (where the previous Lower High was priced).
---
** Please LIKE 👍, FOLLOW ✅, SHARE 🙌 and COMMENT ✍ if you enjoy this idea! Also share your ideas and charts in the comments section below! This is best way to keep it relevant, support us, keep the content here free and allow the idea to reach as many people as possible. **
---
💸💸💸💸💸💸
👇 👇 👇 👇 👇 👇

Bullish Setup on USDCHFThrowing some ideas on USDCHF, price could come back test this zone, and go from there

Final Target yet to be run on CHFJPYThis inverse Head and shoulders has produced fantastic gains already
What suggests that final target will be met
is that Yen vs other crosses is still yet trigger their respective necklines!
I assume more madness to come from the #BOJ in the next Financial Panic.
Like the Bank of England another Island nation probably first to embark on a new wave of #QuantitativeEasing

Swiss Franc: Approaching Key ER SupportThe Swiss franc is now testing the lower boundary of the Expected Range (ER) — a zone for potential pause or bounce.
Also
this ER level aligns perfectly with a visible liquidity cluster (marked with arrow) .
📌 In other words:
It's not only a statistical support — it’s a confluence = higher probability reaction.

Weekly FOREX Forecast: USDCAD, USDCHF & USDJPY Are Bullish!Welcome to Part 2 of The Weekly FOREX FORECAST!
Part 1 covered USD, EU, GU, AU, NU in the previous video.
In this video, we will analyze the following FX markets:
USD Index, USDCAD, USDCHF, and USDJPY.
Enjoy!
May profits be upon you.
Leave any questions or comments in the comment section.
I appreciate any feedback from my viewers!
Like and/or subscribe if you want more accurate analysis.
Thank you so much!
Disclaimer:
I do not provide personal investment advice and I am not a qualified licensed investment advisor.
All information found here, including any ideas, opinions, views, predictions, forecasts, commentaries, suggestions, expressed or implied herein, are for informational, entertainment or educational purposes only and should not be construed as personal investment advice. While the information provided is believed to be accurate, it may include errors or inaccuracies.
I will not and cannot be held liable for any actions you take as a result of anything you read here.
Conduct your own due diligence, or consult a licensed financial advisor or broker before making any and all investment decisions. Any investments, trades, speculations, or decisions made on the basis of any information found on this channel, expressed or implied herein, are committed at your own risk, financial or otherwise.

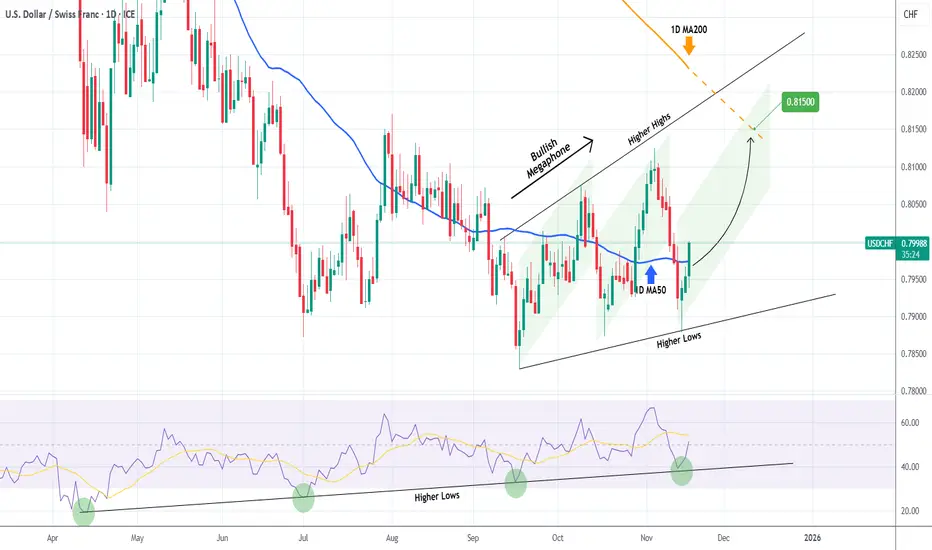
USDCHF Megaphone started its new Bullish Leg.The USDCHF pair has been trading within a 2-month Bullish Megaphone that was initiated after the huge 1D RSI Bullish Divergence of Higher Lows caused a market bottom in September and the price flipped the Lower Lows to Higher Lows and started rising.
Having broken above its 1D MA50 (blue trend-line) today, the new Bullish Leg has been confirmed and we expect it to make contact with the 1D MA200 (orange trend-line) around 0.81500.
---
** Please LIKE 👍, FOLLOW ✅, SHARE 🙌 and COMMENT ✍ if you enjoy this idea! Also share your ideas and charts in the comments section below! This is best way to keep it relevant, support us, keep the content here free and allow the idea to reach as many people as possible. **
---
💸💸💸💸💸💸
👇 👇 👇 👇 👇 👇
JP Morgan says EURCHF oversold --- Could target 0.96 on rebound?JP Morgan sees the surge in the Swiss franc as not justified. According to JP Morgan, the Eurozone economy is holding up better than markets had anticipated. Under this environment, JP Morgan believes the current EUR/CHF levels present an opportunity to fade franc strength and rebuild long positions.
If the pair does rebound from current levels, the first area of interest could be 0.9350, followed by 0.9450, where prior swing highs and short-term structure converge. A more sustained recovery could bring the pair back toward 0.9600–0.9700, a major resistance band that has capped every rally over the past year.

CHFJPY 9-month Channel Up looking for a pull-back.The CHFJPY pair has been trading within a 9-month Channel Up with the current Bullish Leg approaching its Top (Higher Highs trend-line).
Given that with its +7.77% rise it has already marginally exceeded the maximum Bullish Leg extension within this pattern, we expect a technical pull-back (Bearish Leg) to start now given that the 1D RSI turned overbought (above 70.00).
Both previous Bearish Legs declined by -2.45%, testing the 1D MA50 (blue trend-line). As a result, our short-term Target here is 191.000.
---
** Please LIKE 👍, FOLLOW ✅, SHARE 🙌 and COMMENT ✍ if you enjoy this idea! Also share your ideas and charts in the comments section below! This is best way to keep it relevant, support us, keep the content here free and allow the idea to reach as many people as possible. **
---
💸💸💸💸💸💸
👇 👇 👇 👇 👇 👇

GBPCHF - APPROACHES KEY DEMAND ZONESymbol - GBPCHF
GBPCHF continues to correct, forming lower-lows amid ongoing macroeconomic uncertainty and US policy concerns. The currency pair remains within a bearish structure, yet it is now approaching a critical demand zone located near 1.0555 – 1.0530, where a potential reaction from buyers could emerge.
Despite the prevailing downside momentum, the pair is entering a zone of interest that may attract bullish activity. If the bulls succeed in defending this demand zone, a notable reversal from these levels could follow.
Resistance levels: 1.0560, 1.0535
Support levels: 1.0600, 1.0647, 1.0685
If the price fails to hold above the current support and liquidity zone highlighted in the chart, another wave of selling could develop. Although, given the existing market context, the probability of a deeper decline appears limited.

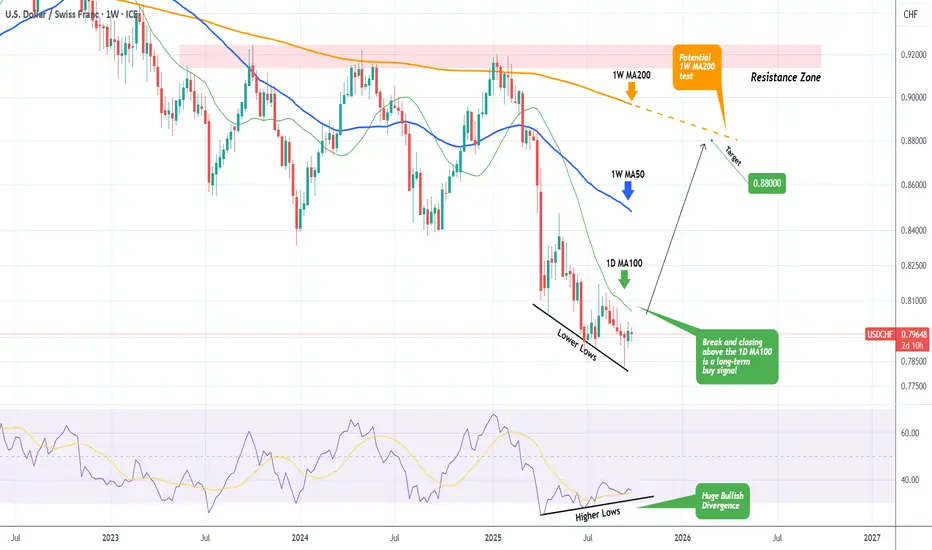
USDCHF Perhaps the best buy opportunity in the market!The USDCHF pair is staging a strong bullish reversal following last week's 1W candle closing above the 1D MA100 (red trend-line). The reason is that every time in the past 3 years (since November 07 2022) the price broke and closed a week above that level, the pair rallied towards the 1W MA200 (orange trend-line).
This time is doing so also at the back of a huge 1W RSI Bullish Divergence of Higher Lows against the prices Lower Lows since April 2025.
We estimate that contact with the 1W MA200 can be achieved around $0.8800 and that is our long-term Target for USDCHF.
-------------------------------------------------------------------------------
** Please LIKE 👍, FOLLOW ✅, SHARE 🙌 and COMMENT ✍ if you enjoy this idea! Also share your ideas and charts in the comments section below! This is best way to keep it relevant, support us, keep the content here free and allow the idea to reach as many people as possible. **
-------------------------------------------------------------------------------
💸💸💸💸💸💸
👇 👇 👇 👇 👇 👇

USDCHF Break-out or rejection? How to trade each case.The USDCHF pair is about to hit the top (Lower Highs trend-line) of the 3-month Triangle pattern it's been trading in since the August 01 High.
If rejected, as long as the price is closing 1D candles below it, we expect a new Bearish Leg to start and target the 0.786 Fibonacci retracement level at 0.79100, like the previous one did.
If however it closes a 1D candle above the Triangle, there are strong probabilities for a new long-term Channel Up pattern to prevail. In that case, we expect the rally that has already started to complete a +3.15% move (similar to the previous Bullish Leg) and target 0.81200.
The fact that the price is so close to this break-out level (the top of the Triangle) favors the use of a tight SL strategy for the short in case of a reversal to long.
-------------------------------------------------------------------------------
** Please LIKE 👍, FOLLOW ✅, SHARE 🙌 and COMMENT ✍ if you enjoy this idea! Also share your ideas and charts in the comments section below! This is best way to keep it relevant, support us, keep the content here free and allow the idea to reach as many people as possible. **
-------------------------------------------------------------------------------
💸💸💸💸💸💸
👇 👇 👇 👇 👇 👇

Does US Tech Dominance Outweigh Dovish Fed Policy?The recent slight rise in the USD/CHF pair toward 0.7940 signals a crucial shift in favor of the US Dollar, despite immediate monetary headwinds. While the Federal Reserve is broadly expected to deliver a dovish 25 bps rate cut driven by cooling US inflation and a soft job market, the DXY remains resilient. This Dollar strength is not simply speculative; it highlights profound structural weakness in the Swiss Franc. The chronically negative Swiss ZEW Survey Expectations, which improved only marginally to -46.4 in September, point to persistent domestic economic pessimism, which significantly erodes the Franc's safe-haven appeal. This divergence of underlying economic health proves more influential than short-term rate expectations.
The influence of geopolitical and geostrategic risk further supports the US Dollar. Upcoming high-stakes discussions between the US and Chinese leaders on trade and technology issues, including tariffs and rare earth controls, inject uncertainty into global markets. When major power tensions escalate, the US Dollar automatically benefits from its unrivaled status as the world’s most dominant reserve currency. Capital rapidly flows from smaller, risk-exposed jurisdictions and into USD-denominated assets. This flight to the world's most liquid currency strengthens the Dollar against rivals like the Franc, which is typically a safe-haven but lacks the USD's depth and liquidity.
Crucially, the long-term upward trajectory of the USD/CHF is underpinned by US technological dominance. The United States leads decisively in high-tech sectors, particularly in AI and life sciences. This leadership, evidenced by robust patent analysis and significant private sector investment, guarantees a continuous inflow of global capital. Generative AI alone is projected to add trillions in annual economic value, primarily benefiting US-listed companies. This enduring, structural edge in high-tech and science creates a massive, consistent demand for US assets, systematically bolstering the Dollar's value and allowing it to outperform the Franc, regardless of short-term interest rate adjustments.
In summary, the USD/CHF gain is a complex interaction of factors. Although the Fed is expected to cut rates, a fundamentally weak Swiss economic outlook and immediate geopolitical risks drive capital to the superior stability of the Dollar. Ultimately, the US Dollar's strength derives from the unmatched geostrategic advantage of its reserve status and its sustained global leadership in technology and innovation. These long-term structural drivers decisively outweigh the immediate dovish signals from the Federal Reserve, positioning the USD for continued strength against the Franc.

USDCHF Huge Bullish Divergence like 2020.The USDCHF pair has recently broken above its 1D MA50 (red trend-line) for the first time since March 2025, following a long-term sharp decline. The multi-year pattern is a Channel Down and the current price action is taking place right on its bottom.
At the same time, while the price is on Lower Lows, the 1W RSI has been rising on Higher Lows, showcasing a huge Bullish Divergence. The last time we saw this happening at the bottom of this Channel Down, was between August - December 2020. That was the pattern's previous Lower Low bottom formation and after the 1D MA100 break-out took place, the pair started its new Bullish Leg that exceeded the 0.618 Fibonacci retracement level, while smashing through its 1W MA200 (orange trend-line).
As a result, we have turned bullish long-term on USDCHF, targeting the 0.618 Fib at 0.86750, expecting a contact with its 1W MA200 there.
-------------------------------------------------------------------------------
** Please LIKE 👍, FOLLOW ✅, SHARE 🙌 and COMMENT ✍ if you enjoy this idea! Also share your ideas and charts in the comments section below! This is best way to keep it relevant, support us, keep the content here free and allow the idea to reach as many people as possible. **
-------------------------------------------------------------------------------
💸💸💸💸💸💸
👇 👇 👇 👇 👇 👇

USDCHF 10-year support points to major breakdown to 0.70! USDCHF BREAKDOWN ALERT: Decade-long support shattered – here's why this could be the start of a major move to 0.70 and below!
The Dollar-Swiss Franc pair is setting up for a potentially significant breakdown after breaking decade-long support levels since May. Both fundamental and technical factors are aligning for Swiss franc strength, creating what could be a rare high-probability trading opportunity.
Key Drivers:
Fed Dovish Pivot: Powell's Tuesday signal acknowledged downside risks to job markets, with 97% probability of October rate cuts and two more by December fully priced in
Swiss Franc Strength: CHF has strengthened nearly 9% over the past 12 months, now testing the 0.78 level, while Trump's tariff escalation forces Switzerland to slash GDP forecasts
Technical Breakdown: Multiple analytical methods (range breakouts, Fibonacci projections, and triangle pattern analysis) all point to targets around 0.7417-0.6840, representing potential moves to levels not seen since 2011
SNB Constraints: The Swiss National Bank cannot intervene in forex markets while trade talks are ongoing, meaning the Franc is likely to stay strong by default, with stable inflation data
Don't miss this detailed technical and fundamental breakdown! Like and subscribe for more high-probability forex setups, and drop a comment below with your USD/CHF targets - are you seeing the same bearish signals?
This content is not directed to residents of the EU or UK. Any opinions, news, research, analyses, prices or other information contained on this website is provided as general market commentary and does not constitute investment advice. ThinkMarkets will not accept liability for any loss or damage including, without limitation, to any loss of profit which may arise directly or indirectly from use of or reliance on such information.

Bearish continuation setup?The Swissie (USD/CHF) is reacting off the pivot and could drop to the 1st support.
Pivot: 0.8039
1st Support: 0.7737
1st Resistance: 0.8199
Disclaimer:
The above opinions given constitute general market commentary, and do not constitute the opinion or advice of IC Markets or any form of personal or investment advice.
Any opinions, news, research, analyses, prices, other information, or links to third-party sites contained on this website are provided on an "as-is" basis, are intended only to be informative, is not an advice nor a recommendation, nor research, or a record of our trading prices, or an offer of, or solicitation for a transaction in any financial instrument and thus should not be treated as such. The information provided does not involve any specific investment objectives, financial situation and needs of any specific person who may receive it. Please be aware, that past performance is not a reliable indicator of future performance and/or results. Past Performance or Forward-looking scenarios based upon the reasonable beliefs of the third-party provider are not a guarantee of future performance. Actual results may differ materially from those anticipated in forward-looking or past performance statements. IC Markets makes no representation or warranty and assumes no liability as to the accuracy or completeness of the information provided, nor any loss arising from any investment based on a recommendation, forecast or any information supplied by any third-party.

USDCHF is about to enter a new multi-month Bull Cycle.The USDCHF pair has been under heavy pressure all year long since the January 13 2025 High rejection on its 2-year Resistance Zone.
However, for the first time in years, its 1W RSI is on Higher Lows against the price's Lower Lows since April, which is a massive Bullish Divergence. This is an occurrence that technically emerges on market bottoms and is a huge Buy Signal.
Our confirmation signal will be once the price breaks above its shorter term 1D MA100 (green trend-line), which has been intact as a Resistance since March 03. If broken, we will target a potential 1W MA200 (orange trend-line) test at 0.88000. The 1W MA200 is critical as a Resistance because it has formed the last 4 massive High rejections since February 27 2023.
-------------------------------------------------------------------------------
** Please LIKE 👍, FOLLOW ✅, SHARE 🙌 and COMMENT ✍ if you enjoy this idea! Also share your ideas and charts in the comments section below! This is best way to keep it relevant, support us, keep the content here free and allow the idea to reach as many people as possible. **
-------------------------------------------------------------------------------
💸💸💸💸💸💸
👇 👇 👇 👇 👇 👇
Market Analysis: USD/CHF Corrects LowerMarket Analysis: USD/CHF Corrects Lower
USD/CHF declined from 0.8000 and is now struggling to stay above 0.7945.
Important Takeaways for USD/CHF Analysis Today
- USD/CHF declined below the 0.7985 and 0.7965 support levels.
- There is a major bearish trend line forming with resistance near 0.7965 on the hourly chart.
USD/CHF Technical Analysis
On the hourly chart of USD/CHF, the pair started a fresh decline after it failed to stay above 0.8000. The US Dollar dropped below 0.7985 to move into a negative zone against the Swiss Franc.
There was a move below the 50% Fib retracement level of the upward move from the 0.7902 swing low to the 0.8014 high. The bears pushed the pair below the 50-hour simple moving average and 0.7965.
Finally, the pair tested the 61.8% Fib retracement at 0.7945. It is now consolidating losses and facing resistance near the 50-hour simple moving average and a major bearish trend line at 0.7965. A clear move above the trend line could send the pair to 0.7985.
The next major barrier for the bulls might be 0.8015, above which the pair could test the 0.8050 level. If there is a clear break above 0.8050, the pair could start another increase. In the stated case, it could even surpass 0.8100.
On the downside, immediate support on the USD/CHF chart is 0.7945. The first major area of interest could be 0.7925. Any more losses may possibly open the path for a move toward the 0.7900 level in the coming sessions.
This article represents the opinion of the Companies operating under the FXOpen brand only. It is not to be construed as an offer, solicitation, or recommendation with respect to products and services provided by the Companies operating under the FXOpen brand, nor is it to be considered financial advice.

SHORT ON USD/CHFUSD/CHF is pulling back to a major supply area/zone
News today for the dollar (PCE) will most likely push price into these zone before dropping.
If news for the dollar comes out negative we might see a drop without the rise to supply.
But its always better to SELL HIGH so set sell limit orders in these zones to take full advantage.
150-200 pips on the table.
Enjoy!

USD/CHF Holds Steady Following Central Bank DecisionUSD/CHF Holds Steady Following Central Bank Decision
Today, the Swiss National Bank (SNB) decided to keep its interest rate unchanged at zero, in line with analysts’ expectations.
Notably:
→ The SNB’s interest rate remains arguably the lowest among central banks of developed economies;
→ According to official statements, the main obstacle to Swiss economic growth is Trump’s tariffs.
Technical Analysis of the USD/CHF Chart
In 2025, the Swiss franc strengthened — which is unsurprising given the high demand for safe‑haven assets (as evidenced by gold’s record high) amid rising geopolitical and macroeconomic risks. At the same time, lower highs and lows have allowed the construction of a descending channel on the USD/CHF chart (shown in red).
However, a closer look at recent price dynamics suggests there are grounds to believe that the downtrend may be coming to an end. Why?
Firstly, the price is holding in the upper half of the channel, indicating insufficient selling pressure.
Secondly, consider the strength of the 0.7900 support level. In July, it prevented the market from falling further after the breach of the 0.8080 support level, and it continues to hold in September — note the price behaviour indicated by the arrow:
→ A bearish breakout attempt failed. After a brief dip below 0.7900, the price confidently returned above this level.
→ The median of the descending channel acted as support, and the chart shows lows that exhibit signs of an Inverse Head and Shoulders pattern.
This suggests that:
→ The current red channel may be broken in the near term, potentially driven by factors supporting USD strength;
→ There may be a bullish attempt to establish a rally, with targets indicated in blue.
This article represents the opinion of the Companies operating under the FXOpen brand only. It is not to be construed as an offer, solicitation, or recommendation with respect to products and services provided by the Companies operating under the FXOpen brand, nor is it to be considered financial advice.
