BINANCE Bought Leading Crypto Visa Card Issuing Platform SWIPE !Binance Announces Swipe Takeover!
Swipe is the industry’s leading cryptocurrency Visa card issuing platform that enables users to instantly spend cryptocurrencies at over 70 million locations worldwide.
All current SXP utility will remain unchanged.
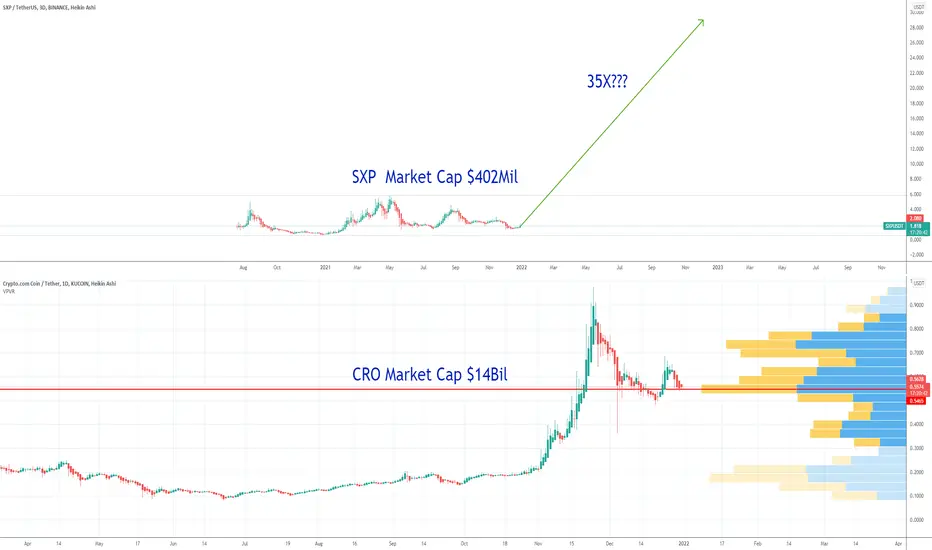
I think this is the beginning of something big! they want to build a rival for CRO.
CRO has a mk cap of 14 Billion while SXP only 400 Million at this point.
I think upside potential for SXP is huge from here: 35X just to reach the market cap of CRO!
SXP
Swipe 888.8% Potential To All-Time HighWe just looked at Swipe (SXPBTC) short-term potential by reading the daily TF chart.
Now, let's look at the long-term chart (weekly TF).
We can see this weeks candle moving above EMA10 for the first time since August 2021, when SXPBTC bounced above EMA10/50 just to move lower.
The chart looks better now compared to Aug. since we are coming out of a new low; a higher low looking back at Jan.
We are aiming for a higher high next.
The weekly candle closes in 2 days which will confirm the break of EMA10 as resistance.
The next barrier is EMA21 at 0.00004411, this level is likely to be conquered this same week.
EMA50 at 0.00005672 is the main resistance and another rejection can happen higher.
But, since we have a higher low, EMA50 is likely to give in to the bulls.
We have over 888.8% potential profits from the current price to the All-Time High. This is pretty nice.
It can higher of course but we are not greedy... So we focus on some conservative targets and rejoice if it goes higher than our initial goal.
I go for 50% mainly on longer trades, but also 100%, 200% and beyond.
In some cases, I aim at 500% or more...
What I learned through the years is that it can take a long time to reach such great returns.
This is not financial advice.
Thanks for reading.
Come back again.
Thanks a lot for your continued support.
Namaste.

Swipe Strong Breakout (+ Old Chart)Swipe (SXPBTC) is doing pretty good today and we are expecting a full trend reversal.
This is just getting started...
Here you have the full chart:
We can see prices moving and closing above EMA50.
The highest volume bar daily since May and also a higher low compared to the beginning of this year.
See my chart for SXPBTC from July 2020 below...
Swipe (SXP) Is Only Getting Started... New Targets at 200%+
Let's see how it goes.
Namaste.

SXP/USD 2022Simple long term fibs with expected TP targets in 2021
Can't say the time frame however with the long base we've been building we can anticipate an equally long chase
Macro target of 20usd I will exit last of my position
TP's on the chart

SXP/USD 2022 updatefollowing original idea posted earlier
gravitating price action toward .618 and finding support above previous 0.5 retrace

$6 SIX DOLLAR SXP STILL A POSSIBILITY!TL;DR
-Watch for restest of horizontal support
-Target $4.19 as first target( sell initial investments)
-Watch for succesful retest of D1 resistance or purple trendline and add to positions
-Target trendline resistance as second target ($6.5+)
As we know, I put out a trade idea for SXP recently saying it could reach $20 this cycle and $89 in the long term.
However, Bitcoin seems to have crashed that party and had our idea invalidated/delayed in the process.
Not to worry. In this Idea I will show you levels I'm still watching for the "dinosaur coin" (as one of my comrades would describe it)
Diving into the chart above, we can see that SXP has strong resistance at the $3 level and $4.19 level and even got rejected several times at those levels, but i failed to point that out in my last analysis(which is linked below btw).
Furthermore, we seem to have formed a strong support level at the $1.27-1.3 area with multiple wicks below.
Looking at the dotted trendline (our major trendline when plotted on a log scale) seems to be where price bounced off most of the time, but now it has been breached due to recent events. Plotting a second trend line on a regular scale (lower black trendline), we see price seems to have formed a new trend support and aligns perfectly with our support region @$1.3 levels.
Zooming in, we can also notice that a range has been formed within our resistance and support levels ($1.27-$4.19).
Also everytime we touched the lower trendline, we managed to make it back to the higher resistance trendline at ath levels, but the move back in may only touched horizontal support and not the lower trendline, hence $4.19 coming into play for rejection.
Main Trade Idea:
Watch for a retest of the $1.3 area(or enter now if it suits you) and Target $4.19 as the first target to sell half of your holdings or your initial investments (whichever one you prefer) and target trend resistance as the second target (around $6.5)
On reaching the first target, you can watch for a retest of the D1 resistance and see if we get and S/R slip there to add to your positions, or wait for a retest of the purple trendline breakout.
As always, if you agree with this idea, comments and likes are a great feedback.

$SXP PERP WAITING FOR A LONG POSIt is unclear what BTC will do, so it is risky to open a long trade right now, I will use the Inverse Head and Shoulder Pattern as an opportunity to open a long trade, which might form at the bottom, if the prize drops between $1.40 - $1.50. Even though the formation target is $2.11, I set $2 resistance level as my target. Good luck to everyone in their trades.
BTC nin ne yapacağı belirsiz, o yüzden şu ara işlem açmak riskli ama ben BTC 48000 üzerinde tutunacağını düşünerek SXP nin $1.40 - $1.50 arasına geri çekilmesi ile dipte oluşacak OBO yu long işlem açmak için fırsat olacak kullanacağım. Formasyon hedefi $2.11 olsa da öncesindeki $2 seviyesini kendime hedef olarak belirlerim. Herkese işlemlerinde başarılar.

SXP $89LONG-TERM TARGET! $20 SHORT-TERMIn the chart above we can see that sxp is currently testing support of its ascending trendline while also in an ascending triangle.
Also worth noting, currently nearing the end of its wave II correction a breakout to the upside will give us a target of at least $19 to complete the wave III.
After which a correction should see us find support either at Prev Ath at listing (RED LINE), or recent ath which coincides with top of the ascending triangle (black trend resistance) to complete the wave IV correction
Once wave IV is done, potential price target is $89!
Pls note: RED bottom trend support is a potential target for a wick in the case BTC sees a sell of, backed by volume as well.
I am a firm believer of this project and do think it will pull similar price actions to that of BNB.
Furtheremore the fundamentals of this coin is very solid and has widespread adoption itself already
Below is a realated idea explaining the ACBDE wave structure.

SXP/USDT SXP$Sxp/usdt
Long direction Futures/Spot
Spot
buy :- 10% For market price
30% at 1.38$
60% at 1.14$
Sell :- 2.3$ , 3.9$ , 5.4$ , 10$.
Sl :- no need for long tem holders
0.95$ for midterm holders .
Futures: -
Buy :- 1.38$ - 1.14$.
Sell:- 2.3$, 3.5$, 3.9$.
Sl :- 1$
LEV:- 2x-3x only with tight sl
SXP$ is strong fundamental coin and backed by ftx ta looking good and rsi also good thats to in the major sujpport area accumalate if you want.
NOTE:- invest only what you afford to loose and this is just my view please do your own research.

sxpIt is at the bottom of the descending canal and is in the important range of action price
It can go down to the bottom of the side channel, but in case of failure of its ascending channel.
There is also news of swipe financail
🆓Swipe (SXP) Dec-28 #SXP $SXP
.
📈RED PLAN
♻️Condition : If 1-Day closes ABOVE 1.4$ zone
🔴Buy : 1.5 - 1.4
🔴Sell : 1.8 - 2.1 - 2.4 - 2.7
📈BLUE PLAN
♻️Condition : If 1-Day closes BELOW 1.4$ zone
🔵Sell : 1.4
🔵Buy : 1.2 - 1
❓Details
🚫Stoploss for Long : 10%
🚫Stoploss for Short : 5%
📈Red Arrow : Main Direction as RED PLAN
📉Blue Arrow : Back-Up Direction as BLUE PLAN
🟩Green zone : Support zone as BUY section
🟥Red zone : Resistance zone as SELL section

$SXP DAILY CHARTLooking at the SXP daily chart, the green zone appears as a buying area. With the breakdown of the ongoing downward trend from May, the price will try to pass the red areas in order. It should not be forgotten that these red areas will appear as resistance and are good areas to take profit. Looking at the shorter time frame (4 hours), the $2 level seems to be the first target. With a two-day close below the green area, the trade should be stopped.
SXP günlük grafiğine bakıldığında yeşil bölge alım alanı olarak karşımıza çıkıyor. Mayıs ayından süregelen düşen trendin kırılımı ile fiyat sırası ile kırmızı alanları geçmeyi deneyecektir. Bu kırmızı alanların karşımıza direnç olarak çıkacağını ve kar almak için güzel bölgeler olduğunu unutmamak gerekir. Daha kısa zaman diliminde bakıldığında ( 4 saatlik ) $2 seviyesi ilk hedef olarak gözükmekte. Yeşil alanın altında iki günlük kapanış ile işlem stop edilmeli.


SXPBTC 1000% POTENTIAL!!!!!SXP is in the demand area.
In this area, it can be accumulated in several stages between the levels of 3000 Satoshi and 2300 Satoshi,
and finally, it will start moving with the failure of the dynamic resistance.
It has a growth potential of nearly 1000%.
TP1:0.00009236
TP2:0.00014727
TP3:0.00020989
TP4:0.00026989
TP5: 0.00033021

the master card of cryptocurrencycrab harmonic pattern:
X=$5.5
AB=0.61 XA
BC=0.38 AB
0.78 XA=$2.54
1.6 BC=$2.86
0.88 XA=$3.64
2 BC=$4.47
2.24 BC=$5.92
1.13 XA=$8.8
2.6 BC=$9.2
1.27 XA=$14.69
1.41 XA=$24.2
3.6 BC=$29.63
1.6 XA=$51.25

SXP POSSIBLE LONG & SHORT SCENARIOSXP is currently trading under resistance, A move down will see us revisit support at $1.3 level, while a break above current resistance @ $2.6 and a successful retest would see us revisit price levels of $4.1 and higher. If there's anything losing my $1000 capital has taught me, it's wait for confirmation always. Starting again with $40. Hoping to turn this into at least $500 before EOY. Sidelined since the start of september.
Stay Safe folks and don't FOMO.

SXP - Bounce?? 🤔SXP has recently bounced off the triple bottom as indicated on the chart.
Ideally we'd want a strong daily bullish engulfing candle to indicate a full reversal - which we didn't. This is why it's important to be cautious when entering longs from here. The best place to enter would be the 0.60 area where we have a strong level where price started its bull run.
IF we do get back down to 0.60, enter with stops below that level.
For now, we can look for bull flags on lower timeframe to take SXP back to the wedge resistance.
Goodluck!


SXP $89LONG-TERM TARGET! $20 SHORT-TERMPlease See original idea linked below
Apologies, left out a couple details.
This shows the ABCDE wave analysis which formed on the weekly and is the basis for a bullish pennant.
And we all love a good bullish pennant, not so often you see it on weekly charts.
All other explanations in the original idea linked below. Thank you
DISCLAIMER: Not Financial Advice

SXP/USDT 4 HOURS UPDATE Welcome to this quick Update, everyone.
If you are reading my updates for the first time do follow me to get more complex charts in a very simplified way.
I also post altcoin setups on Spot, Margin, and Futures .
I have tried my best to bring the best possible outcome in this chart .
SXP /USDT broke out the triangle pattern and retesting the support level .
Entry: CMP MORE IN GREEN BOX
Targets: %25 to %30
Stop Loss: broke and close downside the doted green line
What's your thought on this?
Do hit the like button if you like this update and share your views in the comment section.
Thank you

#SXPUSDT #SXP#Trading ID ; 025
#SXPUSDT
#SXP
@BullsERA
Right Now Is Buying Opportunity Buy And Hold Until Last Tp 3.500
Keep in mind.
🟢 Multiple Rejection Structure
🟣 Monthly Frame Structure.
🔴 Weekly Frame Structure.
🔵 Daily Frame Structure.
🟡 4.H Frame Structure.
⚪️ 1.H Frame Structure.

SXPUSDTi love sxp because it has a good project
sxp is going to the moon
it has also fundamental news in the future

SXP - Watch This Breakout!SXP is currently within a channel and anticipating another move up to the channel resistance.
We have a red descending trendline in place which we can watch for confirmation.
Trade Idea:
- Risk Entry now
- Safe entry after the break of the red descending trendline
- Stops below the channel and 78.6 Fibonacci
- Target the recent highs as first TP and -0.27 as second TP. HODL the rest
We might be at the start of another bull run so leave one position open!
