$ENPH Post-Earnings Pullback StrategyEnphase Energy released its earnings report on February 3rd after market close. The company surpassed earnings expectations by 11.1% and delivered a revenue surprise of 2.6%. Furthermore, Enphase raised its forward guidance for the upcoming fiscal quarter, signaling optimism about future performance.
Market Reaction
Investors were taken by surprise following the earnings announcement. The stock opened with a jump of over 28% and finished the day up more than 38%. This significant move has prompted close monitoring of the stock for a potential pullback that may offer a lower risk entry point.
Pullback Entry Set-Up
Over the past week, the stock has been observed to identify an ideal entry following this surge. As of today, the 21-day Exponential Moving Average (EMA) appears to be providing support, which could align with a 15% pullback from recent highs. Attention will be paid in the upcoming week, possibly as early as Monday, for confirmation of this support as a suitable entry opportunity.
Trading Plan
If the stock closes above the 21 EMA, highlighted as the blue line on the chart, a position will be considered. The stop loss will be placed just below the 21 EMA to manage risk appropriately.
Watchlist Recommendation
Those who find this strategy appealing may want to add Enphase Energy to their watchlist and monitor for confirmation signals.
Disclaimer
Readers are strongly encouraged to perform their own analysis and follow their personal trading strategies. Every investment involves inherent risks, so it is crucial to make careful and informed decisions when allocating capital in the financial markets.
TAN

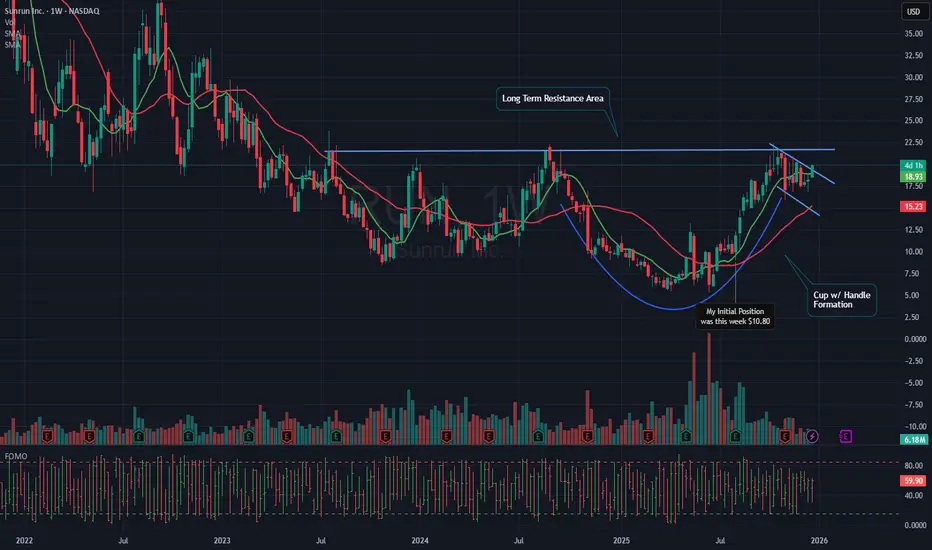
$RUN Cup w/ Handle Breakout AnalysisOverview
SUNRUN has experienced a notable upward movement today, gaining 8.89% as of this writing. This increase has propelled the stock above what appears to be a Cup with Handle formation, a technical pattern often associated with a bullish breakout. Given this development, the current price area could be a favorable point for initiating a new position. Typically, a breakout is confirmed when the price moves above a long-term resistance level.
Position Details
I established a full-size position in SUNRUN in early August at a price of $10.80 per share. Later, in November, I added a smaller amount at $17.95 per share, which increased my average cost to $11.68 per share. Currently, I am up 69% on this position. I did not add more shares today, as I missed the initial surge and prefer not to pursue the price higher. My plan is to wait for the stock to consolidate, even if that occurs at a higher price, since there is no clear area to set a reasonable stop loss for additional shares at this time.
Outlook and Watchlist Recommendation
I am sharing this update because I believe SUNRUN has the potential for further significant gains and should be considered for your watchlist. I will continue to update this analysis when a favorable risk-reward entry point becomes apparent.
Important Disclaimer
Readers are strongly encouraged to perform their own analysis and adhere to personal trading strategies. Keep in mind that all investments carry inherent risk. Making thoughtful and informed decisions is crucial when allocating capital in financial markets.
Opening (IRA): TAN February 21st 32 Covered Call... for a 31.17 debit.
Comments: Still in the top 5 underlyings for IV on my ETF board, with 30-day at 35.0%. Adding at strikes better than what I currently have on after exiting the 33's at 50% max. Selling the -75 delta call against stock to emulate the delta metrics of a 25 delta short put, but with the built-in defense of the short call.
Metrics:
Buying Power Effect/Break Even: 31.17/share
Max Profit: .83
ROC at Max: 2.66%
50% Max: .42
ROC at 50% Max: 1.33%
Will generally look to take profit at 50% max.

Opening (IRA): TAN Nov 15th 37 Covered Call... for a 35.89 debit.
Comments: Relatively decent IV here at 42.8%. Selling the -75 delta call against stock to emulate the delta metrics of a +25 delta short put, but with the built-in defense of the short call.
Metrics:
Buying Power Effect/Break Even: 35.89
Max Profit: 1.11
ROC at Max: 3.09%
50% Max: .56
ROC at 50% Max: 1.55%
Will generally look to take profit at 50% max; roll out short call on test.

Opening (IRA): TAN January 17th 33 Covered Call... for a 32.29 debit.
Comments: ETF IV > 35% with 30-day currently at 39.7%. Adding to my position at strikes better than what I currently have on, selling the -75 delta call against stock to emulate the delta metrics of a 25 delta short put, but with the built-in defense of the short call. Dinking and doinking on "little stuff" running into year's end ... .
Metrics:
Buying Power Effect/Break Even: 32.29/share
Max Profit: .71
ROC at Max: 2.20%
50% Max: .36
ROC at 50% Max: 1.10%
Will generally look to take profit at 50% max.

Opening (IRA): TAN Jan 17th 33 Short Put... for a 1.01 credit.
Comments: Adding to my TAN position at a strike/break even better than what I currently have on. Here, going Plain Jane short put, since there isn't a great advantage to going monied covered call here because the IV skew isn't between the call and put sides isn't significant.
Metrics:
Buying Power Effect/Break Even: 31.99
Max Profit: 1.01
ROC at Max: 3.16%
50% Max: .52
ROC at 50% Max: 1.58%
Will generally look to take profit at 50% max.

Opening (IRA): TAN Dec 20th 34 Covered Call... for a 32.69 debit.
Comments: High IVR/IV at 115.8/57.1. Adding a rung out in December to my position at a break even better than what I currently have on. (See Post Below). Selling the -75 delta call against stock to emulate a 25 delta short put, but with the built-in defense of the short call.
Metrics:
Buying Power Effect/Break Even: 32.69
Max Profit: 1.31
ROC at Max: 4.01%
50% Max: .66
ROC at 50% Max: 2.00%
Will generally look to take profit at 50% max.

Opening (IRA): TAN October 18th 33/40/40/47... for a 3.55 credit.
Comments: Another risk one to make one iron fly in an underlying I'm not currently in with fairly decent 30-day IV at 38.9%.
Metrics:
Buying Power Effect: 3.45
Max Profit: 3.55
ROC at Max: 102.90%
25% Max: .89
ROC at 25% Max: 25.72%
Will look to take profit at 25% max.

TAN breakdown possible . Us Stockrejected from upper trendline
40 below weak
38.50 / 37.50 can test soon
if upper TL break then trade invalid

Opening (IRA): TAN August 30th 38 Covered Call... for a 37.00 debit.
Comments: Back into TAN (30-Day IV: 47.6%), selling the -76 call against stock to emulate the delta metrics of a 25 delta short put, but with built-in short call defense. Going with the August 30th, 46 DTE contract.
Metrics:
Buying Power Effect/Break Even: 37.00/share
Max Profit: 1.00 ($100)
ROC at Max: 2.63%
50% Max: .50 ($50)
ROC at 50% max: 1.32%
Will generally look to take profit at 50% max/roll the short call for duration on test.

TAN Breakout possible , US Stock40.50 above swing high breakout possible
41.50 above trendline breakout possible
41.30/42/43/45/46 can test soon

Opening (IRA): TAN August 16th 39 Covered Call... for a 37.86 debit.
Comments: High IVR/IV at 55.1/41. Selling the -75 call against stock to emulate the delta metrics of a 25 delta short put, but with the built-in defense of the short call.
Metrics:
Buying Power Effect/Break Even: 37.86
Max Profit: 1.14
ROC at Max: 3.01%
50% Max: .57
ROC at 50% Max: 1.50%
Will generally look to take profit at 50% max.

Opening (IRA): TAN August 16th 37 Short Put... for a .93 credit.
Comments: High IVR/IV at 51/44. Adding a short put in the vicinity of the 25 delta strike on weakness to my covered call, which has a 37.86 break even. (See Post Below).
Metrics:
Break Even/Buying Power Effect: 36.03
Max Profit: .93 ($93)
ROC at Max: 2.44%
ROC at 50% Max: 1.22%
Will generally look to take profit at 50% max; roll for credit and duration if the TP doesn't hit.

Small cap recoveryLet's see.
I am betting on a generational low in small cap stocks and a bull run from here.
My time horizon is 5 - 10 years, but looking at this year for the heaviest move.
My portfolio consists of
35% TNA
20% XBI
15% RDFN
20% TAN
10% SPWR

TAN Monthly ForecastLongterm position taken in TAN solar ETF.
Immediate structural resistance near 47. Major resistance at 50-618 fib extension from ATH.
Any break and close of Hagopian line will threaten longer term count.

Solar stocks follow energy prices (crude oil).Solar stocks follow energy prices (crude oil) and AMEX:USO (oil etf) is about to break out. I read that chinese are outcompeting the west in cheaper solar products. ie NYSE:JKS
TNX is at bull market, crude oil and yields correlate (not sure which one cause the other).
I look at everything trough probabilities since nothing is ever known.
Stocks do bad when economy does good. But energy sector performs well during good economy, whilst everything else is falling (Tech). Peak tech means bottom for energy?
I think these are good hedge plays, if you believe rising oil or yields pose risk.
Recently Chinese gov asked Jack Ma to return because their financial markets did poorly. There could be a sentiment shift, where indicator will be NYSE:BABA performance. People might still have an old bias?

Tan PutBuy Aug-18-23 62 Puts @ 0.95 Limit to Open
Has good downside momentum, potential to bounce though.

$TAN: Solar names primed for a move upIf the ETF crosses the $84.03 mark during next week a huge rally can take place, daily charts are already bullish for a few days, I got into a position in $FSLR, $ENPH and $RUN recently, but might add an ETF position in $TAN as well if the weekly signal outlined here triggers.
Note that price crossed over the entire post COVID low till today Volume Profile POC here, which is an interesting technical variable, as it becomes easier to trigger a longer term trend signal as well if it gains traction next.
Best of luck!
Cheers,
Ivan Labrie.

CCI, ADX, Pivot Point StrategyUsing Tan as an example, we see how we can identify periods of Accumulation and Distribution for the solar industry. My custom ADX, CCI strategy gives signs of accumulation, over buying and over selling. I've marked those points on the chart. Presently signs of uncertainty in both directions as the range sets lower highs and higher lows. This is a sign of uncertainty surrounding regulations and the future of climate change.
As I mentioned I use a custom setup but check out the Investopedia on how to use the CCI. Matching the CCI with the Pivot Points High Low should yield great results. Set your Pivot Points High Low to 14/14 for the daily charts. I do believe there is a bit more downside to the trendline support there for the Solar Industry, will update you after to see what happens.
Not recommending a short here, but I do recommend watching to see if some support is found in the short term, or potentially a break out of the bottom end of the range. Confirmation is needed before taking any actions.

RUN Solar Stock Uptrending from earningsRUN is benefiting from the federal incentives policies. As shown on the chart
Price has risen 48% since the earnings report which was quite favorable.
It is consistently above the Ichimoku cloud and is now in a consolidation.
I see this as a good swing-long setup with the stop loss under the cloud
or instead wait for a pullback. The target would be $37 at the swing high
in mid September or when relative strength hits 80 and shows a bearish
trend.

TIME TO SHORT SOLAR SECTOR FSLR TOPPEDI am now moving into puts in FSLR as of this morning >look to move to a net short at 75 % in the money puts look at 2023 puts only .We should a rather large drop back to 100/115 easy

TAN Diamond pattern: 68 retest or 92 BO to confirm wave 3 0f 5TAN for the 3rd time made a diamond reversal pattern near the base of an upchannel. However, diamond pattern may also be a continuation down pattern possibly for a retest of 68.
TAN also had a big red wedge fro 126 2021 ATH & is now retesting this wedge falling below weekly wma50.
BULLISH BIAS: There is a strong chance this channel will be recovered considering the last 2 strong reversals after beartrap below channel base. If TAN finally breaks above 92 in the next 2 weeks, making a higher high, this will confirm a continuation of wave 3 of 5.
BEARISH CASE: last 2 weekly candles show long tails pushing prices downward. This may lead to a diamond continuation down pattern to retest 68 (the May 2021 M-pattern neck) or even the 56 June low (previous double bottoms with strong bounce), next 2 very strong supports.
Not trading advice.

US Stock In Play: $RUN$RUN - Technology | Solar
broke out of a descending wedge during its most recent earnings report (QoQ growth in EPS and Sales) on high volume.
the past days of resilience in its price action tells alot of its strength in this market. already at RS high before price
