USDCHF: when the safe haven loses its edgeUSDCHF remains attractive as global expectations around monetary policy shift. Markets are increasingly pricing a softer tone from the Fed later in the year, while demand for safe-haven assets like the Swiss franc continues to fade. Switzerland’s low inflation and limited growth outlook reduce CHF appeal, opening room for USD recovery, especially against low-yield currencies.
From a technical perspective, price has formed a base after a sharp decline. Higher lows indicate a developing bullish structure. Price is holding above short-term EMAs, and the former resistance zone has turned into support. The current area represents a retest aligned with structure and Fibonacci levels. Rising volume on advances versus pullbacks supports the bullish continuation scenario.
Trading plan: as long as price holds above the retest zone and confirmation appears, long positions are favored. The first target is a move toward recent highs, followed by Fibonacci extensions. A breakdown below support would invalidate the bullish setup and return price to consolidation.
When fear-driven currencies lose momentum, moves tend to accelerate.
Tardingview

BABA: when China allows growth againAlibaba remains one of the most undervalued mega-cap tech companies globally. After years of regulatory pressure and weak macro conditions in China, the company is entering a stabilization phase. Regulatory risks have eased, and Chinese authorities are signaling support for the technology sector and domestic consumption. Alibaba continues to generate strong cash flow, operates a massive ecosystem across e-commerce, cloud, and logistics, and actively executes share buybacks, reducing float. At current levels, the market is pricing in excessive pessimism, creating asymmetric upside if macro conditions improve.
From a technical perspective, price is trading inside a rising channel. After a strong impulse, the market moved into a corrective phase, forming a swing zone. Price remains above key EMA levels, confirming a valid medium-term uptrend. The current area represents a buyer interest zone aligned with structural support and Fibonacci levels. Declining volume during the pullback supports the idea of a healthy correction rather than trend reversal.
Trading plan: as long as price holds above the current support zone and confirmation appears, long positions become attractive. The first target is a return to previous highs, followed by Fibonacci extensions. Medium-term targets align with the upper boundary of the channel. A breakdown below the swing zone would invalidate the bullish scenario and signal deeper correction.
The best opportunities often appear when fear fades but confidence hasn’t returned yet.

NTSK Netskope: the rocket is on the padNetskope’s shares (ticker NTSK) are trading after a successful IPO, but the chart suggests we’re still in early accumulation phase. The price is hovering in the ~$21-24 zone, and a breakout above near resistance is needed to confirm strength. The first target is $28, with potential extension toward $35–40 if the structure holds. Given IPO volatility, entry requires careful stop-management and confirmation of trend support.
Netskope operates in the rapidly expanding cloud security market (SASE/Zero Trust). With revenue growth exceeding 30% and narrowing losses, the company is well-positioned in the AI-security wave. While the TAM (total addressable market) is large and growth prospects strong, the business still faces profitability and competitive risks.
The rocket may not yet be launched, but the launchpad is set. Stay patient, wait for the “ignition” signal, and let the engine build thrust before liftoff.

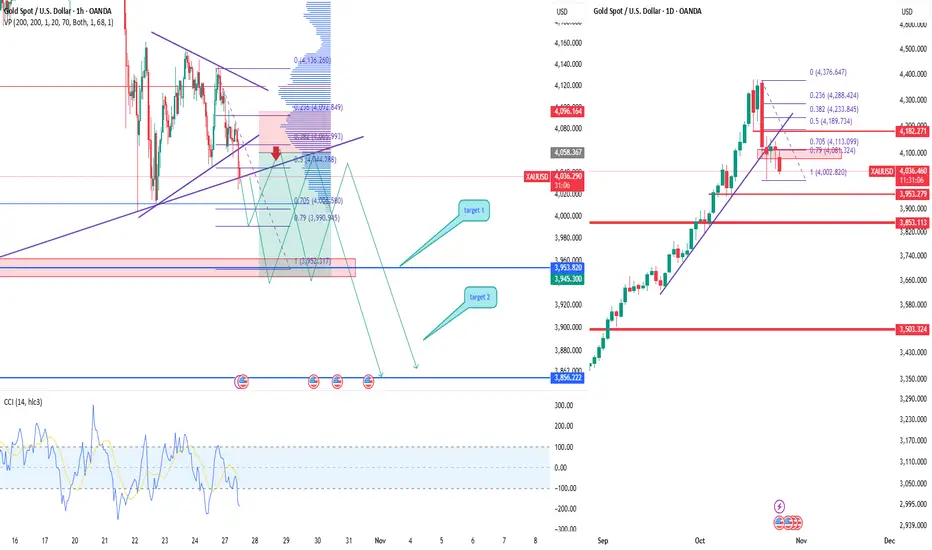
XAUUSD Gold testing support, correction possibleAfter a strong rally, gold entered a correction phase. Price broke the ascending channel and now trades around 4030–4050. The chart structure suggests a potential retest near 4070–4090 before continuation to 3960 (Target 1) and 3856 (Target 2).
CCI confirms weak buying momentum and volume profile shows high liquidity zones above current price — favoring a pullback.
Investors are taking profits after gold’s rally amid softer Fed outlook and possible dollar rebound. While long-term fundamentals stay bullish, short-term correction looks likely.
Sell setup from 4070–4090 zone with targets 3960 and 3856, stop 4110.
Valid while price remains below 4110.
XRPUSDT — consolidation before the next impulseOn the 1H chart, XRPUSDT is consolidating after a short pullback, forming a flag pattern above the 2.45 support area. Despite a few false breaks, buyers continue to defend the trendline, signaling demand absorption.
The 2.45–2.52 range remains pivotal. A breakout with confirmation could open the way toward 2.63 (Target 1) and 2.82 (Target 2) — the next supply zones. As long as the higher-low structure holds, the bullish scenario remains intact.
Fundamentally, XRP still shows resilience amid the broader altcoin weakness. Ripple’s ongoing expansion in cross-border payments and hopes for a clearer regulatory framework in the U.S. support investor confidence.
This is a classic accumulation phase — expectations may diverge from reality, but that’s where strong trends are born. Keep emotions aside and wait for a clean breakout signal.

USDX — rebound from demand zoneThe U.S. Dollar Index (USDX) is correcting within an upward channel. After testing the demand zone 98.20–98.80 on the 4H chart, a double bottom pattern appeared, signaling a potential bullish continuation.
Strong Smart Money and volume support remain near 98.50. As long as price stays above this area, the bullish scenario remains valid.
Targets for growth are located at 100.12 and 101.03 — key supply zones and previous highs.
The dollar is supported by solid U.S. macro data and expectations that the Federal Reserve will maintain higher rates for longer. This keeps the USD attractive and favors further recovery.
The bullish bias remains while price holds above 98.20. Only a confirmed breakdown below 97.50 would shift the structure to bearish.

Global Financial Markets and Their Structure1. Overview of Global Financial Markets
Financial markets can be broadly defined as platforms where financial instruments are traded between buyers and sellers. They can be categorized based on:
Type of instruments traded – equities, bonds, currencies, derivatives, commodities, and digital assets.
Maturity of instruments – money markets (short-term) and capital markets (long-term).
Trading mechanism – exchange-traded markets and over-the-counter (OTC) markets.
Geographical scope – domestic markets and international markets.
Globally, financial markets operate continuously, interconnected through electronic trading platforms and international financial institutions. The growth of globalization, financial liberalization, and technological innovation has significantly expanded the depth, liquidity, and efficiency of these markets.
2. Types of Global Financial Markets
2.1 Capital Markets
Capital markets are platforms for long-term funding where securities with maturities of more than one year are traded. They include:
Equity Markets: Where shares of publicly listed companies are issued and traded. Examples include the New York Stock Exchange (NYSE), London Stock Exchange (LSE), and Tokyo Stock Exchange (TSE). Equity markets facilitate capital raising for companies and provide investors an opportunity to participate in corporate growth.
Debt Markets (Bond Markets): Where government, corporate, and municipal bonds are issued and traded. Bond markets are crucial for governments to finance infrastructure projects and for corporations to raise long-term funds. Major debt markets include the U.S. Treasury market, Eurobond market, and corporate bond markets in Europe and Asia.
2.2 Money Markets
Money markets deal in short-term debt instruments, usually with maturities of less than one year. They provide liquidity and fund management solutions for governments, financial institutions, and corporations. Instruments include:
Treasury bills
Commercial paper
Certificates of deposit
Repurchase agreements
The money market is critical for maintaining liquidity and controlling short-term interest rates in the global economy.
2.3 Foreign Exchange (Forex) Markets
Forex markets are the largest financial markets globally, with an average daily turnover exceeding $7 trillion. They enable the trading of currencies for international trade, investment, speculation, and hedging. Forex markets operate 24 hours due to time zone differences across London, New York, Tokyo, and Sydney.
Major participants include central banks, commercial banks, hedge funds, multinational corporations, and retail traders. The forex market significantly influences global trade balances, monetary policy, and capital flows.
2.4 Derivatives Markets
Derivatives markets facilitate trading of contracts whose value is derived from an underlying asset. Common derivatives include:
Futures
Options
Swaps
Forwards
Derivatives are used for hedging, speculation, and arbitrage. Key markets include the Chicago Mercantile Exchange (CME), Eurex in Europe, and the Dubai Mercantile Exchange. Derivatives markets play a crucial role in risk management but also introduce systemic risks if leveraged excessively.
2.5 Commodity Markets
Commodity markets deal with the trading of raw materials like oil, gold, metals, agricultural products, and energy resources. They are classified as:
Physical Markets: For actual delivery of commodities.
Futures Markets: For trading standardized contracts with future delivery dates.
Major commodity exchanges include the London Metal Exchange (LME), Chicago Board of Trade (CBOT), and Multi Commodity Exchange of India (MCX). Commodity markets are vital for price discovery, risk management, and hedging against inflation.
2.6 Digital and Crypto-Asset Markets
The rise of blockchain technology has given birth to digital asset markets, including cryptocurrencies, stablecoins, and central bank digital currencies (CBDCs). These markets offer decentralized financial solutions, new investment opportunities, and cross-border payment efficiencies. Exchanges like Coinbase, Binance, and Kraken operate globally, while central banks experiment with digital currencies to improve payment systems and monetary policy implementation.
3. Key Participants in Global Financial Markets
3.1 Institutional Investors
Institutional investors include mutual funds, hedge funds, insurance companies, pension funds, and sovereign wealth funds. They are major drivers of capital flows and market liquidity. Their strategies often involve asset allocation, risk management, and long-term investment horizon.
3.2 Retail Investors
Retail investors are individual participants who invest in stocks, bonds, mutual funds, and other securities. They represent a significant portion of market activity, especially in developed economies with well-established broker networks and electronic trading platforms.
3.3 Corporations
Corporations participate as issuers of equity and debt instruments, seeking funding for expansion, research, and capital projects. They also engage in currency hedging, commodity contracts, and derivative trading to manage operational and financial risks.
3.4 Governments and Central Banks
Governments issue sovereign bonds to fund fiscal deficits and infrastructure projects. Central banks control monetary policy, manage interest rates, stabilize currency values, and intervene in foreign exchange markets to influence capital flows and inflation.
3.5 Intermediaries
Banks, brokers, dealers, and market makers facilitate transactions, provide liquidity, and offer advisory services. Investment banks play a critical role in underwriting, mergers and acquisitions, and structuring complex financial instruments.
4. Structure of Global Financial Markets
The structure of global financial markets can be examined through market segmentation, interconnectedness, and regulatory frameworks.
4.1 Primary and Secondary Markets
Primary Market: Where new securities are issued for the first time, such as IPOs and bond issuances. Capital raised in primary markets finances business expansion and government projects.
Secondary Market: Where existing securities are traded between investors. Secondary markets provide liquidity, facilitate price discovery, and help determine the cost of capital.
4.2 Exchange-Traded vs Over-the-Counter Markets
Exchange-Traded Markets: Transactions occur on regulated exchanges with standardized contracts and transparency (e.g., NYSE, CME).
OTC Markets: Trades are bilateral agreements between parties, often customized and less transparent (e.g., forex forwards, swaps).
4.3 Segmentation by Geography and Time Zone
Global financial markets are interconnected across regions:
Asia-Pacific Markets: Tokyo, Shanghai, Hong Kong, Singapore, and Sydney.
European Markets: London, Frankfurt, Paris, and Zurich.
Americas Markets: New York, Toronto, and Chicago.
Time zone differences create continuous trading opportunities, but also pose risks of volatility spillovers and information asymmetry.
4.4 Market Integration
Integration occurs through capital mobility, cross-border investment, and harmonized regulations. Fully integrated markets enable diversification, lower cost of capital, and efficient resource allocation. Partial integration often results in fragmented liquidity and regional discrepancies in pricing.
5. Instruments Traded in Global Financial Markets
5.1 Equity Instruments
Equities provide ownership in companies and the right to dividends. They are traded on stock exchanges or OTC platforms. Variants include:
Common stock
Preferred stock
Depository receipts (e.g., ADRs, GDRs)
5.2 Debt Instruments
Debt instruments provide fixed or floating returns to investors. They include:
Government securities (treasuries, gilts)
Corporate bonds
Municipal bonds
Floating rate notes
5.3 Derivatives Instruments
Derivatives derive value from underlying assets and are used for hedging or speculation. Types include:
Futures contracts
Options contracts
Swaps (interest rate, currency, credit)
Forwards
5.4 Hybrid Instruments
Hybrid instruments combine features of debt and equity, such as convertible bonds, preferred shares, and structured notes. They offer flexibility in risk and return profiles for investors.
5.5 Alternative Instruments
Alternative instruments include commodities, real estate investment trusts (REITs), private equity, venture capital, and digital assets. These instruments enhance portfolio diversification and risk management.
6. Functions of Global Financial Markets
Financial markets perform several critical functions:
Capital Allocation: Efficiently channel funds from savers to borrowers for productive investment.
Price Discovery: Determine fair prices of financial instruments through supply and demand dynamics.
Liquidity Provision: Allow participants to buy or sell assets quickly without significantly impacting prices.
Risk Management: Provide tools like derivatives to hedge against market, credit, and currency risks.
Information Dissemination: Reflect economic, corporate, and geopolitical information in prices.
Economic Growth Support: Facilitate investment in infrastructure, innovation, and industry expansion.
7. Regulation of Global Financial Markets
Regulation ensures stability, transparency, and investor protection. Key regulatory frameworks include:
United States: Securities and Exchange Commission (SEC), Commodity Futures Trading Commission (CFTC), Federal Reserve.
Europe: European Securities and Markets Authority (ESMA), national regulators like FCA (UK), BaFin (Germany).
Asia-Pacific: Securities and Exchange Board of India (SEBI), China Securities Regulatory Commission (CSRC), Monetary Authority of Singapore (MAS).
Regulation covers market conduct, disclosure requirements, capital adequacy, trading limits, anti-money laundering, and risk management. Cross-border coordination is vital due to globalization of financial markets.
8. Trends and Innovations
8.1 Technological Advancements
Algorithmic and High-Frequency Trading (HFT): Use of automated systems to execute trades at microsecond speeds.
Blockchain and Distributed Ledger Technology: Facilitate transparent, secure, and decentralized transactions.
Robo-Advisors: Automated investment advisory platforms improving accessibility for retail investors.
8.2 Globalization and Integration
Capital flows across borders, with emerging markets increasingly participating in global investment. Financial integration allows diversification but increases vulnerability to external shocks.
8.3 Sustainable and ESG Investing
Environmental, Social, and Governance (ESG) factors are increasingly incorporated in investment strategies, impacting capital allocation and corporate behavior.
8.4 Digital Currencies
CBDCs and cryptocurrencies are transforming cross-border payments, monetary policy transmission, and investment opportunities.
9. Challenges in Global Financial Markets
Volatility and Systemic Risk: Interconnectedness can transmit shocks rapidly across borders.
Regulatory Arbitrage: Firms may exploit differences in national regulations.
Cybersecurity Threats: Digitalization exposes markets to hacking and fraud.
Liquidity Mismatches: Especially in emerging markets or during crises.
Currency and Interest Rate Risks: Global flows are affected by exchange rate fluctuations and monetary policy divergence.
10. Importance for Investors, Traders, and Policymakers
10.1 Investors
Understanding market structure helps in portfolio diversification, risk management, and strategic allocation of capital across geographies and asset classes.
10.2 Traders
Market structure knowledge is critical for developing trading strategies, exploiting arbitrage opportunities, and managing intraday and long-term market risks.
10.3 Policymakers
Insights into market behavior, liquidity conditions, and capital flows assist in macroeconomic policy, regulation, and crisis management.
Conclusion
Global financial markets are the lifeblood of the modern economy. Their structure is vast and multi-layered, encompassing diverse instruments, participants, and functions. Efficient, transparent, and integrated markets enhance economic growth, facilitate investment, and support risk management. At the same time, challenges such as systemic risk, regulatory complexity, and technological disruption demand vigilance from all participants.
For investors, traders, and policymakers, understanding the structure and functioning of these markets is essential to navigate global capital flows, identify opportunities, and mitigate risks. As markets evolve with technology, sustainability concerns, and financial innovation, continuous learning and adaptation are key to thriving in this dynamic global financial ecosystem.
Exploiting Closing vs Opening Price Gaps Across Regions1. Introduction
In global financial markets, one of the most intriguing phenomena observed by traders is the price gap between the previous day’s closing price in one region and the opening price in another. These gaps present opportunities for informed traders to anticipate price movements, hedge positions, and exploit short-term volatility. Understanding the mechanics of these gaps, their underlying causes, and the strategies to trade them is essential for both institutional and retail investors aiming to optimize returns in a highly interconnected market.
Price gaps occur due to various factors: geopolitical events, overnight news, earnings announcements, macroeconomic data, and liquidity mismatches. By analyzing historical data and employing structured trading strategies, traders can turn these gaps into actionable insights.
This article delves into the nature of closing vs opening price gaps, the drivers behind them, the strategies used to exploit them across different regions, and practical considerations for risk management.
2. Understanding Closing vs Opening Price Gaps
2.1 Definition of Price Gaps
A price gap occurs when an asset’s opening price significantly differs from the previous day’s closing price. These gaps can be either:
Up Gap: Opening price is higher than the previous close.
Down Gap: Opening price is lower than the previous close.
2.2 Types of Gaps
Common Gaps:
Often occur in quiet markets without major news. Typically filled quickly within the same trading session.
Breakaway Gaps:
Form when the market breaks a significant support/resistance level. Often precede sustained trends.
Runaway (Continuation) Gaps:
Appear during strong trending moves, confirming the momentum.
Exhaustion Gaps:
Occur near the end of a trend, signaling potential reversals.
2.3 Relevance Across Global Markets
Due to time zone differences, markets in Asia, Europe, and North America open and close at different times. For example:
Asian markets: Tokyo, Hong Kong, and Singapore operate roughly between 9:00–16:00 local time.
European markets: London and Frankfurt operate roughly 8:00–16:30 GMT.
US markets: NYSE and NASDAQ operate 9:30–16:00 EST.
Price gaps often reflect overnight developments in one region that impact the opening of another. This inter-market influence creates exploitable arbitrage opportunities.
3. Causes of Closing vs Opening Price Gaps
3.1 Overnight News and Events
Economic data releases, geopolitical developments, and corporate news can significantly shift investor sentiment between market closes. For example:
An unexpected US Federal Reserve interest rate change can trigger large opening gaps in Asian and European indices.
Earnings announcements released after US market close can affect European stocks the following day.
3.2 Currency Movements
In a globalized market, currency fluctuations often precede stock price adjustments across regions. For instance:
A sharp USD appreciation overnight can depress commodity-related stocks in Europe and Asia.
Emerging market equities denominated in local currencies are impacted by overnight forex volatility.
3.3 Liquidity and Market Participation
Different regions have varying levels of liquidity at different times:
Asian markets may close with low trading volumes in certain assets, leading to larger overnight gaps when European or US markets open.
Thin liquidity amplifies price swings, creating exploitable gaps.
3.4 Market Sentiment and Technical Levels
Price gaps are often exacerbated by technical triggers, such as:
Breakout above key resistance levels in one market.
Oversold or overbought conditions causing momentum-driven gaps at market open.
4. Strategies to Exploit Price Gaps Across Regions
4.1 Gap-Fill Strategy
Concept: Many gaps tend to "fill," meaning the price moves back to the previous close over the next few hours or days.
Steps:
Identify significant overnight gaps using pre-market data.
Evaluate news and sentiment to determine the likelihood of gap fill.
Enter a trade in the direction opposite to the gap.
Example:
If S&P 500 futures show a 1% down gap overnight due to weak Asian data, but no major US fundamentals changed, a trader may anticipate a partial recovery after the US market opens.
4.2 Momentum Gap Trading
Concept: Some gaps indicate strong momentum, and trading in the gap’s direction can be profitable.
Steps:
Confirm gap accompanied by high pre-market volume or strong news catalyst.
Trade in the direction of the gap after the market opens.
Set tight stop-losses to protect against reversals.
Example:
A positive earnings report from a major tech company may cause a European market to open significantly higher. Traders may ride the momentum early in the session.
4.3 Arbitrage Across Regions
Concept: Price differences between regional markets for the same asset or index create arbitrage opportunities.
Steps:
Track closing prices in one region and opening prices in another.
Identify statistically significant gaps exceeding normal volatility.
Take offsetting positions in correlated assets or derivatives.
Example:
If the Nikkei closes sharply down but US futures are up, a trader can exploit the relative price mismatch using ETFs or futures contracts.
4.4 Pre-Market and Post-Market Futures Trading
Futures markets often remain open when cash markets are closed, providing a predictive view of opening gaps.
Steps:
Analyze overnight futures data.
Compare futures with previous day’s close.
Anticipate opening gaps and place orders accordingly.
Advantages:
Provides a leading indicator for the cash market.
Reduces reaction time to overnight news.
Conclusion
Exploiting closing vs opening price gaps across regions is a sophisticated strategy requiring an understanding of global market interconnectivity, macroeconomic factors, and technical analysis. Traders can leverage these gaps through gap-fill strategies, momentum trading, cross-region arbitrage, and futures-based pre-market positioning.
Successful exploitation demands:
Strong analytical skills
Risk management discipline
Awareness of market hours, liquidity, and regional nuances
Access to high-quality, real-time data
By combining quantitative analysis with practical insights, traders can turn global price gaps into profitable opportunities while navigating the inherent volatility of interconnected financial markets.
Webull Corporation — demand confirmation and growth potentialTechnical analysis: On the 4H chart, Webull Corporation (ticker BULL) is showing signs of a breakout from the accumulation channel. After a decline, the price stabilized in the 12.50–15.50 range, where demand confirmation is visible. The current level of 15.39 serves as a starting point for growth. The nearest upside targets are 17.40 and 20.40, with extended potential toward 25.30 and 41.00 if resistance is broken. Key support is located at 13.30–12.50, and losing this area may bring back bearish momentum.
Webull Corporation is a US-based fintech company offering online trading and investment services. Its platform provides retail investors with access to stocks, ETFs, options, and cryptocurrencies. Competing with Robinhood, Webull stands out thanks to advanced charts, analytics, and low fees. The growing popularity of online brokers and an expanding user base support the company’s long-term outlook.
As long as the accumulation structure holds and demand remains strong, the bullish scenario stays in focus. For long-term investors, the stock may be considered a buy-and-hold opportunity, supported by fintech sector growth and rising competition among online brokers.

Introduction to Commodity Supercycle1. Understanding Commodities
Commodities are basic goods used in commerce that are interchangeable with other goods of the same type. They serve as the foundation of the global economy and are divided into several categories:
Energy commodities – oil, natural gas, coal
Metals – gold, silver, copper, aluminum
Agricultural commodities – wheat, corn, soybeans, coffee
Livestock – cattle, pork, poultry
Commodities are distinguished from manufactured products by their standardization and global demand. A barrel of crude oil, for example, is fundamentally the same regardless of producer, allowing it to be traded globally.
2. What is a Commodity Supercycle?
A commodity supercycle refers to an extended period, often lasting 10–30 years, during which commodity prices trend above their long-term average due to structural changes in global demand and supply. Unlike regular commodity cycles, which are typically shorter (3–5 years), supercycles are driven by macroeconomic forces rather than temporary market fluctuations.
Key characteristics of a commodity supercycle include:
Prolonged high prices – commodity prices remain above historical averages for extended periods.
Global demand drivers – typically fueled by emerging markets’ industrialization and urbanization.
Supply constraints – limited capacity to quickly increase production.
Inflationary pressures – rising commodity prices impact broader inflation trends.
Investment opportunities – commodities and related assets tend to outperform other asset classes.
3. Historical Perspective of Commodity Supercycles
Commodity supercycles are not a new phenomenon. Historical analysis highlights several key supercycles:
3.1 The 19th Century Industrialization Cycle
The first recognized supercycle emerged during the Industrial Revolution. Demand for coal, iron, and other raw materials surged as Western Europe and North America industrialized. Key drivers included mechanization, railway construction, and urbanization.
3.2 Post-World War II Reconstruction
Following WWII, Europe and Japan required massive reconstruction. Commodity demand, especially for steel, copper, and oil, rose sharply. This period also saw significant government investment in infrastructure, creating long-term demand pressures.
3.3 The 2000s China-Led Supercycle
The most cited modern supercycle was driven by China’s industrial boom. Rapid urbanization, construction, and manufacturing required unprecedented volumes of metals, energy, and agricultural products. During this period:
Copper prices increased fivefold between 2003 and 2007.
Iron ore prices surged over 400% between 2003 and 2008.
Oil prices reached historic highs, peaking above $140 per barrel in 2008.
This supercycle illustrates the impact of a single economy’s rapid growth on global commodity markets.
4. Drivers of Commodity Supercycles
Several structural and cyclical factors contribute to the formation of supercycles:
4.1 Economic Growth in Emerging Markets
Emerging economies, particularly China, India, and Brazil, experience rapid urbanization and industrialization. Their growing demand for raw materials drives prices upward globally.
4.2 Population Growth and Urbanization
Increasing population, especially in developing countries, creates long-term demand for energy, food, and construction materials. Urban infrastructure, housing, and transportation projects amplify this effect.
4.3 Technological Advancement and Industrialization
While technology can sometimes reduce demand through efficiency gains, large-scale industrialization typically increases the need for steel, copper, and energy-intensive resources.
4.4 Supply Constraints
Unlike demand, which can surge quickly, commodity supply often lags due to:
Long lead times for mining and energy projects
Geopolitical risks in resource-rich regions
Environmental regulations limiting extraction
This imbalance between rising demand and constrained supply sustains higher prices.
4.5 Inflation and Monetary Policy
Periods of loose monetary policy and low real interest rates often coincide with commodity supercycles. Investors seek inflation hedges, and commodities become attractive, creating a self-reinforcing cycle.
5. Key Commodities in Supercycles
Certain commodities are more prone to supercycle effects due to their strategic importance:
5.1 Energy Commodities
Crude Oil: Critical for transportation and industrial production.
Natural Gas: Heating, power generation, and chemical feedstock.
Coal: Industrial power, especially in emerging markets.
Energy demand rises with urbanization, industrialization, and global transport expansion, often driving supercycle trends.
5.2 Metals
Copper: Integral for electrical systems, construction, and electronics.
Iron Ore & Steel: Essential for infrastructure and heavy industry.
Aluminum & Nickel: Key for manufacturing, transportation, and battery production.
Technological advances like electrification and renewable energy further boost demand for certain metals.
5.3 Agricultural Commodities
Grains (wheat, corn, rice): Food security concerns, population growth.
Soybeans & Edible Oils: Rising protein consumption and industrial applications.
Coffee & Sugar: Urban lifestyle changes and consumer demand.
Weather patterns, climate change, and land scarcity can intensify supply constraints.
6. Investment Implications of Commodity Supercycles
Commodity supercycles create both opportunities and risks for investors:
6.1 Asset Classes Benefiting
Commodity Futures and ETFs: Direct exposure to price increases.
Mining and Energy Stocks: Profit from rising commodity prices.
Infrastructure Investments: Higher raw material demand can boost certain industries.
6.2 Risks
Volatility: Despite long-term trends, commodities remain cyclical in the short term.
Inflation and Currency Risk: Commodities often trade in USD, affecting returns for other currencies.
Geopolitical Events: Resource nationalism, wars, and trade restrictions can impact supply.
6.3 Strategic Positioning
Long-term investors often diversify across commodities and related equities to capture supercycle gains while mitigating risk.
7. Measuring and Identifying Supercycles
Economists and market analysts use several tools to identify supercycles:
7.1 Real Price Trends
Adjusting for inflation, analysts track long-term price trends to distinguish supercycles from temporary spikes.
7.2 Supply-Demand Gaps
Persistent supply shortages relative to rising demand indicate potential supercycle formation.
7.3 Macro Indicators
Urbanization rates
Industrial production growth
Energy consumption patterns
These indicators signal structural demand trends that can drive supercycles.
7.4 Investment Flows
Tracking institutional investment in commodities can reveal market expectations of long-term price growth.
8. The Role of Emerging Technologies
Emerging technologies can both create and sustain supercycles:
Electric Vehicles (EVs): Surge in copper, lithium, nickel, and cobalt demand.
Renewable Energy Infrastructure: Increases need for steel, aluminum, and rare earth metals.
Smart Agriculture: Efficient production can ease pressure on food commodities but also raises demand for fertilizers and energy.
Technology-driven demand tends to be structural and long-lasting, aligning with supercycle characteristics.
9. Environmental and Geopolitical Considerations
9.1 Climate Change
Extreme weather affects crop yields and energy supply.
Stricter environmental regulations may restrict mining, oil drilling, and fossil fuel production.
9.2 Geopolitical Risks
Resource-rich countries may leverage commodities for political influence.
Trade wars and sanctions can disrupt supply chains, further impacting prices.
10. Future Outlook
Many analysts believe a new commodity supercycle may be emerging due to:
Post-pandemic industrial recovery
Rapid energy transition to renewables
EV and battery metal demand
Geopolitical shifts and supply chain restructuring
However, global economic slowdowns, technological breakthroughs, and policy interventions could temper or extend the supercycle’s trajectory.
Conclusion
Commodity supercycles represent one of the most significant long-term economic phenomena affecting markets, investors, and nations. Driven by structural demand growth, supply constraints, and technological innovation, they influence global trade, inflation, and investment strategies. Recognizing the signals of a supercycle allows governments, corporations, and investors to strategically position themselves to benefit from prolonged commodity trends. While predicting the exact duration and magnitude is challenging, historical patterns provide valuable guidance for navigating future supercycles.
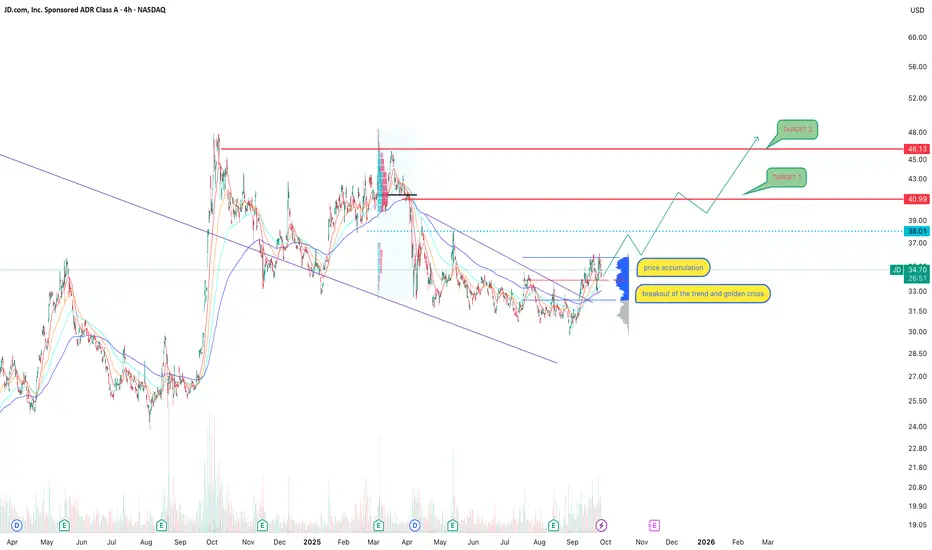
JD.com: accumulation, golden cross, and a chance to restart JD.com remains one of China’s largest e-commerce players, and despite macroeconomic headwinds, the company continues to hold its ground. Fundamentally, JD is focused on optimizing logistics, cutting costs, and expanding its cloud segment. Government policies aimed at boosting domestic demand also provide support. Risks remain tied to China’s economic slowdown and fierce competition from Alibaba and PDD, but at current levels the stock looks attractive for long-term investors.
Technically, the 4H chart shows a breakout of the descending trendline and the formation of a golden cross (50 EMA crossing above 200 EMA), confirming a medium-term trend shift. Price has consolidated above the accumulation zone and is now testing $34.50–35.00. If momentum holds, the next upside targets are $41.00 and $46.00, key resistance levels. A more conservative scenario involves a pullback toward $33.00–32.50, followed by another upward leg.
This is exactly the kind of market situation where investor expectations diverge from reality, and the longer it lasts the more it seems like a trend reversal is near. But as always, emotions must be set aside and clear signals awaited before committing.
Exchange Rate Volatility vs. Stability in World MarketsThe Concept of Exchange Rates
An exchange rate is the value of one currency expressed in terms of another. For example, if 1 U.S. dollar (USD) equals 83 Indian rupees (INR), the USD/INR rate is 83.
Types of Exchange Rate Systems
Fixed exchange rate: A currency is pegged to another (e.g., USD pegged to gold under Bretton Woods, or the Hong Kong dollar pegged to USD).
Floating exchange rate: The currency value is determined by supply and demand in forex markets (e.g., USD, EUR, JPY).
Managed float: A hybrid where central banks intervene occasionally to reduce extreme volatility (e.g., India, China).
The choice of system heavily influences whether a country experiences volatility or stability.
Exchange Rate Volatility vs. Stability
Volatility: Large, unpredictable swings in currency values over short periods. For instance, if the British pound moves from 1.20 to 1.30 per USD in a few weeks, that’s volatile.
Stability: Predictable, small movements over time, often maintained by policy interventions. For instance, the Saudi riyal’s peg to USD has kept it stable for decades.
In reality, most currencies lie on a spectrum between volatility and stability. The degree depends on economic fundamentals, policy frameworks, and global conditions.
Historical Examples
The 1997 Asian Financial Crisis: Currencies in Thailand, Indonesia, and South Korea collapsed when investors lost confidence, highlighting dangers of volatility.
The Eurozone Stability (1999–present): By adopting the euro, member countries reduced volatility among themselves but transferred adjustment risks to a shared monetary system.
Swiss Franc Shock (2015): When Switzerland abandoned its euro peg, the franc surged 30% in one day — a classic case of sudden volatility.
Turkey (2018–2023): Chronic inflation and unorthodox policies created extreme lira volatility, scaring off investors.
Causes of Exchange Rate Volatility
Macroeconomic fundamentals: Inflation, growth, interest rate differentials.
Monetary policy shifts: Central bank rate hikes or cuts often move currencies sharply.
Trade balances: Deficits can weaken a currency, surpluses strengthen it.
Political instability: Elections, wars, sanctions, and coups cause sudden volatility.
Speculation and capital flows: Hedge funds and carry trades can amplify swings.
Global shocks: Oil crises, pandemics, or financial collapses ripple across forex markets.
Benefits of Exchange Rate Volatility
While volatility often carries risks, it is not purely negative.
Efficient price discovery: Volatility reflects real-time changes in fundamentals.
Flexibility for adjustment: Floating currencies can adjust to shocks (e.g., absorbing oil price increases).
Profit opportunities: Traders and investors benefit from arbitrage and hedging strategies.
Encourages discipline: Countries with poor policies face currency depreciation, which pressures reforms.
Risks of Exchange Rate Volatility
Trade uncertainty: Exporters/importers cannot predict costs, discouraging trade.
Investment risk: Foreign investors fear sudden losses due to currency depreciation.
Debt crises: If debt is in foreign currency, volatility can raise repayment costs dramatically.
Inflation pass-through: A falling currency makes imports expensive, fueling inflation.
Financial instability: Volatility can spark capital flight and banking crises.
Benefits of Exchange Rate Stability
Predictability for trade and investment: Businesses can plan long-term without worrying about currency swings.
Investor confidence: Stable currencies attract foreign direct investment.
Monetary discipline: Pegs force countries to align policies with anchor currencies.
Inflation control: Pegging to a stable currency helps control domestic inflation.
Risks of Exchange Rate Stability
Loss of flexibility: Pegged systems cannot adjust to shocks, leading to painful crises.
Speculative attacks: Maintaining stability invites hedge funds to test central banks (e.g., George Soros vs. Bank of England, 1992).
Hidden imbalances: Stability can hide structural weaknesses until they break suddenly.
Dependence on reserves: Countries need large forex reserves to maintain stability, which is costly.
Role of Central Banks and International Institutions
Central banks:
Use interest rates, interventions, and forward contracts to reduce volatility.
Sometimes allow controlled depreciation to maintain competitiveness.
IMF:
Provides emergency funding for countries in currency crises.
Promotes exchange rate stability through surveillance and policy advice.
Regional systems:
The euro stabilizes intra-European rates.
Asian countries hold large reserves to self-insure against volatility after the 1997 crisis.
Impact on Global Trade and Investment
Volatility reduces global trade by 5–10%, according to empirical studies, as exporters face uncertainty.
Stable currencies encourage long-term contracts, supply chains, and cross-border investment.
Multinationals hedge volatility through derivatives, but small firms often cannot, making stability more valuable for them.
Exchange rate regimes influence foreign direct investment: investors prefer predictable environments.
Current Trends (2025 Context)
U.S. dollar dominance: Despite de-dollarization talk, USD remains the anchor of global stability.
Rising multipolarity: Yuan, euro, and rupee are gradually gaining share, creating more currency blocs.
Geopolitical volatility: Wars, sanctions, and U.S.–China rivalry add new shocks.
Digital currencies & CBDCs: These may reduce transaction costs and volatility in cross-border trade.
AI & algorithms: Automated trading amplifies short-term volatility, but also deepens liquidity.
Climate and commodity shocks: Energy transitions and climate risks drive new volatility patterns.
Conclusion
Exchange rate volatility and stability are two sides of the same coin in world markets. Volatility provides flexibility and adjustment, while stability creates predictability and confidence. Neither extreme is ideal: too much volatility destroys trust, while too much artificial stability builds unsustainable pressures.
The challenge for policymakers, businesses, and investors is to manage this delicate balance. Central banks must allow enough flexibility for currencies to reflect fundamentals, while cushioning extreme shocks. International institutions must provide backstops against crises. Businesses must hedge risks, and investors must recognize the trade-offs.
As the world moves toward a more multipolar currency system, with digital innovations and geopolitical uncertainty reshaping forex dynamics, the question of volatility vs. stability will remain central. The future of trade, growth, and global financial stability depends on getting this balance right.
Multinational Corporations (MNCs) & Their Impact on Global TradiHistorical Evolution of MNCs in Global Trade
Early Forms (Pre-19th Century):
Trading companies like the British East India Company and Dutch East India Company (VOC) in the 17th century were precursors of modern MNCs.
These entities controlled trade routes, natural resources, and colonies, combining commercial with quasi-governmental powers.
They were central to early globalization, particularly in spices, textiles, and precious metals.
Industrial Revolution (19th Century):
Rise of steamships, railways, and telegraphs facilitated international business expansion.
Companies like Singer Sewing Machine and Coca-Cola began setting up operations in multiple countries.
Access to new markets and raw materials became driving forces.
20th Century Expansion:
Post-WWII era saw unprecedented growth in MNC activity.
Organizations like the World Bank, IMF, and GATT/WTO created favorable conditions for cross-border trade.
Automotive companies (Ford, Toyota), pharmaceuticals (Pfizer, Novartis), and oil firms grew into global giants.
21st Century Globalization & Digital Age:
MNCs now dominate global trade through sophisticated supply chains and digital platforms.
Technology firms like Amazon, Google, Meta, and Alibaba reshape e-commerce and services.
The scale and influence of MNCs rival those of many nation-states.
MNCs’ Role in Shaping Global Trade
1. Expansion of Global Markets
MNCs increase trade volumes by producing goods in one country and selling them in another. For instance:
Apple designs in the U.S., manufactures in China, and sells globally.
Nestlé sources raw materials from Africa, processes them in Europe, and distributes worldwide.
This multiplies cross-border flows of goods, services, and intellectual property.
2. Creation of Global Supply Chains
MNCs pioneered the idea of fragmented production. A single product may pass through 10–15 countries before reaching consumers.
Example: A smartphone’s chips from Taiwan, software from the U.S., assembly in Vietnam, packaging in China, and final sales in India.
This supply chain structure makes global trade deeply interconnected.
3. Foreign Direct Investment (FDI)
MNCs contribute significantly to global trade through FDI, where they invest in factories, offices, or infrastructure abroad.
FDI increases production capacity and export potential.
Countries like India, Vietnam, and Mexico attract MNCs for low-cost production and skilled labor.
4. Technology Transfer
MNCs carry cutting-edge technologies across borders, fostering industrial upgrades in host nations.
For example, Toyota’s lean manufacturing system spread globally, revolutionizing efficiency.
Tech giants bring digital innovations to developing economies.
5. Employment Generation & Skill Development
MNCs provide millions of jobs in host countries and train local workforces in global standards.
BPOs in India (Infosys, Accenture, IBM) boosted IT-enabled services exports.
Manufacturing hubs in Southeast Asia thrive because of MNC-driven employment.
6. Influence on Trade Policies
MNCs lobby governments for trade liberalization, favorable tax regimes, and investment treaties.
WTO and regional trade agreements are shaped significantly by corporate interests.
They encourage reduction of tariffs, opening markets for goods and services.
Positive Impacts of MNCs on Global Trading
1. Increased Efficiency & Lower Costs
MNCs exploit comparative advantages across countries—cheaper labor in Asia, advanced R&D in Europe, or abundant resources in Africa.
This leads to cost efficiency, making products affordable globally.
2. Market Expansion for Developing Nations
Countries gain access to international markets by integrating into MNC supply chains.
Example: Vietnam emerged as a textile and electronics hub thanks to MNC-led exports.
3. Enhanced Consumer Choices
Consumers worldwide enjoy diverse products—from Starbucks coffee to Samsung phones—reflecting cultural and trade interconnections.
4. Rising Standards of Living
Jobs created by MNCs, along with affordable goods, enhance purchasing power and lifestyles in host countries.
5. Stimulation of Competition
MNC entry often forces domestic firms to innovate, improve efficiency, and adopt international best practices.
Negative Impacts of MNCs on Global Trading
1. Economic Dependence & Vulnerability
Host nations may become overly dependent on MNCs for exports and employment.
Example: Mexico’s reliance on U.S. auto firms makes its trade highly vulnerable to U.S. policy changes.
2. Unequal Power Relations
MNCs sometimes exploit weak regulatory systems, extracting resources without fair returns to host nations.
Oil and mining companies in Africa often face criticism for resource exploitation.
3. Cultural Homogenization
Global brands replace local products, diluting cultural uniqueness.
McDonaldization or Coca-Colonization symbolizes cultural dominance.
4. Tax Avoidance & Profit Shifting
MNCs use complex accounting methods to shift profits to low-tax jurisdictions.
Example: Google and Apple have faced criticism for using tax havens.
5. Environmental Challenges
Global production driven by MNCs often leads to pollution, deforestation, and carbon emissions.
Fashion MNCs contribute significantly to fast fashion waste and water pollution.
6. Labor Exploitation
MNCs are accused of paying low wages, unsafe working conditions, and exploiting cheap labor.
Sweatshops in Southeast Asia producing garments for Western brands are prime examples.
MNCs and the Future of Global Trade
Digital Globalization:
E-commerce, cloud services, and fintech expand trade without traditional borders.
Geopolitical Tensions:
U.S.-China trade war shows MNCs must adapt supply chains to political risks.
Sustainability Pressure:
ESG (Environmental, Social, Governance) standards are pushing MNCs to adopt greener practices.
Technological Disruption:
AI, automation, and blockchain reshape trade operations, logistics, and transparency.
Deglobalization Trends:
Some countries are reshoring industries, reducing reliance on foreign supply chains.
MNCs must balance globalization with localization strategies.
Conclusion
Multinational Corporations are at the heart of global trade. They are engines of growth, technology transfer, and cultural exchange, but they also raise questions about fairness, sustainability, and sovereignty. As global trading continues to evolve in the 21st century, MNCs will remain both drivers and disruptors. Their influence is likely to increase as technology erases borders, but they must balance profit with responsibility.
Ultimately, the future of global trading will be shaped not only by governments and international institutions but also by the strategies, ethics, and adaptability of MNCs. Their choices will determine whether globalization leads to inclusive prosperity or deepening divides.

Globalization vs. Deglobalization Debate in the World MarketUnderstanding Globalization
Globalization can be defined as the process of increasing interdependence and interconnectedness among countries in economic, political, cultural, and technological dimensions. In markets, it primarily manifests as:
Free Trade Expansion – Removal of tariffs, quotas, and trade restrictions.
Global Supply Chains – Companies outsourcing production to countries with cost advantages.
Cross-Border Investments – Growth of foreign direct investment (FDI) and multinational corporations (MNCs).
Financial Integration – Capital moving across borders through stock markets, banks, and investment funds.
Technology & Communication – Internet and digitalization connecting producers, consumers, and investors worldwide.
Globalization surged after the Cold War (1990s onward), when liberalization and deregulation policies spread across emerging markets. Institutions like the World Trade Organization (WTO), International Monetary Fund (IMF), and World Bank promoted cross-border economic integration. The rise of China as the world’s factory, India’s IT revolution, and global consumer brands like Apple, Toyota, and Samsung are products of globalization.
Understanding Deglobalization
Deglobalization refers to the deliberate reduction of interdependence between nations in trade, investment, and financial flows. Instead of expanding global linkages, countries adopt policies that bring economic activities closer to home. It manifests as:
Trade Protectionism – Tariffs, quotas, and restrictions on imports.
National Industrial Policies – Encouraging domestic manufacturing (e.g., “Make in India,” “America First”).
Supply Chain Re-shoring – Companies moving production back to home countries or nearby regions.
Geopolitical Rivalries – Economic sanctions, tech wars, and restricted access to markets.
Financial Decoupling – Limiting cross-border capital exposure to reduce vulnerability.
Deglobalization does not imply complete isolation but rather a recalibration of global connections. It gained momentum post-2008 financial crisis, accelerated during COVID-19 when countries realized the risks of overdependence on global supply chains, and strengthened further with geopolitical conflicts like the Russia-Ukraine war.
Historical Evolution of Globalization & Deglobalization
The globalization-deglobalization cycle is not entirely new.
First Wave of Globalization (1870–1914): Fueled by industrial revolution, railroads, shipping, and colonialism. Trade flourished until World War I disrupted global markets.
First Wave of Deglobalization (1914–1945): Wars, the Great Depression, and protectionist policies (e.g., Smoot-Hawley Tariff in the US) restricted global trade.
Second Wave of Globalization (1945–1980s): Post-WWII reconstruction, Bretton Woods system, and the spread of liberal economic policies.
Third Wave of Globalization (1990–2008): Collapse of the Soviet Union, rise of China, internet boom, global outsourcing, and trade liberalization.
Second Wave of Deglobalization (2008–Present): Financial crises, populism, technological nationalism, environmental concerns, and supply chain reconfiguration.
Thus, globalization and deglobalization are not absolute opposites but phases of world economic history.
Globalization: Benefits and Challenges
Benefits:
Economic Growth: Expanding markets allow countries to specialize and scale production.
Lower Costs: Outsourcing and supply chains reduce production costs for consumers.
Innovation & Technology Transfer: Global collaboration accelerates knowledge sharing.
Access to Capital: Emerging economies benefit from FDI and portfolio investments.
Cultural Exchange: Travel, media, and education foster cross-cultural connections.
Challenges:
Job Displacement: Outsourcing leads to unemployment in high-cost economies.
Income Inequality: Benefits unevenly distributed between nations and social groups.
Environmental Damage: Global supply chains increase carbon emissions.
Financial Vulnerability: Global crises spread rapidly (2008, 2020).
Cultural Homogenization: Local cultures risk being overshadowed by global brands.
Deglobalization: Benefits and Challenges
Benefits:
Domestic Industry Protection: Safeguards jobs and industries from global shocks.
Supply Chain Resilience: Reduces vulnerability to disruptions.
National Security: Greater control over critical industries (food, energy, defense).
Environmental Gains: Local production may cut transport-related emissions.
Balanced Global Order: Prevents excessive dependence on a few countries (e.g., China).
Challenges:
Higher Costs: Localized production increases consumer prices.
Reduced Innovation: Less collaboration slows technological progress.
Market Fragmentation: Trade restrictions reduce efficiency of global systems.
Risk of Retaliation: Trade wars harm exporters and global supply chains.
Slower Global Growth: Reduced trade and capital flows hinder overall prosperity.
Impact on World Markets
Trade Volumes: WTO data shows slowing global trade growth since 2015.
Stock Markets: Globalization increases correlation across markets; deglobalization creates divergence.
Commodities: Oil, gas, and food supplies disrupted by geopolitical tensions.
Currencies: Dollar dominance challenged by yuan, euro, and alternative payment systems (de-dollarization debates).
Corporate Strategies: Multinationals now adopt “China+1” strategy to diversify manufacturing bases.
Future Outlook: Convergence or Divergence?
Not the End of Globalization: Rather than collapse, globalization is restructuring.
Selective Deglobalization: Nations are decoupling in strategic sectors (defense, tech, energy) while still integrating in consumer goods and services.
Regionalization: Global supply chains are evolving into regional blocs (USMCA, EU, RCEP).
Digital Globalization: Data, AI, and digital finance will shape future trade flows.
Sustainable Globalization: Green energy, climate agreements, and ESG investments may form a new framework.
Conclusion
The globalization vs. deglobalization debate is not about one force replacing the other but about how the balance shifts over time. Globalization brought unprecedented prosperity, technological progress, and interconnectedness, but it also exposed vulnerabilities such as inequality, overdependence, and fragility of global systems. Deglobalization responds to these weaknesses, yet it risks reversing gains made over decades.
In reality, the world is likely moving toward a hybrid model—“re-globalization” or “regional globalization”—where countries remain interconnected but with greater safeguards, diversification, and focus on self-reliance. The future world market will not be flat, as Thomas Friedman once wrote, but rather fragmented yet interconnected, shaped by geopolitics, technology, and sustainability imperatives.
Risk, Psychology & Performance in Global MarketsPart 1: Risk in Global Markets
1.1 Understanding Risk
In financial terms, risk refers to the probability of losing money or failing to achieve expected returns. Global markets face multiple layers of risk, such as:
Market Risk: The risk of losses due to fluctuations in stock prices, interest rates, currencies, or commodities.
Credit Risk: The possibility that a borrower defaults on debt.
Liquidity Risk: Difficulty in buying/selling assets without affecting their price.
Operational Risk: Failures in systems, processes, or human errors.
Geopolitical Risk: Wars, sanctions, trade disputes, or policy changes.
Systemic Risk: Collapse of interconnected institutions, like the 2008 financial crisis.
Each of these risks interacts differently depending on global conditions. For instance, rising U.S. interest rates strengthen the dollar, creating ripple effects in emerging markets, where currencies may depreciate and capital outflows increase.
1.2 Measuring Risk
Several tools and models measure financial risk:
Value at Risk (VaR): Estimates the maximum potential loss over a certain period with a given confidence level.
Beta Coefficient: Measures stock volatility relative to the overall market.
Stress Testing: Simulates extreme scenarios (e.g., oil at $200 or a sudden war).
Risk-Adjusted Metrics: Like the Sharpe ratio (return vs. volatility) and Sortino ratio (downside risk).
But risk is not just statistical; it is perceived differently across regions and cultures. A European fund manager may worry about ECB monetary policy, while an Asian investor may focus on currency volatility.
1.3 Risk Management Strategies
Global investors adopt multiple approaches:
Diversification: Spreading assets across regions, sectors, and instruments.
Hedging: Using derivatives (options, futures, swaps) to limit downside.
Position Sizing: Allocating only a portion of capital per trade to limit losses.
Stop-Loss Orders: Automatic triggers to exit positions when losses exceed a threshold.
Macro Hedging: Large funds may hedge exposure to entire regions or asset classes.
An important truth: risk can be managed, but never eliminated. The 2008 financial crisis, COVID-19 crash, and Russia-Ukraine war prove that unforeseen shocks can disrupt even the most sophisticated models.
Part 2: Psychology in Global Markets
2.1 Human Behavior and Trading
While quantitative models dominate headlines, human psychology drives global markets more than numbers. Investors are emotional beings, influenced by fear, greed, hope, and regret.
This is why markets often deviate from fundamentals. During bubbles (dot-com in 2000, housing in 2008, or cryptocurrencies in 2021), prices rise far above intrinsic value due to herd mentality. Conversely, panic selling during crashes can push prices far below fair value.
2.2 Behavioral Finance Theories
Prospect Theory (Kahneman & Tversky): People fear losses more than they value equivalent gains — a $100 loss feels worse than a $100 gain feels good.
Herd Behavior: Investors follow the crowd, assuming others know better.
Overconfidence Bias: Traders overestimate their skills, leading to excessive risk-taking.
Anchoring: Relying too much on initial information, like a stock’s IPO price.
Confirmation Bias: Seeking information that supports existing beliefs while ignoring contrary evidence.
Global markets are full of such psychological traps. For example, in 2020, when oil prices went negative for the first time, many retail traders underestimated risks and held losing positions, driven by hope of a quick rebound.
2.3 Emotions in Trading
The two strongest emotions in trading are:
Fear: Leads to panic selling, hesitation, and missed opportunities.
Greed: Encourages over-leveraging, chasing trends, and holding on too long.
Successful global traders learn to master these emotions. The key is not eliminating them (which is impossible) but managing and channeling them into rational decision-making.
2.4 Psychological Challenges in Global Markets
Information Overload: With 24/7 global markets, traders face endless news, data, and rumors. Filtering is essential.
Time Zone Stress: Global traders deal with Asian, European, and U.S. sessions, often leading to fatigue.
Cultural Differences: Risk tolerance varies by region; for example, U.S. traders are often more aggressive than Japanese institutional investors.
Uncertainty Fatigue: Continuous shocks (pandemics, wars, elections) can create stress and cloud judgment.
2.5 Building Mental Strength
To succeed in global markets, traders must build psychological resilience:
Discipline: Following a trading plan and avoiding impulsive actions.
Patience: Waiting for high-probability setups instead of chasing every move.
Emotional Regulation: Techniques like meditation, journaling, or structured routines.
Learning from Losses: Viewing mistakes as tuition fees for education.
Part 3: Performance in Global Markets
3.1 Defining Performance
Performance in markets is not just about absolute profits. It involves risk-adjusted returns, consistency, and sustainability.
For example:
A trader who makes 20% with controlled risk is performing better than one who makes 40% but risks everything.
Institutions are judged by their ability to generate alpha (returns above the benchmark).
3.2 Performance Metrics
Global investors use multiple measures:
Sharpe Ratio: Return vs. volatility.
Alpha & Beta: Outperformance relative to the market.
Max Drawdown: Largest peak-to-trough loss.
Win Rate vs. Risk-Reward Ratio: High win rates are useless if losses exceed gains.
Annualized Returns: Long-term performance consistency.
3.3 Performance Drivers
Performance in global markets depends on:
Knowledge: Understanding global economics, geopolitics, and industry cycles.
Execution: Timing trades and managing entries/exits.
Technology: Use of AI, algorithms, and big data for competitive edge.
Psychological Stability: Avoiding impulsive mistakes.
Risk Management: Limiting losses to survive long enough to benefit from winners.
3.4 Institutional vs. Retail Performance
Institutional Investors: Hedge funds, sovereign wealth funds, and pension funds have resources, research, and advanced tools, but are constrained by size and regulations.
Retail Traders: More flexible and agile, but prone to overtrading and psychological traps.
Both must balance risk, psychology, and performance — though in different ways.
Conclusion
Risk, psychology, and performance are the three pillars of global market participation.
Risk reminds us that uncertainty is inevitable and must be managed wisely.
Psychology teaches us that emotions shape markets more than numbers.
Performance highlights that success lies not in short-term gains but in consistent, risk-adjusted returns.
The integration of these factors is what separates amateurs from professionals, and short-term winners from long-term survivors.
As global markets evolve with technology, geopolitics, and changing investor behavior, mastering these three elements will remain the ultimate edge for traders and investors worldwide.

Exchange-Traded Funds (ETFs) & Index TradingPart I: Understanding Exchange-Traded Funds (ETFs)
1. What are ETFs?
An Exchange-Traded Fund (ETF) is an investment vehicle that holds a basket of assets—such as stocks, bonds, commodities, or currencies—and trades on stock exchanges like a single stock.
Structure: ETFs are designed to track the performance of an underlying index, sector, commodity, or strategy.
Trading: Unlike mutual funds (which are priced once a day), ETFs trade continuously throughout the trading day, with prices fluctuating based on supply and demand.
Flexibility: ETFs can be bought and sold just like stocks, enabling short-selling, margin trading, and intraday strategies.
In essence, ETFs combine the diversification of mutual funds with the flexibility of stocks.
2. History and Evolution of ETFs
The first ETF, SPDR S&P 500 ETF Trust (SPY), was launched in 1993 in the United States. It aimed to track the S&P 500 Index, giving investors exposure to the 500 largest U.S. companies in a single instrument.
Since then, the ETF industry has exploded globally:
1990s: Launch of broad-market ETFs (SPY, QQQ).
2000s: Expansion into sector-based and international ETFs.
2010s: Rise of smart beta and thematic ETFs (e.g., clean energy, robotics, AI).
2020s: Growth in actively managed ETFs, ESG-focused ETFs, and crypto ETFs (like Bitcoin futures ETFs).
Today, ETFs account for trillions of dollars in global assets under management (AUM), making them one of the fastest-growing investment products.
3. Types of ETFs
ETFs come in different forms to suit various investor needs:
Equity ETFs – Track stock indices like S&P 500, Nifty 50, Nasdaq-100.
Bond ETFs – Provide exposure to government, corporate, or municipal bonds.
Commodity ETFs – Track commodities like gold, silver, or oil.
Currency ETFs – Track currency movements (e.g., U.S. Dollar Index ETF).
Sector & Industry ETFs – Focus on sectors like technology, healthcare, or banking.
International & Regional ETFs – Give exposure to markets like China, Europe, or emerging markets.
Inverse & Leveraged ETFs – Provide magnified or opposite returns of an index (used for short-term trading).
Thematic ETFs – Target specific investment themes (renewable energy, AI, blockchain).
Actively Managed ETFs – Managed by fund managers who actively pick securities.
4. How ETFs Work (Mechanics)
ETFs use a creation and redemption mechanism to keep their market price close to the net asset value (NAV).
Authorized Participants (APs): Large institutions that create or redeem ETF shares.
Creation: APs deliver a basket of securities to the ETF provider in exchange for new ETF shares.
Redemption: APs return ETF shares and receive the underlying securities.
This arbitrage mechanism ensures that ETF prices remain close to the value of their underlying assets.
5. Advantages of ETFs
Diversification – Exposure to hundreds of securities in one trade.
Liquidity – Trade throughout the day on exchanges.
Cost Efficiency – Lower expense ratios compared to mutual funds.
Transparency – Daily disclosure of holdings.
Flexibility – Options, margin trading, and short-selling available.
Tax Efficiency – Creation/redemption process reduces taxable distributions.
6. Disadvantages of ETFs
Trading Costs – Brokerage fees and bid-ask spreads can add up.
Tracking Error – ETFs may not perfectly track their underlying index.
Overtrading Risk – Intraday liquidity may encourage speculative behavior.
Leverage & Inverse ETFs Risks – Can lead to significant losses if misunderstood.
Concentration in Popular Sectors – Certain thematic ETFs may be too niche or volatile.
Part II: Index Trading
1. What is an Index?
An index is a statistical measure representing the performance of a group of securities. Examples:
S&P 500 (USA): 500 largest U.S. companies.
Nifty 50 (India): 50 largest companies listed on NSE.
Dow Jones Industrial Average: 30 U.S. blue-chip companies.
Indices serve as benchmarks to measure market or sector performance.
2. What is Index Trading?
Index trading refers to trading financial products based on stock market indices rather than individual stocks.
Investors trade:
Index Futures – Contracts based on future value of an index.
Index Options – Options contracts linked to indices.
ETFs & Index Funds – Indirect way to trade indices.
CFDs (Contracts for Difference): Widely used in global markets.
3. Why Trade Indices?
Diversification – Exposure to entire markets or sectors.
Hedging – Protect portfolios from market downturns.
Speculation – Bet on broad market movements.
Benchmarking – Compare portfolio performance against indices.
4. Popular Global Indices
USA: S&P 500, Nasdaq-100, Dow Jones.
India: Nifty 50, Sensex, Bank Nifty.
Europe: FTSE 100 (UK), DAX 40 (Germany), CAC 40 (France).
Asia: Nikkei 225 (Japan), Hang Seng (Hong Kong), Shanghai Composite (China).
5. Strategies in Index Trading
Buy-and-Hold Strategy: Long-term investment in index ETFs.
Swing Trading: Trading short-to-medium-term index price movements.
Hedging: Using index futures to hedge stock portfolios.
Arbitrage: Exploiting mispricing between futures, ETFs, and underlying stocks.
Sector Rotation: Moving investments between indices/sectors depending on the economic cycle.
Options Strategies: Using index options for spreads, straddles, or covered calls.
Part III: ETFs vs. Index Funds vs. Index Trading
ETFs – Trade on exchanges, intraday pricing, lower costs.
Index Funds – Mutual funds tracking indices, priced once daily.
Index Trading (Futures/Options) – Derivatives-based, high leverage, short-term focus.
Example:
Long-term investor → Index Fund or ETF.
Active trader → Index futures, options, or leveraged ETFs.
Part IV: Risks in ETFs & Index Trading
Market Risk – Both ETFs and indices reflect market movements.
Liquidity Risk – Low-volume ETFs may have wide spreads.
Tracking Error – ETFs may deviate from index returns.
Leverage Risk – Amplified losses in leveraged ETFs/futures.
Currency Risk – International ETFs affected by forex fluctuations.
Concentration Risk – Indices may be dominated by a few large companies (e.g., FAANG in S&P 500).
Part V: ETFs & Index Trading in India
India has seen tremendous growth in ETFs and index trading:
Popular ETFs: Nippon India ETF Nifty BeES, SBI ETF Nifty Bank, ICICI Prudential Nifty Next 50 ETF.
Gold ETFs: Widely used as an alternative to physical gold.
Sector ETFs: Banking, IT, PSU ETFs gaining traction.
Index Futures/Options: Nifty 50 and Bank Nifty derivatives dominate NSE trading volumes.
Government and institutional investors (like EPFO) also allocate large sums to ETFs, boosting the industry further.
Part VI: Future of ETFs & Index Trading
Rise of Thematic & ESG ETFs – Growth in socially responsible investing.
Active ETFs – Managers offering active strategies via ETFs.
Crypto ETFs – Bitcoin and Ethereum ETFs expanding.
Tokenization & Blockchain ETFs – Future of transparent, decentralized ETF structures.
AI-driven Index Construction – Smart beta indices built using machine learning.
Conclusion
Exchange-Traded Funds (ETFs) and Index Trading have reshaped the way investors approach financial markets. They offer simplicity, diversification, transparency, and cost-effectiveness, making them ideal for both beginners and professionals.
ETFs provide access to a wide range of assets, from equities and bonds to commodities and currencies.
Index trading allows traders to speculate, hedge, or invest in entire markets rather than individual stocks.
Together, they represent the future of investing: efficient, scalable, and adaptable to changing global market trends.
Global Index TradingIntroduction
Global financial markets are deeply interconnected. From the bustling streets of New York to the trading floors in Tokyo, stock markets react not just to domestic events but also to global developments. Investors often find it overwhelming to track thousands of individual stocks across different countries. This is where global indices come in.
Global indices—such as the S&P 500, Dow Jones, NASDAQ, FTSE 100, Nikkei 225, Hang Seng, and DAX—act as benchmarks that represent the performance of a basket of leading companies in a region or sector. Instead of focusing on a single stock, traders can participate in the performance of an entire economy, sector, or region by trading indices.
Global index trading has grown rapidly due to its simplicity, diversification benefits, and ability to capture worldwide economic movements. Whether through futures, ETFs, CFDs, or options, traders can speculate or hedge using indices.
This article explores what index trading is, how it works, its strategies, risks, advantages, and future trends, giving you a complete 360° understanding.
What is an Index?
An index is a statistical measure that tracks the performance of a group of assets. In financial markets, stock indices track a basket of company stocks.
For example:
S&P 500 → Tracks 500 largest US-listed companies.
Nikkei 225 → Represents 225 blue-chip companies listed in Japan.
FTSE 100 → Covers 100 top UK companies listed on the London Stock Exchange.
DAX 40 → Represents 40 major German companies.
By trading these indices, investors gain exposure to entire markets instead of picking individual stocks.
Why Trade Global Indices?
Diversification → Instead of betting on one company, you’re trading the collective performance of many.
Global Exposure → Access to markets worldwide (US, Europe, Asia).
Liquidity → Indices are highly traded, ensuring smooth entry and exit.
Transparency → Indices reflect real-time global economic conditions.
Opportunities in Both Directions → Traders can go long (buy) when bullish or short (sell) when bearish.
Hedging Tool → Investors hedge their portfolios against global uncertainties using index futures and options.
Major Global Indices
1. United States
Dow Jones Industrial Average (DJIA) → Tracks 30 blue-chip companies.
S&P 500 → Broadest and most followed US index (500 companies).
NASDAQ Composite → Tech-heavy index with over 3,000 companies.
2. Europe
FTSE 100 (UK) → UK’s top 100 companies.
DAX 40 (Germany) → German giants like BMW, Siemens, Allianz.
CAC 40 (France) → French market benchmark.
3. Asia-Pacific
Nikkei 225 (Japan) → Japan’s premier stock index.
Hang Seng (Hong Kong) → Reflects China’s corporate strength.
Shanghai Composite (China) → Mainland Chinese companies.
ASX 200 (Australia) → Australia’s top companies.
4. Emerging Markets
Nifty 50 (India) → India’s top 50 companies.
Bovespa (Brazil) → Brazil’s leading stock index.
RTS Index (Russia) → Russia’s blue-chip stocks.
These indices act as economic barometers, and traders worldwide monitor them daily.
How Global Index Trading Works
Trading indices isn’t about buying the index itself (since it’s just a number). Instead, traders use financial instruments tied to the index’s value:
Index Futures
Standardized contracts to buy/sell the index at a future date.
Example: S&P 500 futures.
Used by institutional investors for speculation and hedging.
Index Options
Provide the right (not obligation) to buy/sell indices at specific levels.
Useful for hedging against sudden market drops.
Exchange-Traded Funds (ETFs)
Funds that replicate index performance.
Example: SPY (S&P 500 ETF).
Suitable for long-term investors.
Contracts for Difference (CFDs)
Popular in retail trading.
Allow traders to speculate on index price movements without owning underlying assets.
Factors Influencing Global Indices
Index values fluctuate based on:
Economic Data
GDP growth, inflation, employment data.
Corporate Earnings
Quarterly earnings of large companies drive indices.
Central Bank Policies
Interest rate hikes or cuts (Fed, ECB, BOJ).
Geopolitical Events
Wars, trade disputes, elections.
Global Sentiment
Risk-on (bullish) vs. risk-off (bearish) moods.
Currency Movements
Strong/weak currencies affect export-driven companies.
Popular Strategies in Global Index Trading
Trend Following
Identify long-term trends and ride momentum.
Example: Buying NASDAQ during a tech boom.
Swing Trading
Capturing medium-term moves within global index cycles.
Day Trading / Scalping
Taking advantage of small intraday price fluctuations.
Hedging Strategies
Using index futures to protect portfolios during uncertainty.
Pairs Trading
Trade two correlated indices (e.g., long S&P 500 and short FTSE 100).
Arbitrage
Exploiting price inefficiencies between futures, ETFs, and spot indices.
Benefits of Global Index Trading
Simplicity: No need to analyze thousands of individual stocks.
Lower Volatility: Compared to single stocks, indices move more steadily.
Cost Efficiency: ETFs and CFDs allow exposure at low costs.
24-Hour Opportunities: With different time zones, global indices provide nearly round-the-clock trading.
Risks in Global Index Trading
Market Volatility
Events like COVID-19 caused sharp global index crashes.
Leverage Risk
Futures/CFDs use leverage, magnifying losses.
Systemic Risks
Global crises (2008 Financial Crash, 2020 Pandemic) affect all indices simultaneously.
Currency Risk
Non-domestic traders face forex risks.
Overexposure
Heavy index positions without proper diversification may backfire.
Case Studies of Global Index Movements
1. 2008 Global Financial Crisis
US housing bubble burst → Dow Jones & S&P 500 crashed 50%.
Global indices (Nikkei, FTSE, DAX) followed suit.
2. COVID-19 Pandemic (2020)
Panic selling → Dow fell 3,000 points in a day.
Stimulus packages → Strong rebound across all indices.
3. US Tech Boom (2010s)
NASDAQ outperformed due to Apple, Amazon, Google, Microsoft.
Tech indices became global growth drivers.
Tools & Platforms for Index Trading
MetaTrader (MT4/MT5)
Thinkorswim
Interactive Brokers
TradingView (for charting)
Bloomberg & Reuters (for news updates)
Future of Global Index Trading
Increased ETF Popularity → More passive index investments.
AI & Algo Trading → Automated strategies dominating global index flows.
Thematic Indices → ESG, clean energy, tech-focused indices growing.
Crypto Indices → Crypto-linked index trading gaining traction.
24/7 Trading → Expansion of round-the-clock index trading.
Tips for Beginners
Start with major indices (S&P 500, NASDAQ, DAX).
Use demo accounts before live trading.
Avoid over-leverage.
Follow global news & central bank updates.
Combine technical and fundamental analysis.
Conclusion
Global index trading offers a powerful, diversified, and accessible way to participate in financial markets. Instead of picking individual winners, traders can ride the economic waves of entire regions. While opportunities are vast, one must remain cautious of risks like leverage, volatility, and systemic crises.
For long-term investors, global index ETFs provide steady growth aligned with global economic progress. For traders, futures, options, and CFDs open doors to both speculative profits and hedging strategies.
In today’s interconnected world, global index trading is no longer optional—it’s essential for anyone looking to understand and profit from international financial markets.
Currency Pegs & Managed Exchange Rates1. Theoretical Background: Exchange Rate Systems
Before diving into pegs and managed exchange rates, it is essential to understand the spectrum of exchange rate arrangements.
Free-floating exchange rates
Determined entirely by supply and demand in the foreign exchange market.
No direct government or central bank intervention.
Example: U.S. dollar, Japanese yen, British pound.
Fixed exchange rates
Currency value is tied to another currency or a basket of currencies.
Requires constant intervention to maintain the fixed rate.
Example: Gold standard (historical), Hong Kong dollar peg to USD.
Intermediate systems
Includes currency pegs, crawling pegs, and managed floats.
Aim to combine stability with some degree of flexibility.
Most countries today operate in this middle ground.
Thus, currency pegs and managed exchange rates fall under the "intermediate" category—neither fully rigid nor fully market-determined.
2. Currency Pegs: Definition and Mechanism
A currency peg (also called a fixed exchange rate) is when a country’s central bank commits to maintaining its currency at a specific exchange rate relative to another major currency or basket.
How It Works:
The central bank monitors the foreign exchange market.
If the domestic currency depreciates below the peg, the central bank intervenes by selling foreign reserves (usually U.S. dollars or euros) and buying domestic currency to restore the peg.
If the domestic currency appreciates above the peg, the central bank buys foreign currency and sells domestic currency.
Maintaining the peg requires large reserves of foreign currency and tight monetary discipline.
Types of Pegs:
Hard Pegs
Currency is immovably fixed, sometimes legally.
Example: Currency board systems like in Hong Kong.
Soft Pegs
Fixed within a narrow band but adjustable under certain conditions.
Example: China before 2005 pegged the yuan to the U.S. dollar but adjusted occasionally.
Crawling Pegs
The peg is adjusted gradually, often in response to inflation or trade deficits.
Example: Several Latin American countries have used crawling pegs.
Historical Context
The most famous peg system was the Bretton Woods system (1944–1971), where most currencies were pegged to the U.S. dollar, which in turn was pegged to gold at $35 per ounce. This system collapsed when the U.S. could no longer maintain gold convertibility, leading to today’s diverse exchange rate regimes.
3. Managed Exchange Rates: Definition and Mechanism
A managed exchange rate (or dirty float) is a system where a currency is allowed to fluctuate according to market forces but with periodic government or central bank interventions.
Key Characteristics:
The exchange rate is not strictly fixed.
Central banks intervene to prevent excessive volatility or maintain competitiveness.
Intervention tools include:
Buying/selling foreign currency.
Adjusting interest rates.
Using capital controls.
Example:
China’s managed float system since 2005. The yuan is not entirely free-floating; the People’s Bank of China (PBoC) sets a daily reference rate and allows limited fluctuations within a band.
Why Managed Floats?
To avoid the instability of free-floating currencies.
To retain flexibility in adjusting to shocks.
To prevent speculative attacks common under rigid pegs.
4. Advantages of Currency Pegs
Stability in Trade & Investment
Pegs reduce exchange rate risk, encouraging foreign trade and investment.
Example: Hong Kong’s USD peg has attracted global businesses.
Inflation Control
Pegging to a stable currency can help reduce inflation in countries with weak monetary institutions.
Credibility for Developing Economies
Pegs provide a clear and transparent exchange rate target, increasing investor confidence.
Tourism & Remittances
Stable exchange rates benefit countries reliant on tourism and remittance inflows.
5. Disadvantages of Currency Pegs
Loss of Monetary Policy Independence
Central banks cannot freely adjust interest rates.
Domestic priorities like unemployment may be ignored.
Vulnerability to Speculative Attacks
If investors doubt the peg’s sustainability, massive speculative outflows can trigger a crisis.
Example: 1997 Asian Financial Crisis.
Requirement of Large Foreign Reserves
Maintaining a peg requires holding vast reserves, which is costly.
Importing Inflation/Deflation
Pegging to another currency means importing that country’s monetary policy.
6. Advantages of Managed Exchange Rates
Flexibility with Stability
Combines market-driven efficiency with government’s ability to smooth volatility.
Crisis Management Tool
Central banks can intervene during crises to stabilize the currency.
Helps Maintain Competitiveness
Countries can prevent their currencies from appreciating too much, supporting exports.
Avoids Extreme Currency Misalignments
Intervention reduces excessive swings caused by speculation or capital flows.
7. Disadvantages of Managed Exchange Rates
Uncertainty & Lack of Transparency
Since interventions are unpredictable, investors may face uncertainty.
Cost of Intervention
Frequent interventions require reserves and may distort the market.
Moral Hazard
Businesses may rely on government protection against currency fluctuations instead of proper risk management.
Political Manipulation
Governments may artificially keep currencies undervalued, leading to trade disputes.
Example: Accusations against China for "currency manipulation."
8. Case Studies
Case Study 1: Hong Kong Dollar Peg
Since 1983, pegged at HK$7.8 per USD.
Helped maintain Hong Kong as a financial hub.
However, limits monetary independence, especially during crises.
Case Study 2: Chinese Yuan (RMB)
Pre-2005: Strict peg to USD.
Post-2005: Managed float with a daily reference rate.
This allowed China to gradually internationalize the yuan and maintain export competitiveness.
Case Study 3: Argentina’s Currency Board (1991–2001)
Peso pegged 1:1 to USD to fight hyperinflation.
Initially successful, but eventually collapsed due to loss of competitiveness and inability to devalue.
Led to a severe financial crisis.
Case Study 4: Asian Financial Crisis (1997–98)
Many Southeast Asian economies had soft pegs to the dollar.
When investors lost confidence, speculative attacks forced massive devaluations.
Highlights the vulnerability of rigid or semi-rigid pegs without sufficient reserves.
9. Role of IMF and International Community
The IMF monitors exchange rate policies and provides support during crises.
It offers countries advice on choosing appropriate regimes depending on their structure.
For developing nations, IMF often recommends flexible systems to absorb shocks.
However, IMF-supported stabilization programs sometimes push countries toward pegs for credibility.
10. Modern Challenges
Globalization & Capital Mobility
Rapid capital flows make it harder to defend pegs.
Currency Wars
Countries may manipulate exchange rates for trade advantage, creating global tensions.
Dollar Dominance
Since many pegs are tied to the U.S. dollar, shifts in U.S. monetary policy have global spillovers.
Digital Currencies & Fintech
Central bank digital currencies (CBDCs) may transform exchange rate management in the future.
Conclusion
Currency pegs and managed exchange rate regimes are essential tools in global financial architecture. Pegs provide stability but sacrifice flexibility, often leading to crises if mismanaged. Managed exchange rates offer a middle path—allowing currencies to respond to market forces while enabling governments to intervene when necessary.
The choice of regime depends on a country’s economic structure, trade composition, inflation history, and policy credibility. There is no one-size-fits-all approach. For small, open economies reliant on trade, pegs can be beneficial. For larger, emerging markets, managed floats may provide the necessary balance. Ultimately, successful exchange rate management requires strong institutions, prudent policies, and adaptability in a constantly evolving global economy.

$XRP Breakout Loading: 20% Rally on the Horizon?CRYPTOCAP:XRP is showing strength after bouncing from a key support zone.
Price is pushing toward the descending trendline, and a breakout above it could trigger a 20% move toward $2.5376.
MACD is showing early bullish signs. Breakout watch is on!
DYRO, NFA

ANALYSISCRYPTOCAP:SOL is breaking below the blue support level! 🔵 If the breakdown continues, the next target will be the green line level. 📉
🎯 Target:
🔄 1️⃣ Green line level 🟩

SPY WEEKLY 24 FEB 2025Welcome to SPY Weekly. I have clearly explained the price action & momentum in this analysis.
If you have any doubts feel free to ask.
NOTE:DO NOT BLINDLY FOLLOW ANYONE

EUR/JPY Bearish Setup: Rejection from 200 EMAEUR/JPY 1H Analysis 📉📊
Bias: Bearish 🔻
This EUR/JPY 1-hour chart suggests a bearish setup with potential downside movement. Here’s a breakdown of key elements:
🔍 Key Observations:
200 EMA Resistance 🚨
Price is struggling below the 200 EMA (158.383), a strong dynamic resistance.
Bears are defending this area, preventing further upside.
Supply Zone (158.319 - 158.383) 🟥
Price recently rejected from this key resistance zone.
Sellers stepped in aggressively, pushing price lower.
Bearish Market Structure 📉
Lower highs and lower lows are forming, confirming the downtrend.
A potential retest of resistance before another drop.
RSI Indicating Weakness ⚠️
RSI (51.59) is below overbought levels and sloping downward.
The 56.02 resistance on RSI suggests limited buying strength.
📍 Trade Setup Idea:
Entry: Around 157.70 - 158.00 (Possible retest zone)
Target: 156.25 - 156.00 (Major support area) 🎯
Stop Loss: Above 158.40 to avoid fakeouts ❌
📌 Summary:
Bearish Bias 🚨 as long as price remains under 200 EMA.
Expect a pullback before continuation to the downside.
156.00 Target looks achievable if sellers maintain pressure.
⚡ Trade cautiously & manage risk properly! 🚀 Let me know if you need more details! 🔥

GBP/JPY 1-Hour Chart Analysis: Bearish Rejection at 200 EMA! 📊 GBP/JPY 1-Hour Chart Analysis 📉
1️⃣ Trend & Key Levels:
📌 Price is testing the 200 EMA (190.674), acting as resistance.
🔻 Recent price action shows a rejection at this level, suggesting bearish pressure.
2️⃣ Trade Setup (Possible Short Position) 💰:
Entry: Around 190.354 - 190.674 📍
Stop-Loss: Above 190.972 🚫
Take-Profit Target: Around 188.685 ✅
3️⃣ RSI Indicator (Momentum Check) 📉:
📊 RSI at 52.47 → Neutral, slightly bullish.
🔥 55.93 level shows price was overbought recently but is cooling down.
✅ Conclusion:
🔴 If price stays below 190.674, expect a drop toward 188.685.
🟢 If price breaks above 190.972, bullish momentum could continue.
