Tata Motors Ltd for 23rd Oct #TATAMOTORS Tata Motors Ltd for 23rd Oct #TATAMOTORS
Resistance 404-405 Watching above 405 for upside momentum.
Support area 398-400 Below 400 gnoring upside momentum for intraday
Watching below 398 for downside movement...
Above 404 ignoring downside move for intraday
Charts for Educational purposes only.
Please follow strict stop loss and risk reward if you follow the level.
Thanks,
V Trade Point
Tatamotors

Tata motors keep an eyeTatamotors seems to be creating a bottom and potentially can go upside from here.
its holding 50% fib levels, and seems to be creating a bottom over here

TATAMOTORS looks good for 740TATAMOTORS looks good for 740
Entry - 672.9
Stop loss - 666.65
Target - 740
Risk Reward - 1:10.7

TATA Motors Ltd for 6th Oct #TATAMOTORS TATA Motors Ltd for 6th Oct #TATAMOTORS
Resistance 720 Watching above 722 for upside momentum.
Support area 710 Below 710 gnoring upside momentum for intraday
Watching below 706 for downside movement...
Above 720 ignoring downside move for intraday
Charts for Educational purposes only.
Please follow strict stop loss and risk reward if you follow the level.
Thanks,
V Trade Point

TATAMOTORS looks good for 725Tatamotors long view
Entry - 666 (Triggered)
Stop loss - 657.7
Target - 725.25
Risk Reward - 1:7.14

Tata Motors – Multi-Month Base Breakout | Two Target Zones
Setup: After a steep downtrend, stock built a 6-month rectangle between 650–720.
Breakout Trigger: Price closed above 720 with a wide 5.6% range bar + volume surge.
Weekly Confirmation: Strong +8.2% weekly close at 728, above all key moving averages (20/50/200).
Momentum: Daily RSI >60, Weekly RSI >55 → regime shift from bear to bull.
Targets:
Short-Term (Rectangle Width)
Base width: ~70 pts → Target = 790–850
Risk–Reward: ~2–3:1
Mid-Term (Retracement to Breakdown Zone)
Previous breakdown zone ~1100
Projection points to 1050–1100 if trend extends
Risk–Reward: 5+:1
Risk Levels:
Breakout line: 720
Buffer support: 710
Invalidation: Weekly close <700
Summary:
Tata Motors has shifted from consolidation to breakout with both range expansion + volume confirmation . First leg targets 790–850. If sustained, larger swing move could unfold toward 1050–1100, retracing the prior breakdown zone.
Disclaimer: Educational technical analysis only, not financial advice. Always manage risk.

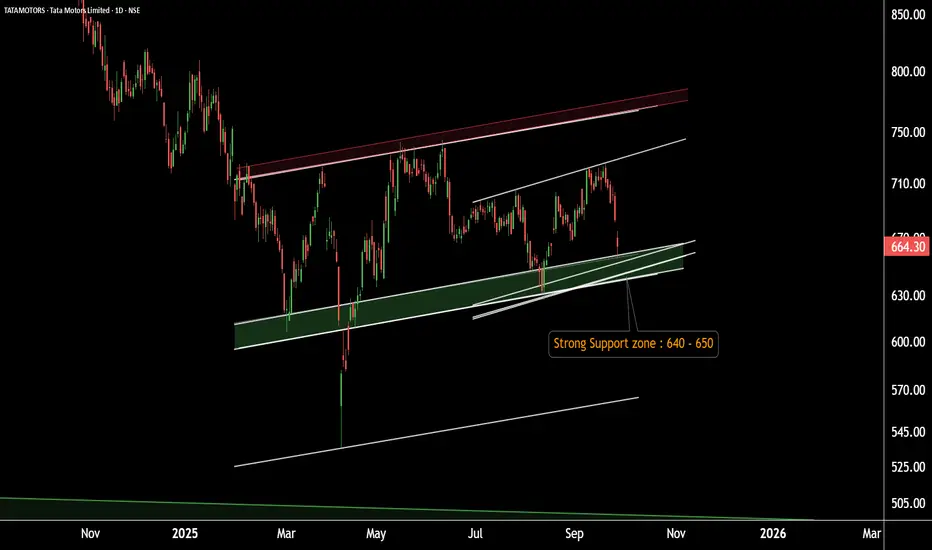
Tata Motors – Back at Key Support! Setting Up for the Next Bull.Tata Motors Daily Chart Update
Tata Motors is moving within a well-defined parallel channel, with a strong support zone around 630–650.
If this zone holds, the stock may see upward momentum.
Potential upside target: 730–740.
Thank you!
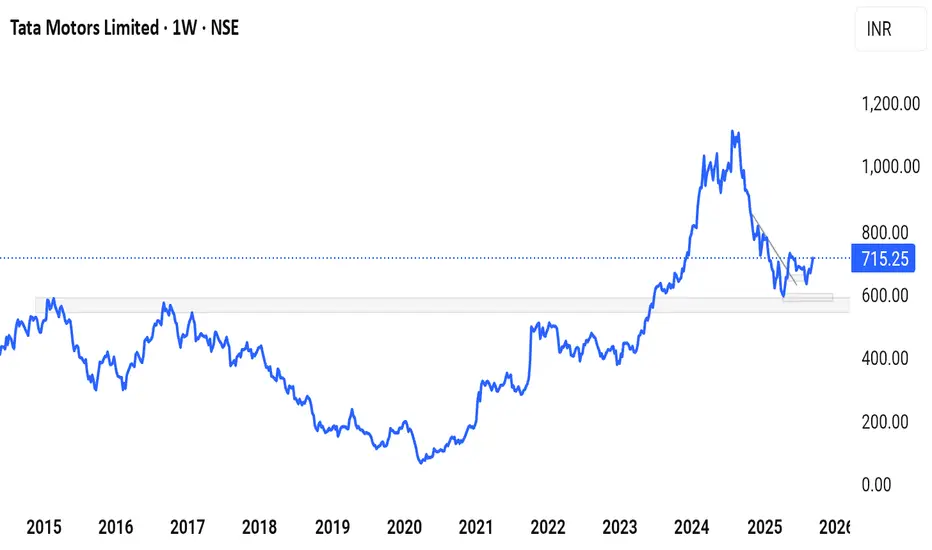
Is it ready to press buy on Tata Motors?
After Retracement from high, acting support from weekly chart
In daily chart,price breaks out from trendline while weekly support take control of it.
Waiting for patiently to grab buy opportunity when we get any forming pattern and proper risk management.
Regional & Country-Specific Global Markets1. North America
United States
The U.S. is the world’s largest economy and the beating heart of global finance. It hosts the New York Stock Exchange (NYSE) and NASDAQ, two of the biggest stock exchanges globally. The U.S. dollar serves as the world’s reserve currency, making American financial markets a benchmark for global trade and investment.
Strengths:
Deep and liquid capital markets
Technological innovation hubs (Silicon Valley, Boston, Seattle)
Strong consumer demand and advanced services sector
Risks:
High national debt levels
Political polarization affecting policy stability
Trade tensions with China and other countries
Key industries include technology, healthcare, energy, defense, and finance. U.S. policies on interest rates (through the Federal Reserve) ripple across every global market.
Canada
Canada’s economy is resource-heavy, with strengths in energy (oil sands, natural gas), mining (nickel, copper, uranium), and forestry. Toronto hosts a vibrant financial sector, and Canada’s stable political environment attracts global investors.
Strengths: Natural resources, stable banking sector
Challenges: Heavy reliance on U.S. trade, vulnerability to oil price swings
Mexico
As a bridge between North and Latin America, Mexico has growing manufacturing and automotive industries, heavily integrated with U.S. supply chains (especially under USMCA trade agreement). However, crime, corruption, and political risks remain concerns.
2. Europe
Europe is home to some of the world’s oldest markets and remains a global hub for trade, technology, and finance.
European Union (EU)
The EU is the world’s largest single market, with free movement of goods, people, and capital across 27 member states. The euro is the second-most traded currency globally.
Strengths: High levels of economic integration, advanced infrastructure, strong institutions
Weaknesses: Aging population, energy dependency (especially after the Russia-Ukraine war)
Germany
Germany is the powerhouse of Europe, leading in automobiles, engineering, chemicals, and renewable energy. Frankfurt is a major financial hub.
Opportunities: Transition to green energy, high-tech industries
Risks: Export dependency, demographic challenges
France
France blends industrial strength with luxury, fashion, and tourism industries. Paris is also a growing fintech hub.
United Kingdom
Post-Brexit, the UK operates independently of the EU, but London remains a global financial center. Britain leads in finance, pharmaceuticals, and services.
Eastern Europe
Countries like Poland, Hungary, and Romania are emerging as manufacturing hubs due to lower labor costs, attracting supply chain relocations from Western Europe.
3. Asia-Pacific
Asia-Pacific is the fastest-growing region, driven by China, India, and Southeast Asia.
China
China is the world’s second-largest economy and a manufacturing superpower. It dominates global supply chains in electronics, textiles, and increasingly, electric vehicles and renewable energy.
Strengths: Huge domestic market, government-led industrial policy, global export strength
Challenges: Debt, slowing growth, geopolitical tensions with the U.S.
Markets: Shanghai Stock Exchange, Shenzhen Stock Exchange, and Hong Kong as a global financial hub
India
India is one of the fastest-growing major economies, with strong potential in IT services, pharmaceuticals, digital payments, manufacturing, and renewable energy.
Strengths: Young population, digital transformation, strong services sector
Challenges: Infrastructure gaps, unemployment, bureaucratic hurdles
Markets: NSE and BSE, with rising global investor participation
Japan
Japan has a mature economy with global leadership in automobiles, electronics, and robotics. The Tokyo Stock Exchange is one of the largest in the world.
Strengths: Advanced technology, innovation, strong corporate governance
Challenges: Aging population, deflationary pressures
South Korea
South Korea is a global leader in semiconductors (Samsung, SK Hynix), automobiles (Hyundai, Kia), and consumer electronics. The KOSPI index reflects its market vibrancy.
Southeast Asia
Countries like Vietnam, Thailand, Indonesia, and Malaysia are emerging as new growth centers, benefiting from supply chain shifts away from China.
Vietnam: Manufacturing hub for electronics and textiles
Indonesia: Rich in resources like nickel (critical for EV batteries)
Singapore: Leading global financial and logistics hub
4. Latin America
Latin America’s markets are resource-driven but often volatile due to political instability and inflation.
Brazil
The largest economy in Latin America, Brazil is a major exporter of soybeans, coffee, iron ore, and oil. It also has a growing fintech and digital economy sector.
Argentina
Argentina struggles with recurring debt crises and inflation, but it has strong potential in lithium reserves, agriculture, and energy.
Chile & Peru
Both are resource-rich, particularly in copper and lithium, making them crucial for the global clean energy transition.
Mexico
(Already covered under North America, but plays a dual role in Latin America too.)
5. Middle East
The Middle East’s economies are largely oil-driven, but diversification is underway.
Saudi Arabia
Through Vision 2030, Saudi Arabia is reducing reliance on oil by investing in tourism, renewable energy, and technology. The Tadawul exchange is gaining global importance.
United Arab Emirates (UAE)
Dubai and Abu Dhabi are major global hubs for trade, logistics, and finance. Dubai International Financial Centre (DIFC) attracts global capital.
Qatar & Kuwait
Strong in natural gas exports and sovereign wealth investments.
Israel
Israel is a “startup nation,” leading in cybersecurity, AI, fintech, and biotech. Tel Aviv has a vibrant capital market.
6. Africa
Africa is rich in natural resources but has underdeveloped capital markets. Still, its youthful population and growing middle class present opportunities.
South Africa
The most advanced African economy with a diversified market in mining, finance, and retail. The Johannesburg Stock Exchange (JSE) is the continent’s largest.
Nigeria
Africa’s largest economy, dependent on oil exports, but also growing in fintech (mobile payments, digital banking).
Kenya
A leader in mobile money innovation (M-Pesa) and a gateway to East Africa.
Egypt
Strategically located, with a mix of energy, tourism, and agriculture. Cairo plays an important role in the region’s finance.
Opportunities & Risks Across Regions
Opportunities
Emerging markets (India, Vietnam, Nigeria) offer high growth potential.
Green energy and digital transformation create cross-border investment avenues.
Regional trade blocs (EU, ASEAN, USMCA, AfCFTA) enhance integration.
Risks
Geopolitical conflicts (Russia-Ukraine, U.S.-China tensions)
Currency fluctuations and debt crises in emerging markets
Climate change disrupting agriculture and infrastructure
Inflation and interest rate volatility
Conclusion
Regional and country-specific global markets together form the backbone of the international economic system. While North America and Europe remain financial powerhouses, Asia-Pacific is the fastest-growing engine, the Middle East is transforming from oil dependency to diversification, Latin America is leveraging its resources, and Africa stands as the future growth frontier.
For investors and businesses, the key lies in understanding the unique strengths, weaknesses, and risks of each market while recognizing their global interconnectedness. The future will likely see more multipolarity—where not just the U.S. and Europe, but also China, India, and regional blocs shape the course of the global economy.

Tata MotorsTrade Setup (Positional Swing)
Buy Zone: ₹705–715 (near breakout level)
Target 1: ₹760
Target 2: ₹800
Target 3 (extended): ₹850
Stop Loss: ₹670 (below recent support & triangle lower trendline)
⚠️ Note: Since this is a weekly chart, the move can take a few weeks/months to play out. Keep trailing your stop loss higher if price sustains above targets.

HCLTECH 3Hour Time frameHCL Technologies (HCLTECH) 3-Hour Snapshot
Current Price: ₹1,470.00
Change: +1.72% from the previous close
Intraday Range: ₹1,432.10 – ₹1,471.90
Volume: 2,495,658 shares traded
Market Cap: ₹3.97 trillion
P/E Ratio: 23.39
Beta: 1.04 (indicating moderate volatility relative to the market)
🔎 Key Levels
Resistance:
R1: ₹1,471.90 (recent high)
R2: ₹1,490.00 (next resistance zone)
Support:
S1: ₹1,432.10 (immediate support)
S2: ₹1,400.00 (next support level)
📈 Technical Indicators
RSI (14): 62.15 — Neutral to slightly bullish
MACD: Positive, indicating upward momentum
Moving Averages:
5-period SMA: ₹1,455.00 — Buy signal
50-period SMA: ₹1,440.00 — Buy signal
200-period SMA: ₹1,400.00 — Buy signal
📌 Market Sentiment
Catalysts: Positive momentum following recent gains and analyst upgrades.
Sector Performance: IT sector showing strength, with HCL Technologies leading gains among peers.
Options Activity: Significant trading in call options at ₹1,470 strike price, indicating bullish sentiment.
📅 Outlook
Bullish Scenario: A breakout above ₹1,471.90 could lead to a push toward ₹1,490.00 and higher.
Bearish Scenario: A drop below ₹1,432.10 may test support around ₹1,400.00.
Overall Bias: Moderately bullish, with positive momentum but facing near-term resistance.

BTCUSDT 1D Time frame 📊 BTC/USDT Daily Snapshot
Current Price: $112,493
Change: −0.37% from the previous close
Intraday Range: $110,812 – $113,029
Market Cap: Approximately $2.2 trillion
P/E Ratio: Not applicable (Bitcoin is not a stock)
Beta: Not applicable (Bitcoin is not a stock)
🔎 Key Levels
Resistance:
R1: $113,000 (recent high)
R2: $116,000 (next resistance zone)
Support:
S1: $110,800 (immediate support)
S2: $107,000 (next support level)
S3: $102,000 (longer-term support)
📈 Technical Indicators
RSI (14): 43 — Neutral, indicating balanced buying and selling pressure
MACD: Bullish crossover observed, suggesting upward momentum
Moving Averages:
5-day SMA: $111,500 — Buy signal
50-day SMA: $112,830 — Resistance level
200-day SMA: $101,000 — Long-term support
Stochastic Oscillator: Oversold, indicating potential for a bounce
📌 Market Sentiment
Catalysts: Positive momentum following recent gains and analyst upgrades.
Sector Performance: Cryptocurrency market showing strength, with Bitcoin leading gains among peers.
Options Activity: Significant trading in call options at $113,000 strike price, indicating bullish sentiment.
📅 Outlook
Bullish Scenario: A breakout above $113,000 could lead to a push toward $116,000 and higher.
Bearish Scenario: A drop below $110,800 may test support around $107,000.
Overall Bias: Moderately bullish, with positive momentum but facing near-term resistance.

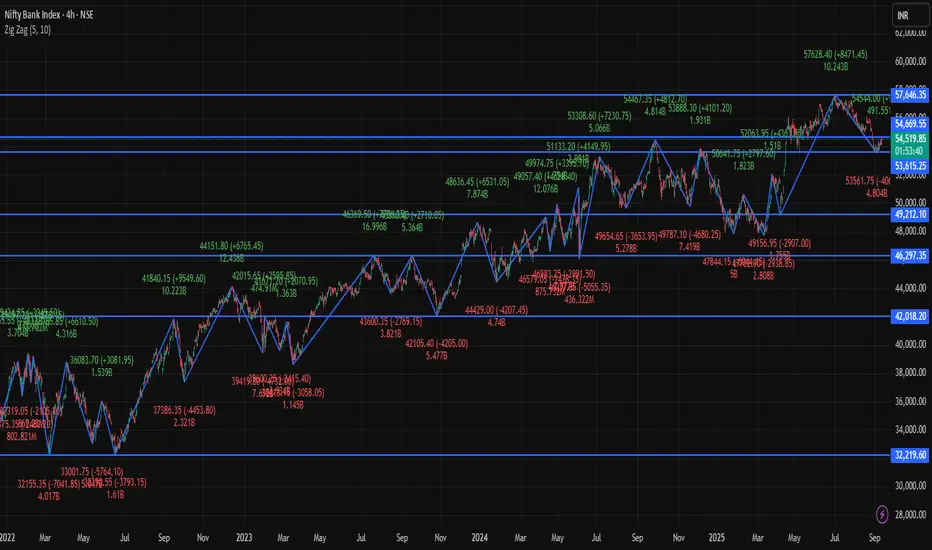
BANKNIFTY 4Hour Time frame Bank Nifty Snapshot (10 Sept 2025 – 4-Hour Chart)
Current Level: Around 54,550 – 54,650
Intraday Change: Up about +330 to +440 points (~+0.7%)
Trend: Bullish, price holding near highs
Key Pivot Levels (Daily Basis – useful on 4H)
Pivot Point: 54,352
Resistance Levels:
R1: 54,487
R2: 54,623
R3: 54,759
Support Levels:
S1: 54,215
S2: 54,080
S3: 53,944
Technical View (4-Hour Frame)
Momentum: Price is trading above R2 (54,623) → shows strong bullish bias.
Indicators: RSI near 65–70 (bullish), MACD positive, moving averages aligned upward.
Bias:
Sustaining above 54,623 → next upside toward 54,759 and beyond.
If it falls back below Pivot (54,352) → downside risk toward 54,215 or 54,080.
✅ Conclusion: On the 4-hour timeframe, Bank Nifty is bullish, trading above major resistance zones. If strength holds, higher levels are possible, but profit-booking can trigger quick pullbacks toward support.
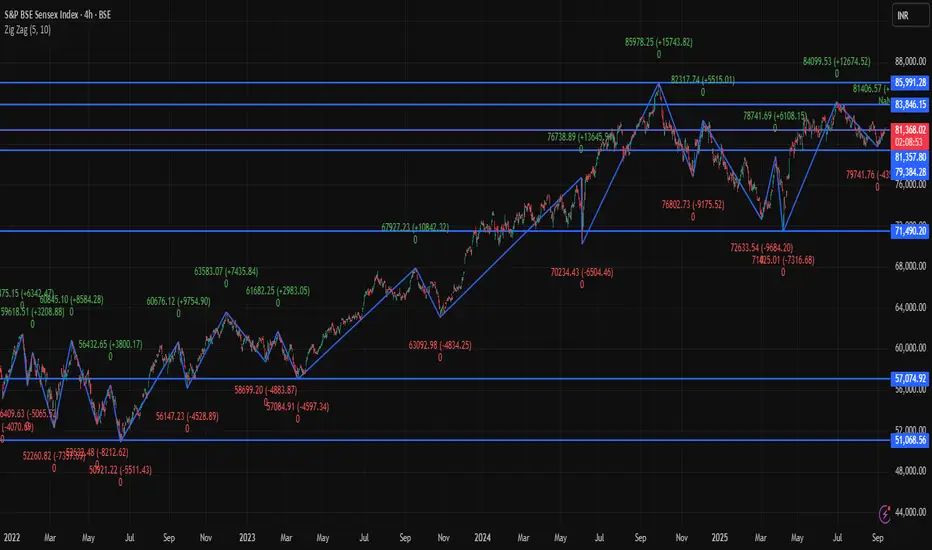
SENSEX 4Hour Time frameCurrent Level: Around 81,450 – 81,500
Intraday Change: Up about +350 to +400 points (~+0.5%)
Trend: Strong bullish momentum
Key Pivot Levels (for reference on 4-hour chart)
Pivot Point: 81,070
Resistance:
R1: 81,212
R2: 81,324
R3: 81,466
Support:
S1: 80,959
S2: 80,817
S3: 80,706
Technical View (4-Hour Frame)
Momentum: Trading near R3 (81,466) — showing strong buying strength.
Indicators: RSI is in bullish territory (~65), MACD is positive, and moving averages point upward.
Bias:
If Sensex sustains above R3, next upside targets can extend further beyond 81,500.
A pullback below Pivot (81,070) would shift bias toward supports around 80,960 – 80,820.
✅ Conclusion: Sensex on the 4-hour timeframe is bullish, trading near its resistance highs. Buyers are in control, though some profit-booking is possible if it struggles to stay above 81,466.
Swap Trading in Foreign MarketsHistorical Background of Swaps
The concept of swaps emerged in the late 1970s and early 1980s. Their development was tied to globalization, deregulation of capital markets, and the increasing volatility of interest rates and exchange rates.
1970s Energy Crisis and Volatility: Rising oil prices and inflation led to volatility in both interest rates and currencies. Companies engaged in cross-border trade needed instruments to hedge risks.
1981 Milestone: The first widely recognized currency swap was executed between the World Bank and IBM. This transaction allowed IBM to access Swiss francs and German marks at lower costs, while the World Bank obtained U.S. dollars without issuing dollar-denominated debt directly.
1980s–1990s: Swaps grew in popularity, particularly interest rate swaps, as corporations and banks used them to restructure liabilities.
2000s and Beyond: The growth of global derivatives markets, along with sophisticated technology and clearing systems, pushed swaps into the mainstream. Today, the Bank for International Settlements (BIS) estimates that the notional amount of outstanding swaps runs into hundreds of trillions of dollars, making it one of the largest segments of the derivatives market.
What is a Swap?
A swap is a derivative contract in which two parties agree to exchange sequences of cash flows for a set period. The cash flows are typically tied to interest rates, currencies, or commodities.
Key features of swaps:
Over-the-Counter (OTC) Nature: Traditionally, swaps are negotiated privately between parties, not traded on exchanges (though post-2008 reforms introduced central clearing for some swaps).
Customizable Terms: Swaps can be structured to meet the specific needs of the parties involved.
No Initial Exchange of Principal (in most cases): Unlike loans, swaps typically involve only the exchange of cash flows, not principal.
Maturity Ranges: Swaps can range from short-term (less than a year) to very long-term (over 30 years).
Types of Swaps in Foreign Markets
1. Interest Rate Swaps (IRS)
An interest rate swap is an agreement where two parties exchange interest payments, typically one fixed rate for one floating rate, on a notional principal amount.
Example: Company A pays fixed 5% interest while receiving LIBOR + 0.5% from Company B.
Usage in foreign markets: Multinational corporations often issue bonds in foreign currencies and then use IRS to manage interest rate exposure.
2. Currency Swaps
A currency swap involves exchanging principal and interest payments in one currency for principal and interest in another currency.
Example: A U.S. company needing euros can swap U.S. dollar payments with a European firm needing dollars.
Significance: Currency swaps are crucial in international finance because they allow companies to obtain foreign currency funding without directly entering the bond markets.
3. Cross-Currency Interest Rate Swaps (CCIRS)
A hybrid form where both currency and interest rate exposures are swapped. It’s common for institutions engaged in global trade and investment.
4. Commodity Swaps
Although less directly linked to currencies, commodity swaps affect global markets. For example, an oil-importing country may hedge price fluctuations by engaging in swaps with oil exporters.
5. Credit Default Swaps (CDS)
These protect against default on debt obligations. While not currency-based, CDS became highly visible during the 2008 Global Financial Crisis and remain a significant global derivative.
Mechanics of Swap Trading
Negotiation and Agreement: Two parties agree on the notional amount, payment dates, interest rate benchmarks, and currencies involved.
Cash Flow Exchanges: On each payment date, cash flows are exchanged as per the agreement.
Settlement: Settlements may be netted (only differences exchanged) or gross (full payments made in respective currencies).
Duration and Termination: Swaps usually last several years but can be terminated early through mutual agreement or by entering into an offsetting swap.
Applications of Swaps in Foreign Markets
1. Hedging
Companies hedge against foreign currency fluctuations when repaying overseas loans.
Importers/exporters lock in favorable exchange rates to protect profit margins.
2. Speculation
Traders take positions on expected changes in interest rates or currency values.
Hedge funds often speculate using cross-currency swaps.
3. Arbitrage
Exploiting differences between interest rates or currency values in different markets.
4. Liquidity Management
Central banks use swaps to provide liquidity in foreign currencies during crises (e.g., Fed swap lines during 2008 and COVID-19 crises).
Global Examples of Swap Usage
U.S. and Europe: Major banks like JPMorgan, Deutsche Bank, and Barclays dominate swap markets.
Asia: Corporations in India, China, and Japan use swaps to manage cross-border investments and trade.
Emerging Markets: Swaps help governments manage external debt denominated in foreign currencies.
Risks in Swap Trading
Credit Risk (Counterparty Risk): If one party defaults, the other may face significant losses.
Market Risk: Movements in interest rates or exchange rates may turn against a party’s position.
Liquidity Risk: Difficulty in unwinding a swap position before maturity.
Operational Risk: Errors in valuation, settlement, or reporting.
Systemic Risk: As swaps are massive in scale, failures in this market can have global implications (e.g., Lehman Brothers’ collapse).
Regulatory Framework
After the 2008 Global Financial Crisis, regulators imposed stricter rules on swaps:
Dodd-Frank Act (U.S.): Mandated central clearing and trade reporting of certain swaps.
EMIR (EU): Similar framework requiring transparency and clearing obligations.
BIS and IOSCO Guidelines: Global bodies ensuring harmonization of rules.
Central clearing via institutions like the London Clearing House (LCH) reduces counterparty risk and increases transparency.
Benefits of Swaps in Foreign Markets
Cost Efficiency: Companies can borrow in favorable markets and swap to required currencies.
Flexibility: Highly customizable structures for specific needs.
Risk Management: Effective hedging against currency and interest rate risks.
Access to Capital: Enables smaller firms and emerging economies to access global funding.
Challenges and Criticisms
Complexity: Difficult for smaller firms to understand and manage.
Systemic Risk: Can amplify crises if misused.
Transparency Issues: OTC nature makes it harder to monitor exposures.
Dependence on Benchmarks: LIBOR scandals highlighted manipulation risks.
The Future of Swap Trading
Transition from LIBOR to SOFR and Other Risk-Free Rates (RFRs): This shift will reshape interest rate swaps globally.
Digital Transformation: Blockchain and smart contracts may increase transparency and reduce operational risks.
Growth in Emerging Markets: Rising global trade will expand demand for currency and cross-currency swaps.
Climate Finance: Green swaps may emerge to align with sustainability goals.
Conclusion
Swap trading in foreign markets is not just a financial innovation; it is the backbone of modern global finance. Whether it is a multinational corporation hedging currency exposure, a government managing external debt, or a central bank stabilizing markets, swaps provide the flexibility, efficiency, and liquidity needed in today’s interconnected world.
While they offer immense benefits, the risks and systemic challenges cannot be ignored. Strong regulation, transparency, and technological evolution will shape the next phase of swap trading. For traders, corporations, and policymakers alike, understanding swaps is essential to navigating the complexities of global finance.
Tata Motors smashes resistance – Power packed rally ahead!This is the 4 hour chart of Tata Motors.
Tata Motors recently gave a breakout on the shorter timeframe around the ₹700 level and is currently trading near ₹721.
The stock has established a strong support zone between ₹690–₹700. If it sustains above this level and the current momentum continues, we may see a potential upside towards the ₹750–₹760 range in the shorter timeframe.
Thank you.

Tata Motors Inverted Head n ShoudlersTata motors is making an inverted Head n Shoulder on the daily timeframe. A long entry can be made in this scrip at the retest levels of around 704-706. Support can be 670 which is the right shoulder low for Swing traders and for intraday traders todays low can be the support.
Targets can be 740 750 for swing. Look at the chart for understanding how an Head n Shoulder works and follow for more such ideas.
Disclaimer- This is just for educational purpose.
Jai Shree Ram.

Emerging Markets & BRICS Impact1. Introduction
The world economy today is not shaped only by the traditional powerhouses like the United States, Western Europe, or Japan. Instead, a large share of global growth is now being driven by emerging markets, countries that are rapidly industrializing, expanding their middle class, and gaining importance in trade and investment.
Among these, the BRICS group (Brazil, Russia, India, China, and South Africa) has become a major symbol of the rise of the Global South. Together, these countries account for over 40% of the world’s population and around 25% of global GDP (and growing). Their rise has significant implications for trade, geopolitics, technology, finance, and global governance.
This essay explores what emerging markets are, why they matter, how BRICS is shaping the global landscape, and what the future may hold.
2. What Are Emerging Markets?
An emerging market is an economy that is transitioning from being low-income, less developed, and heavily reliant on agriculture or resource exports, toward being more industrialized, technologically advanced, and integrated with the global economy.
Key Characteristics
Rapid economic growth (higher than developed nations)
Industrialization & urbanization
Expanding middle class and consumption base
Integration with global financial markets
Structural reforms and policy changes
Examples
Asia: India, China, Indonesia, Vietnam, Philippines
Latin America: Brazil, Mexico, Chile, Colombia
Africa: South Africa, Nigeria, Egypt, Kenya
Eastern Europe: Poland, Turkey
These nations are often seen as the growth engines of the 21st century. Investors view them as high-risk, high-reward markets, because while they promise rapid returns, they also face risks like political instability, weak institutions, or volatility.
3. Drivers of Growth in Emerging Markets
Why are emerging markets so important? Because they offer new sources of demand, labor, and innovation.
Demographics: Young populations compared to aging Western societies. India, for instance, has a median age of just 28.
Urbanization: Millions moving from rural to urban centers, fueling demand for housing, infrastructure, and consumer goods.
Technology adoption: Leapfrogging old models—Africa went straight to mobile banking (like M-Pesa), skipping traditional banking.
Globalization: Integration into global supply chains, manufacturing hubs, and service outsourcing (e.g., India in IT, Vietnam in electronics).
Natural resources: Rich deposits of oil, gas, minerals, and agricultural products.
Domestic reforms: Liberalization of trade, privatization, financial reforms, attracting foreign direct investment (FDI).
4. Challenges Facing Emerging Markets
Despite opportunities, emerging markets face significant hurdles:
Political risks: Corruption, unstable governments, populism.
Debt burdens: Many borrow in foreign currency, making them vulnerable to US dollar strength.
Geopolitical tensions: Sanctions, wars, trade wars, supply chain disruptions.
Infrastructure gaps: Lack of roads, power, digital connectivity.
Climate risks: Extreme weather impacts agriculture and coastal cities.
Thus, emerging markets are not a straight growth story—they are volatile yet transformative.
5. BRICS: The Symbol of Emerging Market Power
The term BRIC was first coined in 2001 by economist Jim O’Neill of Goldman Sachs to highlight the economic potential of Brazil, Russia, India, and China. In 2010, South Africa joined, making it BRICS.
Key Features
Represent ~40% of global population
Combined GDP: Over $28 trillion (2024 est.)
Hold significant natural resources (oil, gas, minerals, agriculture)
Increasing role in global politics
The group is not a formal union like the EU but a coalition of cooperation on economic, trade, and geopolitical issues.
6. Economic Contributions of BRICS
China: The manufacturing hub of the world, second-largest economy, key player in AI, green energy, and Belt & Road Initiative.
India: IT powerhouse, pharmaceutical leader, fastest-growing large economy, huge young labor force.
Brazil: Agricultural superpower (soybeans, coffee, beef), energy producer, growing fintech sector.
Russia: Major exporter of oil, natural gas, defense technology, though under Western sanctions.
South Africa: Gateway to Africa, strong in mining (gold, platinum), growing financial services sector.
Together, these economies contribute to global demand, innovation, and diversification of trade flows.
7. BRICS & Global Trade
One of the main goals of BRICS is to reduce dependency on Western markets and currencies. Key initiatives include:
Trade in local currencies instead of relying on the US dollar.
New Development Bank (NDB), founded in 2014, to finance infrastructure and sustainable projects in developing nations.
Expansion of intra-BRICS trade—for example, India-China trade in goods and services, Brazil-China agricultural exports, Russia-India defense trade.
The BRICS grouping is also seen as a counterweight to Western institutions like the IMF and World Bank.
8. Geopolitical Impact of BRICS
BRICS is more than economics—it is geopolitics.
Multipolar world order: Challenging US/EU dominance in global decision-making.
Alternative institutions: NDB as an alternative to IMF/World Bank, BRICS Summits as rival platforms to G7.
South-South cooperation: Giving developing nations more bargaining power in WTO, UN, and climate talks.
Strategic partnerships: India-Russia defense, China-Brazil trade, South Africa-China infrastructure.
BRICS has even discussed creating a common currency to reduce dollar dominance, though this remains a long-term idea.
9. Sectoral Impact of BRICS
Energy: Russia and Brazil are oil & gas exporters, China and India are importers—this creates synergy.
Agriculture: Brazil & Russia supply food to China & India.
Technology: China leads in 5G, AI, semiconductors; India excels in software & digital services.
Finance: BRICS is building payment systems outside of SWIFT to bypass Western sanctions.
Climate & Green Energy: Joint investments in solar, wind, and electric vehicles.
10. Criticism & Limitations of BRICS
BRICS is not without challenges:
Internal differences: India vs. China border disputes, Russia vs. West sanctions, Brazil’s political volatility.
Economic imbalance: China dominates the group—its GDP is bigger than all others combined.
Lack of cohesion: Different political systems (democracies, authoritarian states) and conflicting foreign policies.
Slow institutional development: NDB is still small compared to IMF/World Bank.
Despite these, BRICS has survived and expanded its influence.
Conclusion
Emerging markets are no longer just “developing nations.” They are active shapers of the global order, with BRICS as their most visible symbol. The rise of these economies is rebalancing global power from West to East and North to South.
While challenges remain—geopolitical rivalries, financial instability, governance issues—the long-term trajectory is clear: emerging markets and BRICS will be central to the 21st-century economy.
They represent not only new opportunities for investors, businesses, and policymakers but also a more multipolar, inclusive, and diverse global system.

Commodity Market TrendsIntroduction
The commodity market is one of the oldest forms of trade in human history. From ancient barter systems to modern-day electronic exchanges, commodities such as gold, silver, oil, grains, and livestock have always played a central role in global trade. Unlike stocks and bonds, which represent ownership of a company or debt obligations, commodities are tangible goods that people consume, use in manufacturing, or trade for value preservation.
Commodity market trends reflect how prices move over time, influenced by demand, supply, economic growth, geopolitics, climate, and investor behavior. Understanding these trends is vital for traders, investors, businesses, and policymakers because commodities impact everything—from inflation to national security.
In this essay, we’ll explore commodity market trends in detail, covering:
Types of commodities
Factors influencing commodity prices
Historical evolution of commodity trends
Current global trends
Sector-wise commodity insights
Role of technology and trading platforms
India’s role in global commodity markets
Risks and challenges
Future outlook
1. Types of Commodities
Commodities are broadly classified into two categories:
A. Hard Commodities
These are natural resources that must be mined or extracted.
Energy: Crude oil, natural gas, coal, uranium
Metals: Gold, silver, platinum, copper, aluminum
B. Soft Commodities
These are agricultural products or livestock.
Grains: Wheat, rice, corn, barley, soybeans
Cash crops: Cotton, coffee, sugar, cocoa, rubber
Livestock: Cattle, hogs, poultry
Each commodity has unique demand-supply cycles, trading methods, and price drivers, which create distinctive trends.
2. Factors Influencing Commodity Market Trends
Commodity trends are shaped by multiple interrelated factors.
A. Supply and Demand
A poor monsoon can reduce India’s wheat and rice production, pushing prices higher.
Rising industrial demand in China increases the global price of copper and steel.
B. Economic Growth
Strong GDP growth increases energy demand (oil, coal, gas).
Slowdowns reduce consumption and depress prices.
C. Geopolitical Events
Wars in oil-producing regions like the Middle East push crude prices up.
Trade sanctions disrupt supply chains, creating shortages.
D. Inflation and Currency Value
Commodities, especially gold and silver, are seen as a hedge against inflation.
A weaker US dollar generally boosts commodity prices since most are dollar-denominated.
E. Technological Advancements
Shale oil extraction revolutionized US energy supply.
Precision farming and GM crops increase agricultural yields.
F. Speculation and Investment Flows
Commodities are part of hedge funds’ and ETFs’ portfolios.
Heavy speculation can exaggerate short-term price swings.
3. Historical Evolution of Commodity Trends
Commodity markets have evolved through distinct eras:
A. Ancient and Medieval Period
Gold and silver were primary stores of value.
Spices, silk, and cotton drove global trade routes like the Silk Road.
B. Industrial Revolution (18th–19th Century)
Coal became central to powering factories and railways.
Agricultural markets expanded with colonial trade networks.
C. 20th Century
Oil replaced coal as the dominant energy source.
The Bretton Woods system (post-WWII) tied currencies to gold, which influenced commodity flows.
D. 21st Century
Commodities became financialized—futures, options, ETFs.
Climate change, ESG investing, and green energy are reshaping commodity dynamics.
4. Current Global Commodity Market Trends
A. Energy Commodities
Crude Oil – Prices remain volatile due to OPEC policies, US shale production, and geopolitics (Russia-Ukraine conflict, Middle East tensions).
Natural Gas – LNG demand is rising in Asia, especially India and China, while Europe shifts away from Russian supply.
Coal – Despite clean energy policies, coal demand remains strong in emerging markets like India due to electricity needs.
B. Metals
Gold – Functions as a safe-haven asset during inflation, recession fears, or geopolitical tension.
Silver – Dual role as industrial metal and safe haven. Solar panel demand is pushing industrial consumption.
Copper – Known as "Dr. Copper" because it reflects economic health. Demand is surging from EVs, batteries, and infrastructure.
Aluminum & Nickel – Essential in renewable energy technologies and lightweight transport manufacturing.
C. Agricultural Commodities
Grains – Climate change, supply chain disruptions, and fertilizer shortages drive volatility.
Coffee & Cocoa – Affected by weather shocks (El Niño) and global consumer demand.
Sugar & Cotton – Linked to biofuel trends, textile demand, and monsoon performance in India.
5. Sector-Wise Commodity Insights
A. Energy Sector
Oil demand is plateauing in developed countries but surging in Asia.
Renewable-linked commodities like lithium, cobalt, and rare earths are gaining importance.
B. Precious Metals
Gold remains the world’s ultimate crisis hedge.
Silver and platinum are benefiting from the green energy transition.
C. Base Metals
Copper and aluminum are crucial for infrastructure and EV adoption.
Supply disruptions in Africa and South America impact availability.
D. Agriculture
Population growth increases long-term demand for food commodities.
Climate change increases unpredictability—extreme droughts, floods, and pests.
6. Technology and Commodity Trading
Electronic Trading Platforms (MCX, CME, ICE) have made commodity markets global and fast-paced.
AI and Data Analytics help forecast weather impacts, demand patterns, and price trends.
Blockchain improves traceability in agricultural and mining commodities.
Algo-Trading has increased speculative flows and high-frequency trading.
7. India’s Role in Commodity Markets
India is both a major producer and consumer of commodities:
Gold & Silver: India is the second-largest consumer of gold, driven by cultural and investment demand.
Crude Oil: India imports over 85% of its crude needs, making it vulnerable to global price shocks.
Agriculture: Leading producer of rice, wheat, sugarcane, and cotton.
Coal: India is the second-largest coal producer but still imports due to quality mismatches.
Exchanges: MCX (Multi Commodity Exchange) and NCDEX (National Commodity & Derivatives Exchange) are the leading Indian platforms.
Government policies—like MSP (Minimum Support Price), import-export bans, and subsidies—also strongly influence domestic commodity trends.
8. Risks and Challenges in Commodity Markets
Price Volatility – Rapid swings can hurt producers, consumers, and investors.
Geopolitical Tensions – Wars, sanctions, and trade wars disrupt supply chains.
Climate Change – Unpredictable weather patterns affect agriculture and energy demand.
Technological Risks – Cyberattacks on trading platforms and supply chain disruptions.
Regulatory Risks – Changes in taxation, subsidies, and environmental laws affect trade.
9. Future Outlook for Commodity Market Trends
A. Energy Transition
The world is shifting towards renewables, EVs, and green hydrogen.
Demand for lithium, cobalt, nickel, and copper will surge.
B. Digital Commodities
Data, carbon credits, and even water rights may emerge as tradable commodities.
C. Inflation Hedge Investments
Investors will continue to use gold and silver as hedges against economic uncertainty.
D. Agriculture & Food Security
With rising global population (expected 10 billion by 2050), agriculture commodities will remain critical.
Precision farming, vertical farming, and biotech seeds will shape future supply.
E. India’s Growing Role
As one of the fastest-growing economies, India’s demand for energy, metals, and food will strongly influence global trends.
10. Conclusion
The commodity market is the backbone of the global economy, deeply tied to human survival, industrial growth, and financial systems. Its trends are not just numbers on a chart—they reflect global consumption patterns, political events, and technological changes.
In today’s interconnected world, understanding commodity market trends is essential for:
Traders who seek profit from price movements.
Businesses that need raw materials for production.
Governments that must ensure stability and security.
Investors looking for safe havens and diversification.
From gold and oil to wheat and copper, commodities are the foundation of every nation’s economic journey. As we move into a future shaped by green energy, climate change, and digitalization, the role of commodities will only grow stronger.
👉 In summary, the next era of commodity market trends will be defined by energy transition, technological disruption, and geopolitical rebalancing, making it one of the most exciting and unpredictable spaces in global trade.

Global Stock Market IndicesIntroduction
When people talk about “the market going up” or “the market crashing,” they are usually referring to a stock market index rather than individual stocks. Indices like the Dow Jones, S&P 500, FTSE 100, Nikkei 225, or Sensex are names that investors, traders, and even common people hear almost daily in financial news.
But what exactly are these indices? Why are they so important? And why do global investors track them so closely?
In this article, we will explore everything about Global Stock Market Indices – their definition, types, major global benchmarks, importance in global finance, and how they influence investment decisions.
1. What is a Stock Market Index?
A stock market index is basically a measurement tool that tracks the performance of a group of selected stocks. These stocks represent either a market, a sector, or a theme.
Imagine an index as a basket of stocks chosen to represent a larger part of the economy.
For example, India’s Sensex tracks 30 large, financially strong companies from the Bombay Stock Exchange (BSE). Similarly, the S&P 500 tracks 500 of the largest U.S. companies.
The purpose of indices is to give investors and policymakers a quick snapshot of how a market is performing without analyzing thousands of individual stocks.
Key Features of Indices
Representation – They represent a portion of the economy (large-cap, mid-cap, small-cap, or sectoral).
Benchmark – Used as a benchmark to measure portfolio or fund performance.
Economic Indicator – Indices reflect overall economic health and investor sentiment.
Passive Investment Tool – Many funds (like ETFs) simply mimic indices instead of picking individual stocks.
2. How Are Indices Constructed?
Indices are not random; they are carefully designed using certain methodologies:
a) Market Capitalization Weighted
Stocks are given weight based on their market capitalization (price × number of shares).
Example: S&P 500, Nifty 50.
Larger companies influence index movement more.
b) Price Weighted
Stocks with higher price per share have greater weight, regardless of company size.
Example: Dow Jones Industrial Average (DJIA).
c) Equal Weighted
Every stock in the index has equal weight.
Provides a more balanced view of all companies.
d) Sectoral or Thematic
Some indices focus on specific industries like IT, banking, or energy.
Example: NASDAQ 100 has a heavy focus on technology companies.
3. Why Are Stock Market Indices Important?
Benchmark for Investors – Investors compare their portfolio returns with indices to check performance.
Example: If Nifty 50 gave 12% returns and your mutual fund gave 9%, the fund underperformed.
Economic Sentiment Gauge – Indices reflect how investors feel about the economy. Rising indices = confidence, falling indices = fear.
Helps Passive Investing – Index funds and ETFs directly replicate indices, making investing simple.
Risk Diversification – Indices spread risk across multiple companies and sectors.
Global Influence – Movement in one country’s major index often affects others (e.g., U.S. indices influence global markets).
4. Major Global Stock Market Indices
Let’s go around the world and understand the top global stock market indices.
United States
The U.S. stock market is the world’s largest and most influential.
Dow Jones Industrial Average (DJIA)
Oldest index (founded in 1896).
Tracks 30 blue-chip U.S. companies.
Price-weighted index (high-priced stocks influence more).
Companies include Apple, Microsoft, Goldman Sachs.
Seen as a symbol of American industrial and corporate strength.
S&P 500 (Standard & Poor’s 500)
Tracks 500 of the largest publicly traded U.S. companies.
Market-cap weighted index.
Considered the best single indicator of the U.S. stock market.
Covers ~80% of total U.S. market capitalization.
NASDAQ Composite
Tracks 3,000+ companies listed on the NASDAQ exchange.
Technology-heavy index (Apple, Amazon, Google, Tesla, Meta).
Reflects innovation and tech industry growth.
Russell 2000
Represents 2,000 small-cap U.S. companies.
Often used to gauge investor risk appetite.
Europe
FTSE 100 (UK)
Tracks 100 largest companies listed on London Stock Exchange.
Multinational in nature (oil, mining, banking).
Example: BP, HSBC, Unilever.
DAX (Germany)
Tracks 40 largest German companies listed on Frankfurt Stock Exchange.
Represents Europe’s strongest economy.
Includes Siemens, BMW, Allianz.
CAC 40 (France)
Top 40 companies in Paris Stock Exchange.
Example: L’Oréal, TotalEnergies, BNP Paribas.
Euro Stoxx 50
Tracks 50 leading blue-chip companies in Eurozone.
Pan-European benchmark.
Asia-Pacific
Nikkei 225 (Japan)
Tracks 225 large companies listed on Tokyo Stock Exchange.
Price-weighted like Dow Jones.
Key companies: Toyota, Sony, SoftBank.
Shanghai Composite (China)
Tracks all companies on Shanghai Stock Exchange.
Represents China’s domestic A-shares market.
Hang Seng Index (Hong Kong)
Covers 50 major companies in Hong Kong.
Gateway for global investors to track China’s growth.
KOSPI (South Korea)
Korea Composite Stock Price Index.
Includes companies like Samsung, Hyundai, LG.
ASX 200 (Australia)
Tracks 200 top Australian companies.
Mining and banking heavy.
Sensex & Nifty (India)
Sensex: 30 large companies on Bombay Stock Exchange.
Nifty 50: 50 companies on National Stock Exchange.
Represent India’s fast-growing economy.
Other Important Indices
Bovespa (Brazil) – Latin America’s most important index.
MOEX Russia Index (Russia) – Reflects Russian economy, highly energy-driven.
TSX Composite (Canada) – Tracks Canadian companies, resource and banking heavy.
5. Global Indices as Economic Indicators
Stock indices don’t just reflect companies – they mirror entire economies.
U.S. Indices → Global investor sentiment.
Nikkei 225 → Japanese manufacturing & export health.
Sensex & Nifty → India’s emerging market growth.
FTSE 100 → Brexit, European trade, and global commodity movements.
Whenever there’s global turmoil (war, recession, oil shocks), these indices react immediately, and their performance tells the world how economies are coping.
6. Correlation Between Global Indices
In today’s interconnected world, markets are not isolated.
A fall in the Dow Jones often impacts Asian and European markets the next day.
Rising oil prices affect Bovespa, FTSE, and Sensex (energy-heavy economies).
Global crises like COVID-19 led to synchronized market crashes worldwide.
Thus, traders and fund managers track multiple indices daily to understand global trends.
7. Indices in Investment
a) Active vs Passive Investing
Active investors pick stocks individually.
Passive investors buy index funds (like S&P 500 ETFs).
b) ETFs and Mutual Funds
Exchange-Traded Funds (ETFs) mimic indices and trade like stocks.
Example: SPDR S&P 500 ETF (SPY) tracks the S&P 500.
c) Hedging with Indices
Derivatives like futures and options are available on indices.
Example: Traders use Nifty Futures or S&P 500 options to hedge portfolios.
8. Criticisms of Stock Indices
While indices are useful, they have limitations:
Not Full Representation – They track selected companies, not the entire market.
Overweight Bias – Large-cap companies dominate in market-cap weighted indices.
Sector Bias – Tech-heavy indices (like NASDAQ) may give a distorted view.
Price Weighted Flaws – In indices like Dow Jones, a single expensive stock can distort movements.
9. Future of Global Stock Market Indices
The world of indices is evolving with new themes:
Sustainable Indices (ESG) – Tracking environmentally and socially responsible companies.
Example: Dow Jones Sustainability Index.
Thematic Indices – Artificial Intelligence, Green Energy, Blockchain, EVs.
Frontier and Emerging Market Indices – Covering fast-growing but less developed markets.
Crypto Indices – Tracking cryptocurrencies like Bitcoin and Ethereum.
Conclusion
Global Stock Market Indices are more than just numbers on a financial news ticker. They are:
Thermometers of economic health.
Benchmarks for investment performance.
Global connectors influencing money flows.
From the Dow Jones in the U.S. to the Nifty in India, from FTSE in London to Nikkei in Tokyo, these indices form the heartbeat of the global financial system.

TATA MOTORS VALUATION ANALYSIS
🌺Conclusion🌺
Fair value: ₹1,370/share (DCF, FCFF).
Upside vs ~₹676: ~+100%.
Why: 12% growth, margin normalization to 13%, capex glide to 6%, revenue‑weighted global ERP yielding WACC ~11.1%, terminal growth 4.3%.
💁🏻DCF (FCFF) Highlights🌸
Framework: 5-year FCFF + Gordon terminal.
FCFF ramp (₹Cr): 6,541; 20,072; 34,252; 38,362; 42,965.
Assumptions: EBITDA 11.5%→13.0%; D&A ~5.3% of revenue; capex 9.0%→7.5%→6.0%; ΔWC base 0; tax ~18.9%.
Bridge: PV(FCFF) ~₹0.96–0.98L Cr; PV(Terminal) ~₹4.05–4.15L Cr; EV ~₹5.01–5.13L Cr; less net auto debt ₹13,500Cr; equity ~₹4.88–4.99L Cr; per share ₹1,360–₹1,380.
🧐Other Valuation Lenses 🌸
JLR: EV/Sales ~0.7–0.9x or EV/EBITDA on normalized 10–12% margins (discount to luxury peers).
India CV: EV/EBITDA ~6.0–7.5x mid‑cycle.
India PV/EV: EV/EBITDA ~10–12x normalized; use EV/Sales when EBIT soft.
🤔Scenarios (Per‑Share)🤔
Best (EBITDA 13.5–14.0%, capex faster to 6%): ₹1,520–₹1,620.
Base (EBITDA 13.0%): ₹1,360–₹1,380 (headline ₹1,370).
Worst (EBITDA 10.0–11.5%, capex slower to 7%): ₹1,180–₹1,280.
⭐Key Drivers⭐
JLR premium mix (Range Rover/Defender), tariff/FX normalization, China retail.
India PV discounting vs ASP/mix; EV unit economics scale-up.
CV cycle durability; pricing discipline.
Capex cadence and working capital behavior driving cash conversion.
✨Key Numbers✨
WACC ~11.1% (revenue‑weighted ERP, β≈1.30).
Terminal growth 4.3%.
Shares ~3.68B; net automotive debt ₹13,500Cr.
:it's not buy/sell recommendation this report is for info

Smart Liquidity in TradingIntroduction: What Is Smart Liquidity in Trading?
Liquidity is the backbone of financial markets—it refers to how easily assets can be bought or sold without causing drastic price changes. But as markets have evolved with the rise of algorithmic trading, decentralized finance (DeFi), and AI, a more sophisticated concept has emerged: Smart Liquidity.
Smart Liquidity isn’t just about having buyers and sellers in a market. It’s about efficient, dynamic, and intelligent liquidity—where technology, data, and algorithms converge to improve how trades are executed, how markets function, and how risks are managed. Whether in traditional stock markets, forex, or blockchain-based platforms, smart liquidity is now central to modern trading strategies.
Chapter 1: Understanding Traditional Liquidity
Before diving into smart liquidity, let's revisit the basics of traditional liquidity:
Bid-Ask Spread: A narrow spread indicates high liquidity; a wide one shows low liquidity.
Market Depth: The volume of orders at different price levels.
Turnover Volume: How frequently assets are traded.
Price Impact: How much a large order moves the price.
In traditional finance, liquidity providers (LPs) include:
Market makers
Banks and financial institutions
High-frequency trading firms
Exchanges
Liquidity ensures:
Stable pricing
Smooth trade execution
Lower transaction costs
Chapter 2: The Evolution Toward Smart Liquidity
What Changed?
Algorithmic Trading: Algorithms can detect, provide, or withdraw liquidity in milliseconds.
Decentralized Finance (DeFi): Smart contracts offer on-chain liquidity pools without intermediaries.
AI & Machine Learning: Predictive models can identify where liquidity is needed or likely to shift.
Smart Order Routing (SOR): Optimizes trade execution by splitting orders across multiple venues.
These technologies gave rise to “smart liquidity,” where liquidity is not static but adaptive, context-aware, and real-time optimized.
Chapter 3: Components of Smart Liquidity
1. Liquidity Intelligence
Advanced analytics track:
Market depth across exchanges
Order flow trends
Latency and slippage statistics
Arbitrage opportunities
This helps institutions dynamically manage their liquidity strategies.
2. Smart Order Routing (SOR)
SOR systems:
Automatically split large orders across venues
Route based on fees, liquidity, latency, and execution quality
Reduce market impact and slippage
SOR is key in both equity and crypto markets.
3. Algorithmic Liquidity Providers
Market-making bots adjust quotes in real-time based on:
Volatility
News sentiment
Volume spikes
Risk exposure
They enhance liquidity without manual intervention.
4. Automated Market Makers (AMMs)
Used in DeFi:
No traditional order book
Prices determined algorithmically via a liquidity pool
Traders interact with pools, not people
Popular AMMs: Uniswap, Curve, Balancer.
Chapter 4: Use Cases of Smart Liquidity
1. HFT Firms and Institutions
Use predictive liquidity models
Deploy SOR to reduce costs and slippage
Balance exposure across markets
2. Retail Traders
Benefit from tighter spreads and faster execution
Use platforms with AI-driven order matching
3. Decentralized Finance (DeFi)
Anyone can provide liquidity and earn fees
Smart liquidity enables 24/7 trading with no intermediaries
New protocols optimize capital allocation via auto-rebalancing
4. Stablecoin & Forex Markets
Smart liquidity ensures 1:1 peg stability
Algorithms prevent arbitrage imbalances
Chapter 5: Key Metrics to Measure Smart Liquidity
Metric Description
Slippage Difference between expected and actual execution price
Spread Efficiency How close bid-ask spreads are to theoretical minimum
Fill Rate How much of an order is filled without delay or rerouting
Market Impact Price movement caused by a trade
Liquidity Utilization How efficiently capital is allocated across pairs/assets
Latency Time taken from order input to execution
These metrics help evaluate the quality of liquidity provided.
Chapter 6: Risks and Challenges of Smart Liquidity
Despite its benefits, smart liquidity isn’t perfect.
1. Flash Crashes
Caused by sudden withdrawal of liquidity bots
Example: 2010 Flash Crash in U.S. equities
2. Manipulation Risks
Predatory algorithms can spoof or bait other traders
"Liquidity mirages" trick algorithms
3. Smart Contract Failures (DeFi)
Vulnerabilities in AMMs can drain entire liquidity pools
Hacks like those on Curve and Poly Network show smart liquidity can be fragile
4. Impermanent Loss (DeFi)
LPs may lose value if asset prices diverge significantly
Complex math and simulations needed to manage it
5. Regulatory Uncertainty
Especially in crypto, regulators still debating on decentralized liquidity protocols
Conclusion
Smart liquidity represents the next evolution of market infrastructure. It's not just about having capital in the market—it's about how that capital moves, adapts, and executes.
From hedge funds deploying intelligent routing systems to DeFi users earning yields through AMMs, smart liquidity touches every corner of modern finance. As technology continues to mature, expect liquidity to become even more predictive, responsive, and intelligent—unlocking a new level of speed, precision, and access for traders around the world.
Option Chain AnalysisTable of Contents
Introduction to Option Chain
What Is an Option Chain?
Key Components of an Option Chain
Call vs. Put Options in the Chain
How to Read an Option Chain
Open Interest (OI) Analysis
Implied Volatility (IV) Analysis
Strike Price Selection
Support and Resistance Levels from Option Chain
Option Chain for Intraday & Swing Trading
1. Introduction to Option Chain
In the world of options trading, success is not just about buying calls or puts randomly—it’s about understanding market data. One of the most important tools for analyzing this data is the Option Chain. Whether you're a beginner or an advanced trader, mastering option chain analysis can help you identify market sentiment, key levels, and trading opportunities.
2. What Is an Option Chain?
An Option Chain, also known as an Options Matrix, is a tabular representation of all available option contracts (both Call and Put) for a particular underlying asset—like Nifty, Bank Nifty, Reliance, TCS, etc.—for a specific expiry date.
It shows:
Strike prices
Premiums (Prices)
Open interest (OI)
Volume
Implied volatility (IV)
Bid/ask prices
Think of it like a menu card for options, showing all the possible trades you can take, and key stats about each.
3. Key Components of an Option Chain
✅ Strike Price:
The price at which you can buy (Call) or sell (Put) the underlying asset.
✅ Premium (LTP):
The last traded price (LTP) of the option.
✅ Open Interest (OI):
The number of open contracts for a strike price. Indicates trader interest.
✅ Change in OI:
The change in open positions compared to the previous day.
✅ Volume:
The number of contracts traded in the current session.
✅ Implied Volatility (IV):
Market's expected volatility of the underlying asset.
4. Call vs. Put Options in the Chain
In every option chain, you’ll see two sections:
Call Options (Left side) Put Options (Right side)
Bullish expectation Bearish expectation
Buy if expecting upside Buy if expecting downside
Sell if expecting sideways/down Sell if expecting sideways/up
Usually, the middle column contains strike prices, with Call data on the left and Put data on the right.
5. How to Read an Option Chain
Let’s take an example:
Assume Nifty is trading at 22,200. You look at the Nifty option chain.
You’ll see multiple rows of strike prices (e.g., 22,000, 22,100, 22,200…) and for each, data like LTP, OI, IV.
Look for:
ATM (At-the-money): Closest strike to the current price (22,200).
ITM (In-the-money): For calls, strikes < spot; for puts, strikes > spot.
OTM (Out-of-the-money): For calls, strikes > spot; for puts, strikes < spot.
Example:
22,200 is ATM.
22,100 Call is ITM.
22,300 Call is OTM.
6. Open Interest (OI) Analysis
OI is one of the most powerful indicators in option chain analysis. It shows where traders are placing their bets.
✔️ What to Look For:
High OI = Strong interest at that strike.
Increase in OI = New positions being added.
Decrease in OI = Positions being closed.
✔️ Interpretations:
High OI in Call → Resistance level.
High OI in Put → Support level.
Let’s say:
22,500 Call has 30 lakh OI → Strong resistance.
22,000 Put has 35 lakh OI → Strong support.
This gives you the trading range of Nifty: 22,000 to 22,500.
7. Implied Volatility (IV) Analysis
IV represents the market's future expectations of volatility. Higher IV means higher premiums.
✔️ Why IV Matters:
When IV is high, options are expensive.
When IV is low, options are cheaper.
✔️ Practical Use:
Sell options when IV is very high (premium is inflated).
Buy options when IV is low (premium is cheap).
8. Strike Price Selection
Choosing the right strike is key for successful trading.
✔️ For Buying Options:
Buy slightly ITM for better delta and time value.
ATM works for short-term, fast movements.
✔️ For Selling Options:
Sell OTM options with high OI and low IV.
✔️ Tip:
Always check the OI and IV before choosing a strike. Avoid illiquid strikes (with low OI or volume).
9. Support and Resistance Levels from Option Chain
You can spot support and resistance based on OI data.
✔️ Support:
Strike where Put OI is highest.
E.g., 22,000 Put with highest OI = Support zone.
✔️ Resistance:
Strike where Call OI is highest.
E.g., 22,500 Call with highest OI = Resistance zone.
This helps you create a trading range.
10. Option Chain for Intraday & Swing Trading
✅ Intraday Trading:
Watch change in OI during live market.
Spike in Call OI → Possible resistance forming.
Spike in Put OI → Possible support forming.
✅ Swing Trading:
Analyze overall OI trend.
Look at monthly expiry data.
Identify positional buildup or unwinding.