Titan – Symmetrical Triangle Breakout on the Hourly ChartTitan Company Ltd – Symmetrical Triangle Breakout on the Hourly Chart
NSE:TITAN
📈 Pattern & Setup:
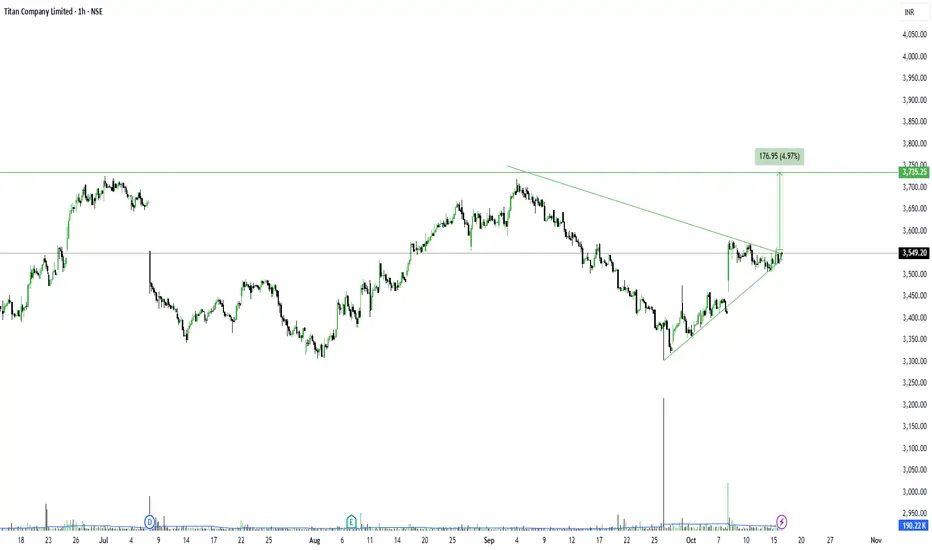
Titan is forming a clean symmetrical triangle pattern on the hourly chart after a corrective phase. The price has started compressing within tighter highs and higher lows, indicating reduced volatility before a potential expansion.
Now, the stock is approaching the apex of the triangle near 3550 levels — a zone that often precedes a decisive breakout. A breakout above 3560–3570 could trigger a sharp rally, targeting previous swing highs around 3730+.
The structure suggests quiet accumulation with energy being stored for the next impulsive leg.
📝 Trade Plan:
✍Entry: Above 3570 (breakout confirmation)
🚩Stop-Loss: 3470 (below trendline support)
🎯Targets:
Target 1 → 3660
Target 2 → 3750 (5% potential move)
💡 Pyramiding Strategy:
1. Enter 60% position above 3570
2. Add 40% more above 3600 on volume expansion
3. Trail stop-loss to 3520 once price sustains above 3660
🧠 Logic Behind Selecting this Trade:
After a steady retracement from 3800+, Titan has found base support and is now compressing near breakout levels. The converging structure hints at a potential trend reversal on shorter timeframes, aligning with sectoral strength in consumer discretionary.
A breakout here could also mark a continuation of Titan’s long-term bullish trend from the weekly chart.
Keep Learning. Keep Earning.
Let’s grow together 📚🎯
🔴Disclaimer:
This analysis is for educational purposes only. Not a buy/sell recommendation. Please do your own research or consult your financial advisor before trading.
Tatastocks
TATA COMMUNICATIONS Swing Trade Hello,
Trend-Based Analysis. Buy the Dips, Sell The Rallies, Also Following the Trend. Let's see where the Price Action takes us, Riding the wave. Potential trade setups based on trend momentum.
Technical analysis based on trend identification and momentum, Looking for high-probability setups within the prevailing trend.
Analyzing the current market trend and potential future price movement. Focusing on risk management and reward-to-risk ratios.
Details is Mentioned in Chart, Read carefully.. .

Buy Tata ELXSI 40% gainTata Elxsi may give a buy signal according to range bound trading strategy if it falls more from the present levels. The lower point of the range is 6436 and the upper limit of this range is 9043. So you need to buy at 6436 and sell at 9043 for around 40% gain. The stock has covered this range for three times in the past. There is another range with lower limit 5895 and upper limit again as 9043. So you need to buy at 5895 and sell at 9043 for around 51% gain in the stock. The stock has covered this range for two times in the past.
Please do your own analysis before investing.
Hope you learned something new from my ideas.
Do like, share and follow me. Thank you!

Voltas can freeze to recent lowIt seems that a strong reaction was formed at these current price but it also not ruled out that if price trades below the first upper red line then the first target can be the second red line and then the Black line !
