TradeCityPro BNBUSDT Heading Toward a New ATH?👋 Welcome to TradeCityPro Channel!
Let’s dive into the BNB (Binance Coin) analysis — one of the strongest and most bullish charts in the market. Currently, after correcting from its All-Time High (ATH), the price is consolidating within a sideways range, showing that buyers and sellers are in a tug-of-war.
🌐 Overview of Bitcoin
Before we begin, note that we’ve moved the Bitcoin analysis to a dedicated daily report for deeper insights into its market behavior, dominance, and trend structure:
👉 TradeCityPro Bitcoin Daily Analysis
📊 Technical Overview (4H Timeframe)
After facing a heavy rejection from its ATH, BNB once again attempted to retest that level. However, a fake breakout (false move above resistance) led to another sharp correction, pushing the price back down into the range.
Interestingly, this correction bounced exactly from the $1054 support zone, the same level that previously acted as a strong reversal point. This repeated reaction confirms how critical this support is — not only because it aligns with the 50% Fibonacci retracement level, but also due to its importance in the Dow Theory structure as a mid-wave equilibrium.
📈 Long Setup (Bullish Scenario)
If price breaks above $1129, it could trigger an early long position setup — signaling that buyers are regaining control before another major leg up. This move would likely be the early breakout signal ahead of a potential new ATH attempt.
📉 Short Setup (Bearish Scenario)
For short positions, the $1054 level remains the key trigger. A clean breakdown below this zone would indicate the loss of a major support and could open the way for a deeper retracement.
However, keep in mind — this is a high-impact support zone, so avoid placing tight stop-losses or over-leveraged entries. Price volatility is expected to increase around this level.
🎯 Conclusion
BNB remains one of the strongest altcoins structurally, and as long as it holds above the $1050 region, the bullish structure remains valid. The next few sessions will be crucial — watch the $1129 breakout for confirmation of renewed bullish momentum, or the $1054 breakdown for signs of weakness.
📝 Final Thoughts
Stay calm, trade wisely, and let's capture the market's best opportunities!
This analysis reflects our opinions and is not financial advice.
TCP

TradeCityPro | Bitcoin Daily Analysis #204👋 Welcome to TradeCity Pro!
Let’s go over today’s Bitcoin analysis, Bitcoin is still ranging, so let’s take a close look at the market together.
⏳ 1-Hour Timeframe
Yesterday, Bitcoin had a short position trigger at the 107,486 zone, which was activated.
🔔 The break of this level created a short-term bearish move, and if you had opened a position on Bitcoin, you probably hit your stop-loss by now.
✨ However, considering the dominance charts, short positions on altcoins made more sense — and if you had opened them, they likely hit their targets.
✔️ Currently, after the fake-out of this zone and the breakout above 108,943, price has made a bullish move up to the next resistance area at 110,213.
💥 Now, price has returned again to the 108,943 level. Volume has decreased along this move, and overall, this drop in volume shows that the market isn’t in a great condition — so the best move for now is to stay without a position.
📊 For short-term trades, if price breaks 110,213, we can open a continuation long position.
💡 For short positions, the current trigger is still 107,486, but since this level has already been faked once, we should wait for another reaction to it — and only open a position if it breaks again on the next attempt.
❌ Disclaimer ❌
Trading futures is highly risky and dangerous. If you're not an expert, these triggers may not be suitable for you. You should first learn risk and capital management. You can also use the educational content from this channel.
Finally, these triggers reflect my personal opinions on price action, and the market may move completely against this analysis. So, do your own research before opening any position.

TradeCityPro | AAVE: Trendline Squeeze, Breakout Loading👋 Welcome to TradeCity Pro!
In this analysis, I want to review the AAVE coin for you—one of the lending projects in the Ethereum ecosystem, currently ranked 32 on CoinMarketCap with a market cap of $3.36 billion.
⏳ 4H Timeframe
On the 4-hour timeframe, this coin started a downtrend after being rejected from the 301.39 zone and, together with a descending trendline, has been moving downward.
✔️ Price has now reached it again, faked it once, and is still ranging around this trendline.
✨ If the trendline is broken and price holds above its trigger, it can begin an upward move.
⚡️ The trigger we have to confirm the start of this move is the 234.24 zone. With the break of this trigger, we can also use it to open a long position.
📊 The next resistance levels this coin has are 261.25 and 302.18, each of which can be used as the next trigger for a long position.
💥 For a short position, the main floor that has formed is 202.86. A break of this level will be a very good trigger for a short position.
📝 Final Thoughts
Stay calm, trade wisely, and let's capture the market's best opportunities!
This analysis reflects our opinions and is not financial advice.
Share your thoughts in the comments, and don’t forget to share this analysis with your friends! ❤️

TradeCityPro Academy | Support & Resistance Part 2👋 Welcome to TradeCityPro Channel
🎓 Educational Section Technical Analysis Training Series
Welcome to the Educational Content Section of our channel!
Here, we aim to teach you technical analysis from A to Z through structured playlists.
We’ll cover everything from risk and capital management, Dow Theory, support and resistance, trends, and market cycles, to more advanced concepts.
Our lessons are based on both real market experience and The Handbook of Technical Analysis.
🎨 What is Technical Analysis?
Technical Analysis (TA) is a method used to forecast price movements in financial markets by analyzing historical data, especially price and volume.
It’s based on the idea that history tends to repeat itself, and that recurring patterns can reveal profitable trading opportunities.
📚 Complete Guide to Support and Resistance in Technical Analysis
🧩 Introduction
In technical analysis, two key concepts form the foundation of nearly every trading strategy: Support and Resistance.
These levels represent areas on the chart where the price is likely to change direction, as buyers or sellers regain control.
But to truly understand them, you must go beyond the chart — because their origin lies in human psychology and collective behavior.
🟢 What Is Support?
A support level is an area where buying pressure increases and prevents the price from falling further.
It acts like a floor where buyers believe the asset has become cheap enough to buy.
As a result, the market tends to bounce upward from that area.
For example, if Bitcoin has repeatedly reversed near $55,000, that zone is considered a support level.
🔴 What Is Resistance?
A resistance level is an area where selling pressure increases and stops the price from rising higher.
When the price approaches this level, traders often feel the asset is “too expensive” and start selling.
For example, if Ethereum has failed multiple times to break above $3,800, that area is considered resistance.
💭 Why Do Support and Resistance Form?
Markets are not just numbers — they’re the reflection of human emotion and crowd behavior.
When large groups of traders make similar decisions (to buy or sell) around the same price zone, it creates a psychological memory in the market.
If price has reacted there before, traders remember it — and react the same way next time.
This repetition forms the backbone of how support and resistance levels develop and strengthen over time.
🧠 The Role of Emotion and Crowd Psychology
Emotions drive markets.
When prices rise quickly, people experience FOMO (Fear of Missing Out) and rush to buy — until demand runs out and price reverses (resistance).
When prices fall, fear of losing money triggers panic selling — until sellers dry up and price rebounds (support).
This constant emotional cycle repeats endlessly, creating recurring support and resistance zones on every chart.
⚙️ The Structure Behind the Levels
From a technical perspective, these levels form because large clusters of orders are placed around them.
Traders typically set buy orders below the current price (near support) and sell orders above it (near resistance).
So when the market reaches those areas, there’s a strong battle between buyers and sellers.
That’s why these zones are not just psychological — they’re also built into the order flow and liquidity structure of the market.
📈 Reactions and Breakouts
When price approaches a key level, two outcomes are possible: Reaction or Breakout.
In a reaction, price touches the level and reverses — meaning buyers or sellers defend it successfully.
In a breakout, price pushes through with strong momentum and high volume, breaking the market’s previous belief.
After a breakout, the level often changes its role:
A broken resistance becomes new support.
A broken support becomes new resistance.
This behavior is known as Role Reversal, one of the most powerful principles in chart analysis.
⚖️ The Professional Mindset
Support and resistance are zones, not exact numbers.
The market may slightly move above or below them before reacting — this is known as a fake breakout.
Professional traders look for confirmation such as reversal candles, volume spikes, or RSI divergences before acting.
The key is not to memorize lines but to read crowd behavior.
Once you understand why people buy or sell at certain points, you gain a true edge over the average trader.
🧩 Conclusion
Support and resistance are not just lines on a chart; they are the visible footprints of fear, greed, and collective memory in the market.
By understanding their psychological and structural roots, you can identify better entry and exit zones,
predict reactions more accurately, and avoid emotional mistakes.
Learn to read the emotions behind the candles — because at its core, the market is simply a crowd of human minds trying to win.

TradeCityPro | Bitcoin Daily Analysis #203👋 Welcome to TradeCity Pro!
Let’s get into today’s Bitcoin analysis. The market is really uncertain right now and is showing a lot of random, irrational volatility. It’s very important to stay closely updated in these kinds of situations — so let’s dive into the chart.
⏳ 1-Hour Timeframe
Yesterday, Bitcoin made an upward move and managed to reach the 113,429 zone.
⭐ However, after this move, the price faced a strong rejection from that level, completely retraced the entire upward move, and is now back around the 107,486 support zone.
✔️ We can say that this move was a Dead Cat Bounce (DCB) because heavy bearish momentum has now entered the market, and Bitcoin is currently fluctuating around 107,486.
✨ A break of this level will give us the main confirmation of a bearish continuation, and the next bearish leg of Bitcoin could begin.
🧩 For now, it’s better not to rely on momentum oscillators like RSI, since the market lacks clear momentum. However, the volume shows that buyers have been trying to defend the 107,486 support — but as long as the price stays below 113,429, those efforts won’t have much impact.
💥 I’ll open a short position if 107,486 breaks. The next zones that the price might react to are 106,319 and 104,488.
🔔 For long positions, there’s currently no valid trigger — we’ll need to wait until a proper structure forms.
❌ Disclaimer ❌
Trading futures is highly risky and dangerous. If you're not an expert, these triggers may not be suitable for you. You should first learn risk and capital management. You can also use the educational content from this channel.
Finally, these triggers reflect my personal opinions on price action, and the market may move completely against this analysis. So, do your own research before opening any position.

TradeCityPro | ZEC: Bullish Structure Holding Strong👋 Welcome to TradeCity Pro!
In this analysis, I want to review the ZEC coin for you — one of the Privacy and Layer 1 projects, ranked 28th on CoinMarketCap with a market cap of $4.42 billion.
⏳ 4-Hour Timeframe
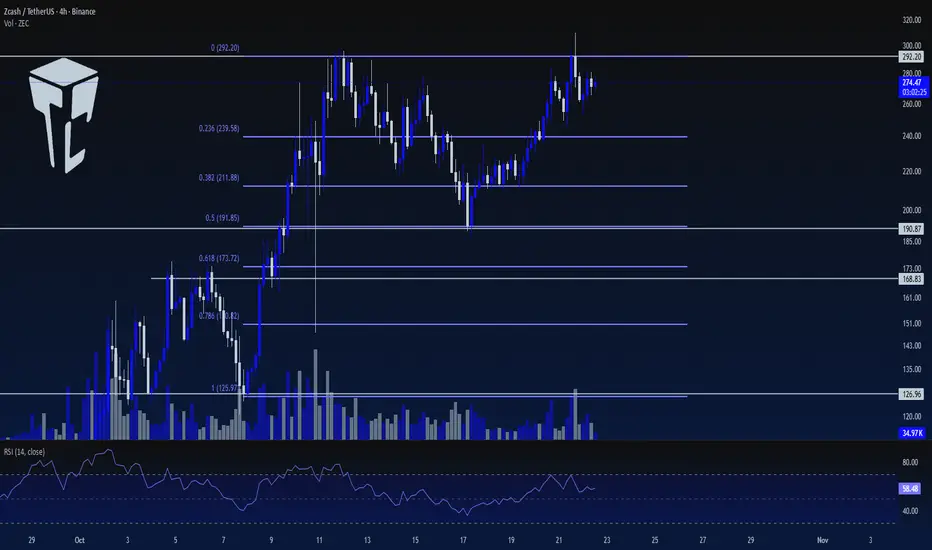
This coin has a bullish trend on the 4-hour timeframe and, after its upward movement, has now entered a corrective phase.
🔍 This correction has reached the 0.5 Fibonacci level of the previous wave, and the price has now returned to the 292.20 zone, having already reacted to it once.
✔️ Breaking the 292.2 level could mark the beginning of the next bullish wave. From a momentum standpoint, the bullish trend is very strong, and with the breakout of 292.2, the momentum will likely continue.
⚡️ Currently, the volume favors buyers, and as the price approaches the 292.2 zone, buying volume is increasing, which raises the probability of breaking this resistance.
💥 The break of level 70 and the RSI entering Overbuy are strong momentum triggers for a long position.
📊 For a short position on this coin, I’ll wait until a bearish structure forms. The current structure is very bullish, so I’d rather open short positions on other coins.
⭐ We’ll get the confirmation of a bearish reversal only after the price stabilizes below 190.87.
📝 Final Thoughts
Stay calm, trade wisely, and let's capture the market's best opportunities!
This analysis reflects our opinions and is not financial advice.
Share your thoughts in the comments, and don’t forget to share this analysis with your friends! ❤️
TradeCityPro | BCHUSDT Next Major Rally or a Sharp Correction?👋 Welcome to TradeCityPro Channel!
💨 Let’s take a deep dive into the BCHUSDT (Bitcoin Cash) chart on the daily timeframe, where the market is showing some very intriguing behavior that could signal the next major move — either a powerful bullish continuation or a short-term bearish pullback.
📊 Over the past several weeks, BCH has maintained a generally bullish structure, moving in sync with broader market sentiment. However, the recent rejection from the $623.4 resistance zone has created a bit of uncertainty. This level is extremely important because it aligns with a major supply zone visible on both the daily and weekly charts, marking a strong area where sellers have historically entered the market.
📈 If BCH manages to break and close above $623.4 with strong volume, that would likely confirm a continuation of the bullish trend, potentially targeting the next psychological zones around $700 and $745. This move could also attract more traders and liquidity into BCH, reinforcing the bullish momentum.
📉 On the other hand, the $451 support has been a critical demand zone where buyers have consistently stepped in to prevent deeper declines. If the price loses this level and closes below it, it could trigger a short-term bearish phase, potentially leading to a retest of the $390–$400 range. Such a move would likely flush out weak long positions before the next major leg upward.
🧠 From a trader’s perspective, patience is key right now. For long entries, we should wait for a confirmed trend reversal on lower timeframes (4H or 1H) — ideally after a clean breakout and retest of the $623.4 resistance. However, for short setups, a breakdown below $451 would provide a much safer and more high-probability entry, especially if accompanied by strong volume and bearish momentum.
⚖️ In conclusion, BCH is currently in a decision-making zone — the market is consolidating between two major levels that will define its next big trend. Whether we see a massive bullish rally above $623.4 or a temporary bearish correction below $451, both opportunities can be highly profitable if timed correctly.
Key Levels to Watch:
🟩 Bullish Trigger: Break and retest above $623.4
🟥 Bearish Trigger: Breakdown and close below $451
📝 Final Thoughts
Stay calm, trade wisely, and let's capture the market's best opportunities!
This analysis reflects our opinions and is not financial advice.

TradeCityPro | Bitcoin Daily Analysis #202👋 Welcome to TradeCity Pro!
Let's dive into the Bitcoin analysis. The market has dropped again today. Let's review today's entry points together.
⏳ 1-Hour Timeframe
Yesterday, Bitcoin was rejected from the resistance it created at 111645, and with the bearish structure it formed, it made a bearish move after breaking 110213.
💥 The reason I removed the zone is that the price no longer reacts to it, and it seems that a box has formed between 111645 and 106319.
✅ The trigger that the price is currently on is the 107486 zone. Breaking this zone can give us a very risky and short-term short position.
✨ The RSI oscillator is near the Oversell zone, and with stabilization below this zone, there is a higher chance of a more significant bearish move with more momentum.
🔍 However, I can't rely much on momentum oscillators like RSI in these market conditions since there isn't a clear trend, and we don't have significant momentum to analyze the market with.
🧩 In these conditions, I believe the best tool to use is volume. Right now, selling volume is higher in the market, and in this bearish correction, the volume is decreasing. So, by breaking 107486, we can open a short position.
⚡️ If the market forms more structure and a long trigger appears, we can also open a long position after breaking the trigger.
💡 But the main triggers for long are breaking 111645, and for short, it's breaking 106319. The triggers between these two zones are very risky positions, and I won’t open a position with them. I prefer to wait for the main triggers.
❌ Disclaimer ❌
Trading futures is highly risky and dangerous. If you're not an expert, these triggers may not be suitable for you. You should first learn risk and capital management. You can also use the educational content from this channel.
Finally, these triggers reflect my personal opinions on price action, and the market may move completely against this analysis. So, do your own research before opening any position.

TradeCityPro | AERO: Testing Support After Trendline Break👋 Welcome to TradeCity Pro!
In this analysis, I want to review the AERO coin for you. This project is one of the well-known DEXs, ranked 84th on CoinMarketCap with a market cap of $727 million.
📅 Daily Timeframe
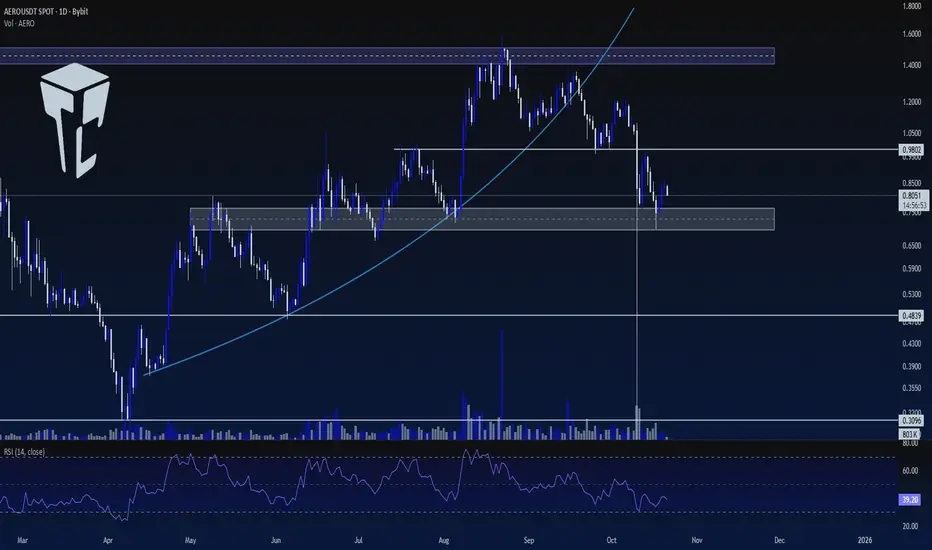
In the daily timeframe, since the last time I analyzed it for you, the coin has been rejected from its resistance zone and has broken its curved trendline.
✨ With the break of this trendline and the activation of the 0.9802 trigger, the bearish move of this coin has continued, and the price has dropped to around $0.7.
💥 Currently, the price is still sitting on this support zone and has penetrated it twice so far. If this level breaks, the trend of this coin will turn bearish.
🧮 In that case, we can open a short position on the break of this zone. The next support levels are 0.4839 and 0.3096.
📊 For a long position, we can act after the price stabilizes above 0.9802. The main trigger for the bullish trend will be breaking the 1.5$ zone.
📝 Final Thoughts
Stay calm, trade wisely, and let's capture the market's best opportunities!
This analysis reflects our opinions and is not financial advice.
Share your thoughts in the comments, and don’t forget to share this analysis with your friends! ❤️
TradeCityPro | WALUSDT Could We See a 50% Move Soon?👋 Welcome to TradeCityPro Channel!
Let’s take a closer look at the WALUSDT chart on the 4-hour timeframe — a setup that might be preparing for a major move.
🌐 Overview of Bitcoin
Before we begin, let me remind you that we’ve moved the Bitcoin analysis section to a separate daily report at your request, so we can go into more detail about Bitcoin’s condition, price action, and dominance:
After the sharp breakdown from the 0.3633 level, WAL experienced a strong bearish wave that pushed the price down to a new support zone. Since then, the price has started to accumulate within a clear 4-hour range, suggesting that market participants are waiting for confirmation before the next big move.
This accumulation phase is important because such zones often act as the foundation for explosive movements once price breaks out — either upward or downward.
🔹 Bullish scenario (Long setup):
If price manages to break above 0.2520 with noticeable volume, it could trigger a strong bullish move. This breakout would signal that buyers have regained control, and we could see a rapid move toward higher resistance zones — potentially offering up to 50% upside from the current range. The key here is volume confirmation — without it, the breakout could turn into a fake-out.
🔹 Bearish scenario (Short setup):
On the other hand, the bearish trigger lies at the 0.1993 support. If the price decisively breaks and closes below this level, it would confirm that sellers are in control. However, before opening a short position, we want to see the price retest this zone (a rejection from below) to confirm the breakdown. This would reduce risk and provide a safer entry opportunity.
In summary, WALUSDT is currently in a neutral-to-accumulation zone — the breakout direction will define the next strong move. Traders should stay patient, monitor volume closely, and be ready to act once one of these key levels gives way.
📝 Final Thoughts
Stay calm, trade wisely, and let's capture the market's best opportunities!
This analysis reflects our opinions and is not financial advice.

TradeCityPro | Bitcoin Daily Analysis #201👋 Welcome to TradeCity Pro!
Let’s dive into Bitcoin analysis—its bullish trend seems to have started again, so it’s very important to analyze it well for the new week.
⏳ 1-Hour Timeframe
Yesterday, Bitcoin formed a range box between 106319 and 107301, and by breaking the top of this box, it began an upward move.
📊 After breaking this box, buying volume increased sharply, and after a pullback to this area, the move continued up to 111645.
✔️ Now the price has returned above the 109000 zone, but it still hasn’t managed to hold above this area.
⭐ With a break of 111645, we can confirm that price has stabilized above the 109000 zone.
🔍 In that case, we can enter a long position on the break of 111645; and at the same time, we’ll confirm that the break of 109000 was a fake-out.
💥 The trigger on the RSI is the 74.53 level. With RSI entering Overbought and breaking 74.53, the next bullish leg can begin.
❌ Disclaimer ❌
Trading futures is highly risky and dangerous. If you're not an expert, these triggers may not be suitable for you. You should first learn risk and capital management. You can also use the educational content from this channel.
Finally, these triggers reflect my personal opinions on price action, and the market may move completely against this analysis. So, do your own research before opening any position.

TradeCityPro | DASHUSDT One of the Strongest Long Setups🔹 DASHUSDT Technical Analysis — One of the Strongest Long Setups in the Market!
Let’s dive into the analysis of DASH, one of the older yet technically impressive coins in the crypto market. Despite the recent volatility, DASH has shown stronger bullish structure compared to most altcoins — making it one of the few charts currently setting up for a potential long opportunity.
🌐 Market Overview
Before diving deeper, keep in mind that today and tomorrow the global crypto market will have lower liquidity due to the weekend. This often leads to lighter trading volume and potentially unpredictable price spikes.
If you’re planning to open a position during this period, it’s highly recommended to reduce your risk and avoid over-leveraging.
📈 Bullish Scenario (Long Setup)
The DASHUSDT chart is showing a strong bullish structure and currently consolidating below a key resistance level at 49.22.
Once this level is broken with confirmation and volume, it will likely trigger a sharp upward continuation — supported by the strong uptrend that has been forming over recent sessions.
✅ Long Trigger: Break and close above 49.22
🎯 Target 1: 55.00
🎯 Target 2: 60.13
The area around 60.13 is crucial, as breaking it could lead to a parabolic move, especially if market volume returns early next week.
📉 Bearish Scenario (Short Setup)
In case of an early rejection from 49.22 or a sudden drop due to the low-volume weekend conditions, we should monitor the 39.34 support zone closely.
A confirmed break below 39.34 could signal a shift in short-term momentum, opening room for a short position.
However, it’s worth noting that other coins — particularly TON and IMX — currently show cleaner short triggers and may offer better setups in case the market turns bearish.
⚙️ Risk Management Tip
Since the market is in a low-liquidity phase, it’s important to:
Use smaller position sizes
Wait for candle confirmation on the breakout
Set tight stop-losses just below local supports
🎯 Summary
🟢 Long Setup: Break above 49.22 → Target 55.00–60.13
🔴 Short Setup: Break below 39.34 → Conservative entry (better shorts on TON & IMX)
⚠️ Note: Trade lighter due to low weekend volume
💬 Final Thoughts:
DASH stands out among altcoins this week with a notably stronger bullish chart structure. The trend is constructive, and if momentum continues next week, a confirmed breakout could deliver one of the best long trades of the week.
Stay patient, watch the 49.22 level closely, and let the market confirm the move before entering.

TradeCityPro | Bitcoin Daily Analysis #200👋 Welcome to the 200th Daily Bitcoin Analysis!
To celebrate this milestone, today’s analysis will be different, our main focus will be on the XAUBTC chart, but first, let’s analyze gold and Bitcoin separately before combining the two.
✅ Gold
📅 Monthly Timeframe
Gold is in a completely bullish trend on the monthly chart and, in its latest candle, has set a new all-time high (ATH) at $4,380.
💥 The momentum of this wave, which started from $1,980, is extremely strong — not only has the RSI entered the Overbought zone, but it has also broken through the Overextended level at 85.55 and now stands at 92.
💫 The last time gold’s RSI was in this range was in 1973, about 50 years ago, making this the strongest momentum in half a century.
🔍 Considering that gold has risen more than 100% without any major correction and has reached the 1.5 Fibonacci level, the probability of a correction is very high.
✨ If the price continues to rise sharply in the next few candles, the trend will become unsustainable, since there has been no major profit-taking — a warning sign for the continuation of the rally.
📊 In case of a correction, the main Fibonacci support levels are $3,500 and $3,000, which are potential targets if the retracement begins.
👀 If this happens, two possible scenarios emerge:
🏦 Increased gold supply, which is unlikely due to its scarcity.
Profit-taking by institutional “whales” (such as government treasuries), which is a much more probable reason for a correction.
💵 Bitcoin
📅 Weekly Timeframe
Bitcoin is in a bullish trend on the weekly timeframe, having completed seven upward waves, with the last peak recorded at $124,000.
✨ This top was a fake breakout, followed by a correction candle, and the price is now moving toward the $100,000 region.
🔽 A strong triple-top bearish divergence is visible on the RSI, with confirmation coming if 44.53 is broken.
📉 If confirmed, Bitcoin could enter a long-term corrective phase, with possible downside targets near $70,000.
🧩 However, the trend is still bullish as long as no lower high and lower low form below $100,000.
💡 This means Bitcoin could potentially make one more upward leg, forming a rare nine-wave pattern — uncommon, but possible.
⭐ Given that gold is likely entering a correction phase, the profits taken by gold whales could flow into crypto, potentially fueling Bitcoin’s next upward wave.
👑 Bitcoin Dominance (BTC.D)
📅 Weekly Timeframe
Bitcoin dominance has been in an uptrend, reaching 65.84%, but weakness in the trend and rejection from that level triggered a deep correction.
💫 After breaking 60.64, it fell to 57%, where it has since bounced.
📉 If dominance forms a lower high below 60.64 (or even below 65.84) and then breaks 57%, that would confirm a downtrend.
✔️ In that case, the dominance targets are 55.26, 51.06, and potentially 47.76.
🚀 This scenario suggests that if money flows from gold into Bitcoin, it may later flow into altcoins as dominance declines — setting the stage for a possible altcoin season.
🔑 XAUBTC Chart
🧮 This chart represents gold’s strength relative to Bitcoin.
As seen, its overall structure in recent years has been bearish, reflecting stronger investment interest in Bitcoin compared to gold.
📊 The trend remained bearish until early 2025, showing no weakness — until recently.
🔺 After finding support near 0.027, the trend has shown clear signs of weakening, and price action now hints at potential bullish reversal signals.
☘️ The price has already formed a higher low, and if it consolidates above 0.03922 next week, we’ll have the first confirmation of a trend reversal.
📈 The main bullish confirmation would come after breaking 0.04543.
⚡️ However, one possible scenario is that gold enters a correction phase while Bitcoin completes its final bullish wave.
✅ Since this chart faces two strong resistance zones, rejection from 0.03922 or 0.04543 could send it back toward 0.027, implying a gold correction and a final bullish leg for Bitcoin.
💥 Considering Bitcoin dominance may also drop, it’s likely that capital will first move from gold into Bitcoin, and then, as dominance falls, into altcoins — potentially triggering the long-awaited altcoin season where altcoins experience explosive rallies.
⚖️ This is just one possible market scenario; other outcomes are possible.
Remember: Always conduct your own research before making any investment decisions.

TradeCityPro | AVAX: Downtrend Persists Near Key Support👋 Welcome to TradeCity Pro!
In this analysis, I want to review the AVAX coin. One of the older crypto projects active in RWA, it has a market cap of $8.48 billion, ranking 18th on CoinMarketCap.
⏳ 1-Hour Timeframe
On the 1-hour chart, we see a downtrend in this coin, which has continued after last week’s decline.
✨ After the 23.06 level was faked, bearish momentum entered the market, and a new downwave began. After breaking the 20.68 support, the price dropped to 19.10 and is now in a correction and pullback phase.
📊 Volume has significantly decreased during this correction, indicating the strength of the downtrend. Although today is Saturday and the overall market volume is low, if the price moves back toward 19.10 with increasing volume, we can confirm the volume for the bearish trend.
💥 The RSI oscillator is correcting alongside the price and, after exiting Oversold, is currently around 50.
⭐ If the 50 level breaks, it signals that bearish momentum in the market has decreased, and AVAX could enter a range-bound or corrective structure.
✔️ On the other hand, if selling volume returns and RSI moves toward 30, breaking this level would bring bearish momentum back into the market. In this case, breaking the 19.10 trigger allows us to open a short position.
🔍 For now, there are better coins for long positions that have recovered more. On AVAX, as long as it stays below 20.68, long positions don’t make much sense.
📝 Final Thoughts
Stay calm, trade wisely, and let's capture the market's best opportunities!
This analysis reflects our opinions and is not financial advice.
Share your thoughts in the comments, and don’t forget to share this analysis with your friends! ❤️

TradeCityPro | Bitcoin Daily Analysis #199👋 Welcome to TradeCity Pro!
Let's move on to the Bitcoin analysis—finally, the support zone that Bitcoin had has been broken. Let’s review what has happened in the market.
⏳ 1-Hour Timeframe
Yesterday, Bitcoin was in a consolidation range between 110,420 and 111,714.
✔️ Bearish signals, such as Dow Theory structure and high volume on bearish candles, were visible on the chart. Eventually, this led to a break of the consolidation from the bottom, and the support zone was lost.
🔍 After breaking this area, the price retraced and, with a consolidation below 107,790, confirmed the breakdown.
⭐ Currently, the price is at 104,483 and has reacted to it. The RSI oscillator has also reacted to its support area at 22.19 and has been holding near this support for several candles.
📉 If the price continues to drop, this 104,483 level serves as a suitable trigger for the next entry point. Breaking this level could push the price toward the next support zones.
🔔 However, if the price moves upward and fully fakes this drop, a consolidation above 111,714 would confirm a bullish reversal for Bitcoin, allowing us to open long positions with much higher momentum.
💡 I personally opened a short position at the break of 110,420 and am not taking profit yet because it’s a good entry point. In the future, if the market drops, it will provide strong support for subsequent positions.
💥 If the market moves upward and this short gets stopped, strong bullish momentum will enter, making the long positions we open in the next leg very attractive.
❌ Disclaimer ❌
Trading futures is highly risky and dangerous. If you're not an expert, these triggers may not be suitable for you. You should first learn risk and capital management. You can also use the educational content from this channel.
Finally, these triggers reflect my personal opinions on price action, and the market may move completely against this analysis. So, do your own research before opening any position.

TradeCityPro | MNT: Key Support Holds for Now👋 Welcome to TradeCity Pro!
In this analysis, I want to review the MNT coin for you. One of the most well-known Ethereum Layer 2 projects, with a market cap of $5.03 billion, ranked 26th on CoinMarketCap.
⏳ 4-Hour Timeframe
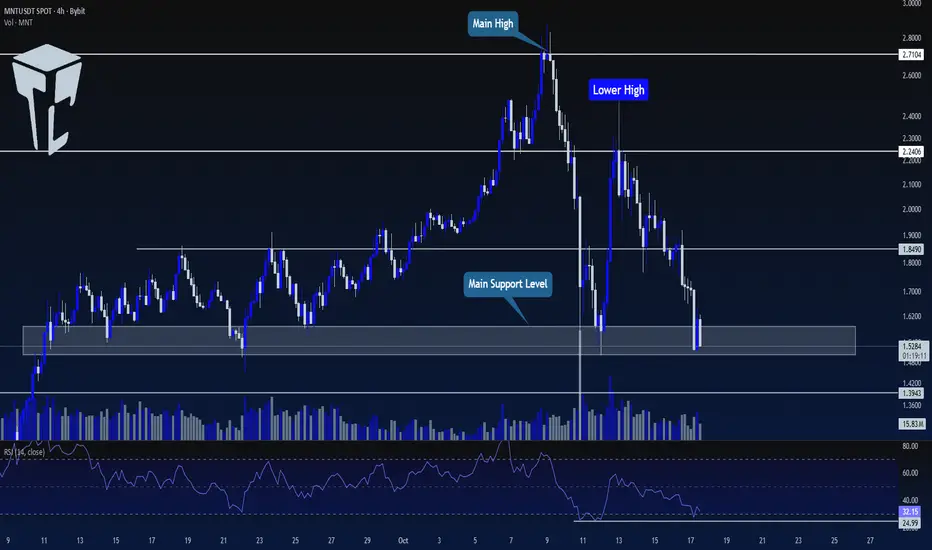
On the 4-hour chart, after an upward trend, this coin reached 2.7104 and has now entered a corrective and bearish phase.
✨ There is a very important support zone around 1.5. The price has reacted to it once, formed a lower high, and is now back on support.
💥 The RSI oscillator is near the Oversell area. Breaking 24.99 will push the RSI into Oversell.
✔️ For short positions, we can enter on a break of this range. However, since the higher timeframe trend is bullish, we should also consider confirmation from volume, RSI, and Bitcoin.
🔍 For long positions, we need to wait until the market structure creates a proper trigger for a long. Currently, the main confirmation for bullishness is a break of 2.2406.
📝 Final Thoughts
Stay calm, trade wisely, and let's capture the market's best opportunities!
This analysis reflects our opinions and is not financial advice.
Share your thoughts in the comments, and don’t forget to share this analysis with your friends! ❤️
TradeCityPro | Bitcoin Daily Analysis #198👋 Welcome to TradeCity Pro!
Let’s move on to the Bitcoin analysis. The price is in a very sensitive area, so it’s important to have a proper analysis.
⏳ 1-Hour Timeframe
Bitcoin is still near its support zone and is ranging around 110,420.
⭐ The top of the range is 111,714, and the price is forming a compression.
✨ At the same time, the RSI has formed a range between 30 and 50 and is oscillating.
📊 If 110,420 breaks, the probability of breaking the range increases significantly, and this level can serve as a good early short trigger.
📈 For long positions, we can open the first position on a break of 111,714. The next entry points would be 113,218 and 115,698.
🔔 Currently, market volume is very important and decisive; the volume favors sellers, which increases the probability of a bearish scenario. If this volume persists, Bitcoin’s support zone could break.
💥 However, if we see a change in volume and buying volume exceeds selling volume, we can expect Bitcoin to be supported in this area and move upwards.
❌ Disclaimer ❌
Trading futures is highly risky and dangerous. If you're not an expert, these triggers may not be suitable for you. You should first learn risk and capital management. You can also use the educational content from this channel.
Finally, these triggers reflect my personal opinions on price action, and the market may move completely against this analysis. So, do your own research before opening any position.

TradeCityPro | LINKUSDT Early Entry Trigger!👋 Welcome to TradeCityPro Channel!
After the recent sharp drop in the overall crypto market, which was mainly triggered by negative news from China and the United States, Chainlink (LINK) also faced a noticeable correction —just like most major altcoins.
At the moment, LINK is trading below a strong daily resistance zone, which has previously acted as a key turning point for price action. The market seems to have already completed a pullback to this resistance, showing that sellers are still active in this region. This is a critical area — the next move from here could define whether LINK continues downward or begins a new bullish leg.
If the market manages to break above this resistance with strong momentum and confirmed volume, we can start looking for long opportunities on lower timeframes (like 4H or 1H). However, it’s safer to wait for confirmation of structure change, such as the formation of higher highs and higher lows, before entering.
For a short position, there are two clear scenarios:
If the price gets rejected from the 20.12 level, it can trigger a short setup early, especially if accompanied by bearish candlestick patterns like a shooting star or bearish engulfing.
A confirmed break below 17.07 would act as a stronger confirmation for continued downside momentum — showing that buyers are losing control and the bearish pressure remains dominant.
On the other hand, if the price breaks above 20.12, we’ll likely see a move toward the descending trendline that has been guiding LINK’s movement for several weeks. This zone could become another major decision point:
A rejection from the trendline might start another wave of correction,
But if LINK breaks above it and sustains momentum, it would signal the start of a potential bullish reversal, possibly leading to a trend continuation toward higher resistances.
🔹 Bullish confirmation: Break and retest above 20.12 with structure change on lower TFs.
🔹 Bearish confirmation: Breakdown below 17.07, or rejection from 20.12 with volume.
🔹 Neutral zone: Between 17.07 – 20.12, where price might consolidate before its next move.
Overall, LINK is currently in a decision-making phase, and traders should stay patient, waiting for clear breakout or rejection signals before entering any position.
📝 Final Thoughts
Stay calm, trade wisely, and let's capture the market's best opportunities!
This analysis reflects our opinions and is not financial advice.
Share your thoughts in the comments, and don’t forget to share this analysis with your friends! ❤️

TradeCityPro | HYPE: Watch Key Zones for Trend Reversal👋 Welcome to TradeCity Pro!
In this analysis, I want to review the HYPE coin for you. This is one of the crypto DEX projects, with a market cap of $13.26 billion, ranking 11th on CoinMarketCap.
📅 Daily Timeframe
On the daily timeframe, this coin had an upward channel that, after being rejected from its peak, started a downward move and managed to break the channel’s support.
💥 Currently, the price is forming a bearish structure, creating lower highs and lower lows.
✅ The support level the price is currently interacting with is 36.682, which has previously been an important low and is now reacting to it.
✨ A minor high has formed at 42.862, and if the price breaks this level, it could start forming a bullish structure again.
📊 With a break above 42.862, we can open a long position on lower timeframes. The important support level is 36.682, and breaking it could serve as a risky short trigger.
🔔 The main confirmation of the bearish trend will be given with the break of this coin’s support zone; for bullish continuation, the next wave would start after breaking the 55 level.
📝 Final Thoughts
Stay calm, trade wisely, and let's capture the market's best opportunities!
This analysis reflects our opinions and is not financial advice.
Share your thoughts in the comments, and don’t forget to share this analysis with your friends! ❤️

TradeCityPro | Bitcoin Daily Analysis #197👋 Welcome to TradeCity Pro!
Let’s go over the Bitcoin analysis; today Bitcoin is still in a downtrend, so let’s review the market together.
⏳ 1-Hour Timeframe
After the double top that was activated yesterday near the 0.5 Fibonacci level, Bitcoin entered a corrective phase after reaching the double top target.
✨ The double top peaks formed around 115,698, but after completing the downward move and starting the correction, the price created lower highs around 113,218, and now with the break of 111,975, a new high-volume downward move has started.
📊 The price is moving back toward the supply zone it had, and reaching this area is not a good sign for the upward trend we see on higher timeframes.
🔽 The more the price approaches this zone and reacts to it, the weaker the zone becomes, and the probability of it breaking increases in subsequent attempts.
✔️ Currently, this is the third time the price is approaching this zone, and each time it comes with higher volume and a stronger bearish structure; if this pattern repeats several times, the zone could break.
🔍 Whether the price breaks or finds support at this zone can determine the market’s direction for the upcoming period.
⚡️ If the zone breaks, Bitcoin could enter a corrective and range-bound phase for weeks or even months, and we wouldn’t be able to open positions effectively in that environment.
📈 If the zone holds as support, with a break above 115,698, we would get confirmation of Bitcoin’s bullish trend and could expect the next upward move to begin.
❌ Disclaimer ❌
Trading futures is highly risky and dangerous. If you're not an expert, these triggers may not be suitable for you. You should first learn risk and capital management. You can also use the educational content from this channel.
Finally, these triggers reflect my personal opinions on price action, and the market may move completely against this analysis. So, do your own research before opening any position.

TradeCityPro | Ethereum: Break Key Levels for Bullish Momentum👋 Welcome to TradeCity Pro!
In this analysis, I want to examine Ethereum for you. The queen of the crypto market, with a $497 billion market cap, is ranked 2nd on CoinMarketCap.
⏳ 4-Hour Timeframe
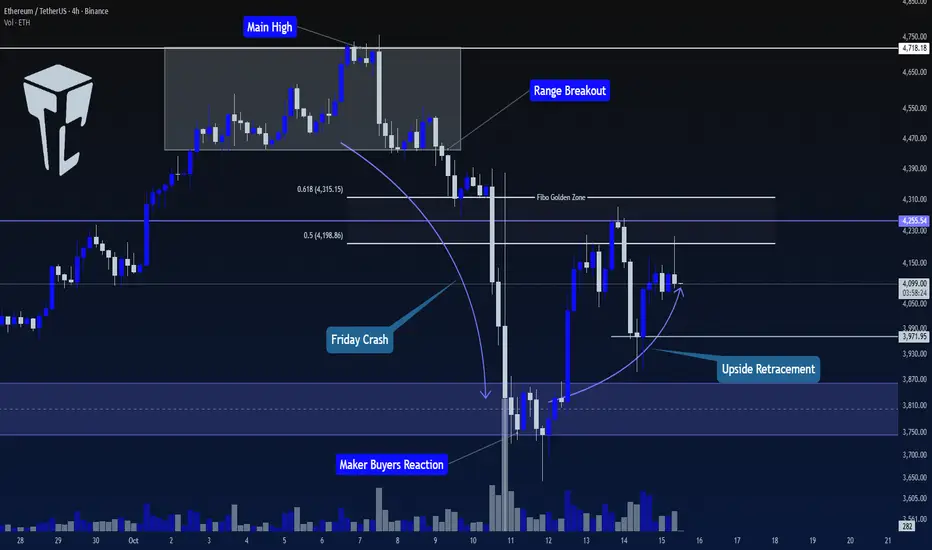
This coin, in the 4-hour timeframe, after breaking the range box at the ceiling and moving towards the $3800 level, is now in a corrective phase and has made an upward movement.
⭐ The $3800 range is a very important level for Ethereum, and this zone was not broken even during the Flash Crash that occurred on Friday, and it managed to hold the price.
🚀 Now, the price has moved towards the range between 0.5 and 0.618 Fibonacci, and has been rejected once from this zone.
📊 The volume has not increased significantly during this move and has mostly been range-bound, but since the price has created a higher low at the $3971 level, if the buying volume increases, we can get a bullish confirmation with a break of the $4255 level.
💥 Since this coin is bullish on higher timeframes and is currently undergoing a correction on lower timeframes, if the price gives us a small bullish confirmation, we can take advantage of it and open a long position.
💡 The main resistance for Ethereum is the $4718 level. Breaking this level will initiate the next wave for Ethereum on higher timeframes, such as weekly charts. Therefore, I will try to open a long position on Ethereum before this level is broken.
📈 The suitable trigger right now seems to be a break of $4255. With this break, the price can move towards $4718, and if this level is broken, we will have a very good and attractive entry point for a long position on Ethereum.
📝 Final Thoughts
Stay calm, trade wisely, and let's capture the market's best opportunities!
This analysis reflects our opinions and is not financial advice.
Share your thoughts in the comments, and don’t forget to share this analysis with your friends! ❤️
TradeCityPro Academy | Support & Resistance Part 1👋 Welcome to TradeCityPro Channel
🎓 Educational Section Technical Analysis Training Series
Welcome to the Educational Content Section of our channel!
Here, we aim to teach you technical analysis from A to Z through structured playlists.
We’ll cover everything from risk and capital management, Dow Theory, support and resistance, trends, and market cycles, to more advanced concepts.
Our lessons are based on both real market experience and The Handbook of Technical Analysis.
🎨 What is Technical Analysis?
Technical Analysis (TA) is a method used to forecast price movements in financial markets by analyzing historical data, especially price and volume.
It’s based on the idea that history tends to repeat itself, and that recurring patterns can reveal profitable trading opportunities.
🧩 The Human Concept of Support and Resistance
Support and resistance aren’t just numbers on a chart — they’re the result of collective human behavior.
When large groups of traders make similar decisions — buying or selling — at a certain level, that area becomes psychologically important in the market.
Support forms where fear of missing out (FOMO) drives people to buy.
Resistance forms where fear of loss motivates people to sell.
💭 The Psychology Behind Formation
In a downtrend, when prices fall too much, traders start thinking “It can’t go any lower”, and buying pressure increases — forming support.
In an uptrend, when prices rise sharply, traders think “It’s too expensive now”, and selling pressure builds — forming resistance.
So, these levels reflect emotions like fear, greed, and FOMO, rather than being purely technical.
🌍 Real-World Example
When the USD price drops so low that everyone rushes to buy it — that’s support.
When gold becomes so expensive that no one wants to buy anymore — that’s resistance.
Markets operate on these same human instincts — only visualized through candlesticks and numbers.
🧩 Introduction
In technical analysis, two key concepts exist in nearly every strategy:
Support and Resistance.
These are areas on the chart where the probability of price reaction or reversal is high.
🟢 What is Support?
A support level is where buying pressure is expected to increase and prevent further price decline.
It acts like a floor that supports price.
📘 Example:
If Bitcoin repeatedly bounces from the $60,000 level, that area is considered a support zone.
🔴 What is Resistance?
A resistance level is where selling pressure increases, preventing further price growth.
It acts like a ceiling that stops price movement upward.
📘 Example:
If Ethereum fails multiple times to break above $3,800, that area is a resistance zone.
📈 How to Identify Support and Resistance
There are several methods to detect these levels:
Previous Highs and Lows:
The most common method — look for areas where price has reacted before.
Trendlines:
In an uptrend, connecting higher lows gives you a dynamic support line.
Moving Averages (MA):
MAs like MA50 or MA200 often act as dynamic support or resistance.
Supply and Demand Zones:
Areas where heavy buying or selling previously occurred.
⚙️ Market Psychology
Support and resistance are emotional memory points for traders.
When price reacts to a level once, it becomes mentally significant, leading to similar reactions in the future.
That’s why these zones often repeat over time.
🔄 Breakouts and Role Reversal
When price breaks a support or resistance level with strong volume and momentum, that level changes its role:
Broken resistance → becomes new support
Broken support → becomes new resistance
This concept is known as Role Reversal.
🎯 Importance of Timeframes
Support and resistance zones on higher timeframes (Daily, Weekly) carry greater significance, since more traders and larger volumes are involved.
🧠 Pro Tips
✅ Always treat support and resistance as zones, not fixed price points.
✅ If price approaches a level with strong momentum, it’s more likely to break it.
✅ Combine S/R with candlestick reactions, volume, and indicators for confirmation.
✅ Levels that repeat multiple times usually grow stronger over time.
💬 Summary
Support and resistance are the foundation of technical analysis.
Understanding them helps you find better entry and exit points and gain a deeper insight into market psychology.
TradeCityPro | Bitcoin Daily Analysis #196👋 Welcome to TradeCity Pro!
Let’s go over Bitcoin's analysis. The price is moving down again, so let’s review Bitcoin's movement together.
⏳ 1-Hour Timeframe
Yesterday, we had a trigger at the $115,698 zone, but the price couldn't sustain above this level, and Bitcoin's downward movement has started again.
✔️ A double top pattern has formed in this timeframe, and the trigger for this pattern activation was $113,991, which has now been activated. With the large volume, the price has managed to stabilize even below the $111,278 zone.
💥 The RSI oscillator has once again entered Oversell, and the price has reached near our support zone.
⚡️ If this support zone is broken, we can open a short position. Otherwise, I won’t be opening any short positions with other triggers.
📈 For a long position, we need a very strong reaction and significant bullish momentum at the support zone. In this case, the main trigger for a long would be $115,698, but we can also use earlier triggers if they form.
📊 For now, I will wait to see how the price reacts to the zone and then look for the trigger. The only trigger I have at the moment is $115,698.
❌ Disclaimer ❌
Trading futures is highly risky and dangerous. If you're not an expert, these triggers may not be suitable for you. You should first learn risk and capital management. You can also use the educational content from this channel.
Finally, these triggers reflect my personal opinions on price action, and the market may move completely against this analysis. So, do your own research before opening any position.
