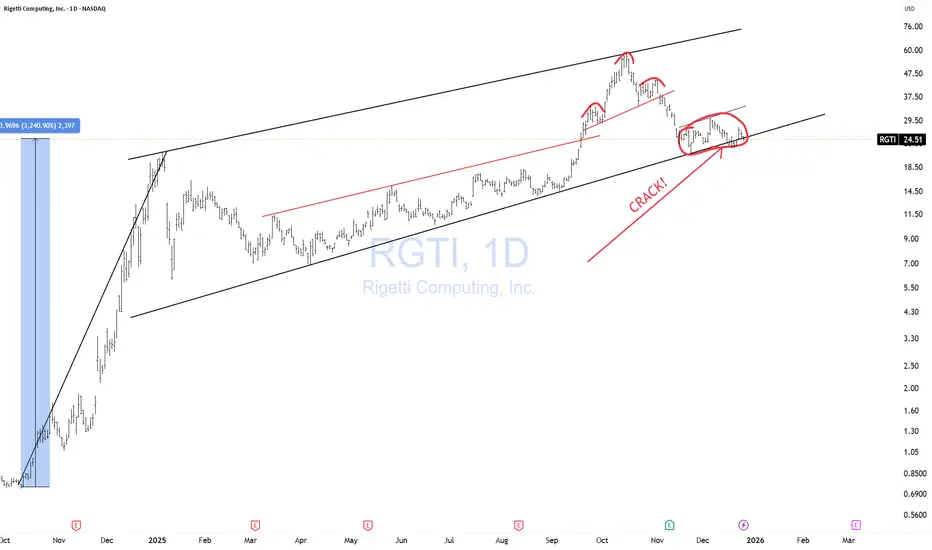
RGTI CRACK!RGTI is up 3,240% in a bit over a year, with A complete wave 3 up with a hook, Rising F flag that CRACKED, with a broken H&S within it, followed by a low base consolidation flagging out.
RGTI has already lost about -57% of its total value. Don't be surprised if it loses another 50% from here given the run it has had. (And no, I am not doing Trump math. hahah!)
THANK YOU for getting me to 5,000 followers! 🙏🔥
Let’s keep climbing.
If you enjoy the work:
👉 Drop a solid comment
Let’s push it to 6,000 and keep building a community grounded in truth, not hype.
Techincalanalysis
ZEC's Last Correction Before Moon Mission?We’re Watching
Yello Paradisers! Are you ready for the last piece of the puzzle before #ZEC makes its next massive move? We've been carefully tracking this setup, and it's reaching a critical inflection point—ignore it at your own risk.
💎#ZECUSDT is currently forming an ending diagonal pattern within the C wave of an ABC correction. This structure typically appears at the end of a larger corrective phase and often signals a major reversal or the beginning of a strong new trend. As it stands, wave 4 of this diagonal appears to be completed, and wave 5 is now in progress. This final leg of the pattern is what we’re watching closely.
💎What adds weight to our current thesis is the presence of a clear bearish divergence between wave 3 and wave 5 within the diagonal pattern. Divergence at this stage provides strong confluence that the move is likely nearing exhaustion. A confirmed break of the diagonal pattern would then offer a very attractive risk-reward trading opportunity for those ready to act decisively.
💎Wave C, if it isn’t truncated, should ideally complete below the low of wave 1. That’s why, at this stage, we are only observing, not entering. We want to see this structure fully play out before taking any action. The bottom of wave A serves as a key support zone, while the top of wave B is expected to provide minor resistance. These zones will be critical to monitor once price action starts reacting more aggressively.
💎If this analysis plays out as anticipated, we could be witnessing the final correction before #ZEC begins a new macro impulse — potentially pushing us to a new lifetime high. But again, patience and precision are essential here.
That is why we are playing it safe right now, Paradisers. If you want to be consistently profitable, you need to be extremely patient and always wait only for the best, highest probability trading opportunities.
MyCryptoParadise
iFeel the success🌴

JASMY 1W: Sweep the Channel Base → Breakout SetupJASMY is still trading inside a clean macro downtrend channel on the weekly. At this point, I’m not trying to predict the exact bottom — I’m waiting for the sequence that usually precedes a real shift in momentum.
My most likely scenario
1. One more dip into the lower channel boundary (demand + dynamic support)
2. Strong defense (long wicks / rejection, weekly close reclaiming the level)
3. Break above the channel as confirmation (ideally followed by a retest)
I’m not interested in being first. I’m interested in being right — letting price prove it’s done bleeding before the breakout.
Key levels I’m watching
• Lower channel / demand: ~0.0050–0.0048
• Invalidation: clean loss below that zone → opens the door to ~0.0035–0.0028
• Confirmation: channel break + reclaim of ~0.008
Targets if the breakout triggers
• 0.008 (first major reclaim / decision level)
• 0.012 (next structural resistance)
• 0.017 (extended target if momentum follows through)
Market read
This looks like a classic “dip → liquidity sweep → defend → break structure” setup.
If the channel base holds, the best R:R usually comes on the channel break, not on the first touch.

NZD/CHF BEARS WILL DOMINATE THE MARKET|SHORT
Hello, Friends!
The BB upper band is nearby so NZD-CHF is in the overbought territory. Thus, despite the uptrend on the 1W timeframe I think that we will see a bearish reaction from the resistance line above and a move down towards the target at around 0.463.
Disclosure: I am part of Trade Nation's Influencer program and receive a monthly fee for using their TradingView charts in my analysis.
✅LIKE AND COMMENT MY IDEAS✅

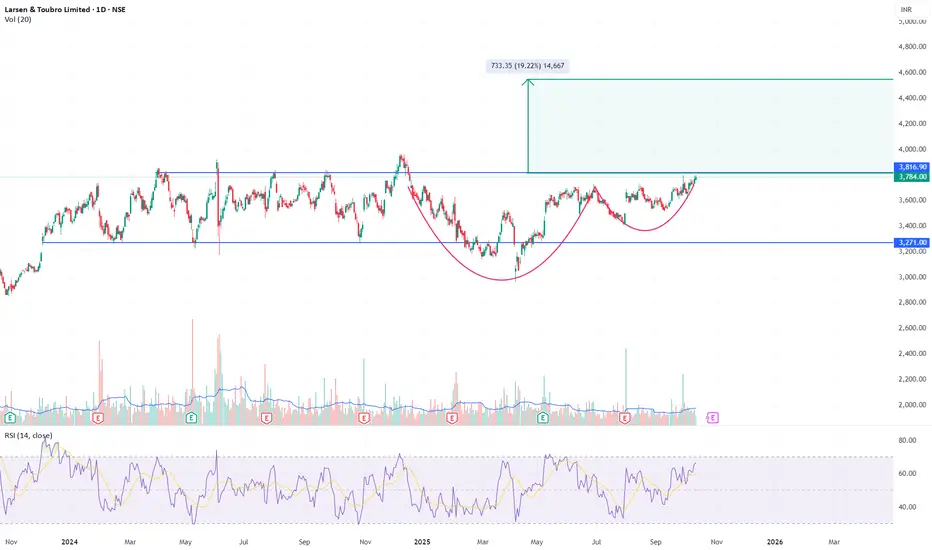
L&T - Cup and Handle Formation Near Breakout ZoneChart Structure:
Larsen & Toubro is forming a textbook Cup and Handle pattern that’s now testing its neckline around ₹3,780–₹3,800. The base extends nearly 10 months, creating a strong accumulation structure with a shallow handle - ideal for a breakout continuation.
Technical Highlights:
Cup Base: ₹2,950–₹3,000
Neckline: ₹3,780–₹3,800 (currently being tested)
Handle: Tight consolidation with declining volume, now showing early expansion
RSI: Rising towards 70, confirming strengthening momentum
Volume: Reaccumulation behavior - lighter on corrections, heavier on upswings
Trade Setup:
Breakout Confirmation: Close above ₹3,820 with strong volume
Target: ₹4,500–₹4,550 (≈19% upside from breakout)
Stop-Loss: ₹3,600 (below handle low)
Technical Verdict:
A sustained move above ₹3,820 would mark a major bullish continuation, potentially initiating a new leg in L&T’s long-term uptrend. Pattern reliability is high given the depth, duration, and structure of the base.
Disclaimer:
This analysis is for educational and informational purposes only and does not constitute investment advice or a recommendation to buy or sell any security. Markets involve risk, and past performance does not guarantee future results. Conduct your own due diligence or consult a qualified financial advisor before making investment decisions.
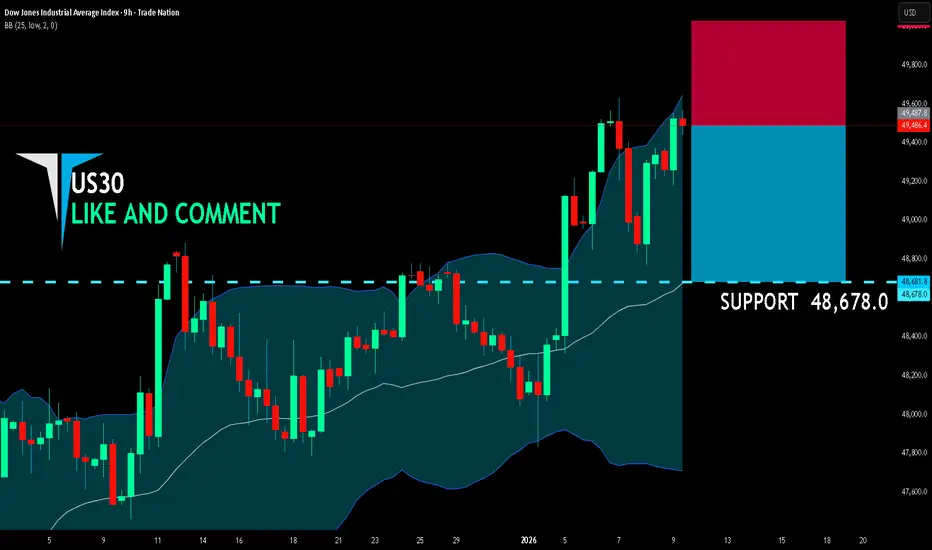
US30 BEARISH BIAS RIGHT NOW| SHORT
US30 SIGNAL
Trade Direction: short
Entry Level: 49,487.8
Target Level: 48.678.0
Stop Loss: 50,026.4
RISK PROFILE
Risk level: medium
Suggested risk: 1%
Timeframe: 9h
Disclosure: I am part of Trade Nation's Influencer program and receive a monthly fee for using their TradingView charts in my analysis.
✅LIKE AND COMMENT MY IDEAS✅
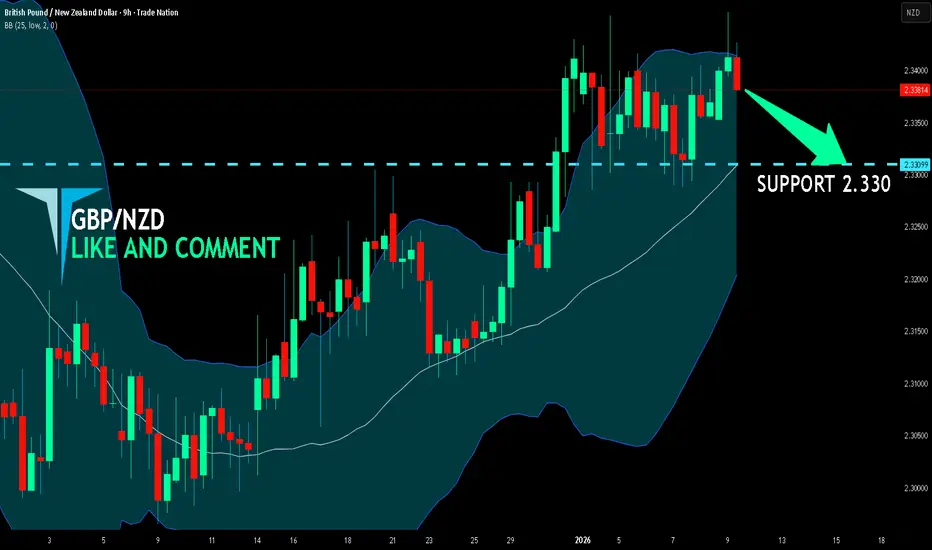
GBP/NZD BEST PLACE TO SELL FROM|SHORT
Hello, Friends!
GBP/NZD is trending down which is clear from the red colour of the previous weekly candle. However, the price has locally surged into the overbought territory. Which can be told from its proximity to the BB upper band. Which presents a great trend following opportunity for a short trade from the resistance line above towards the demand level of 2.330.
Disclosure: I am part of Trade Nation's Influencer program and receive a monthly fee for using their TradingView charts in my analysis.
✅LIKE AND COMMENT MY IDEAS✅
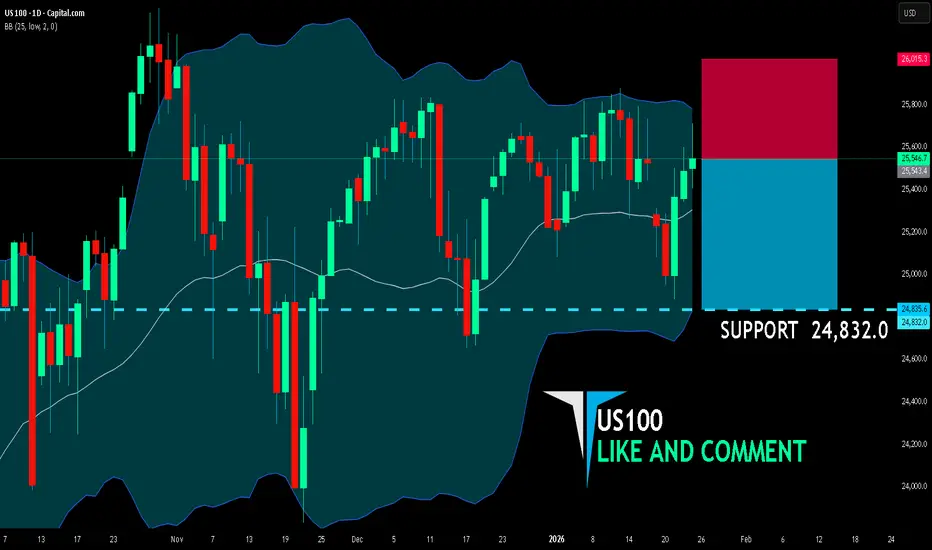
US100 BEST PLACE TO SELL FROM|SHORT
US100 SIGNAL
Trade Direction: short
Entry Level: 25,543.4
Target Level: 24,832.0
Stop Loss: 26,015.3
RISK PROFILE
Risk level: medium
Suggested risk: 1%
Timeframe: 1D
Disclosure: I am part of Trade Nation's Influencer program and receive a monthly fee for using their TradingView charts in my analysis.
✅LIKE AND COMMENT MY IDEAS✅
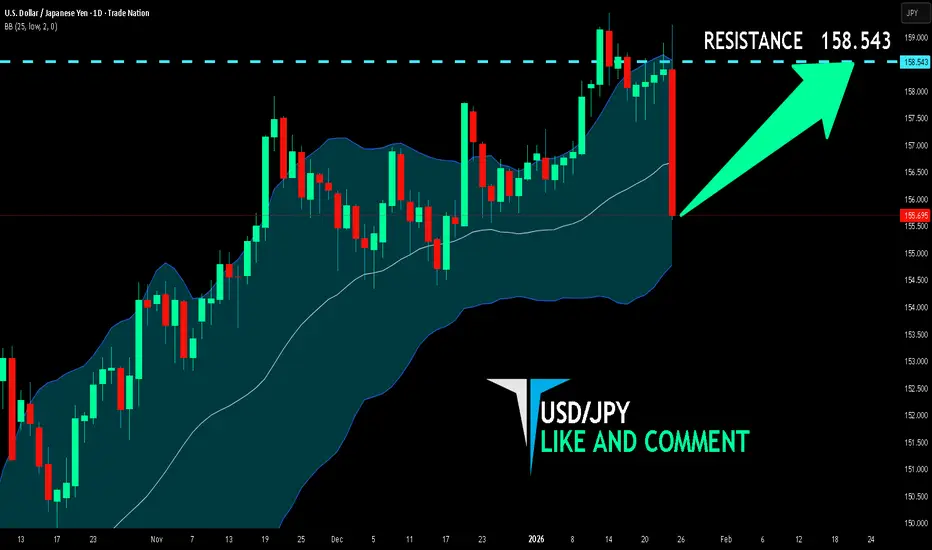
USD/JPY BULLS ARE STRONG HERE|LONG
Hello, Friends!
We are targeting the 158.543 level area with our long trade on USD/JPY which is based on the fact that the pair is oversold on the BB band scale and is also approaching a support line below thus going us a good entry option.
Disclosure: I am part of Trade Nation's Influencer program and receive a monthly fee for using their TradingView charts in my analysis.
✅LIKE AND COMMENT MY IDEAS✅
AUD/USD SHORT FROM RESISTANCE
Hello, Friends!
We are now examining the AUD/USD pair and we can see that the pair is going up locally while also being in a uptrend on the 1W TF. But there is also a powerful signal from the BB upper band being nearby, indicating that the pair is overbought so we can go short from the resistance line above and a target at 0.679 level.
Disclosure: I am part of Trade Nation's Influencer program and receive a monthly fee for using their TradingView charts in my analysis.
✅LIKE AND COMMENT MY IDEAS✅

US30 SENDS CLEAR BULLISH SIGNALS|LONG
US30 SIGNAL
Trade Direction: short
Entry Level: 49,128.6
Target Level: 49,509.4
Stop Loss: 48,876.2
RISK PROFILE
Risk level: medium
Suggested risk: 1%
Timeframe: 1h
Disclosure: I am part of Trade Nation's Influencer program and receive a monthly fee for using their TradingView charts in my analysis.
✅LIKE AND COMMENT MY IDEAS✅

USD/CAD SHORT FROM RESISTANCE
Hello, Friends!
We are now examining the USD/CAD pair and we can see that the pair is going up locally while also being in a uptrend on the 1W TF. But there is also a powerful signal from the BB upper band being nearby, indicating that the pair is overbought so we can go short from the resistance line above and a target at 1.381 level.
Disclosure: I am part of Trade Nation's Influencer program and receive a monthly fee for using their TradingView charts in my analysis.
✅LIKE AND COMMENT MY IDEAS✅

GBP/CAD BEARS ARE GAINING STRENGTH|SHORT
Hello, Friends!
Previous week’s green candle means that for us the GBP/CAD pair is in the uptrend. And the current movement leg was also up but the resistance line will be hit soon and upper BB band proximity will signal an overbought condition so we will go for a counter-trend short trade with the target being at 1.851.
Disclosure: I am part of Trade Nation's Influencer program and receive a monthly fee for using their TradingView charts in my analysis.
✅LIKE AND COMMENT MY IDEAS✅

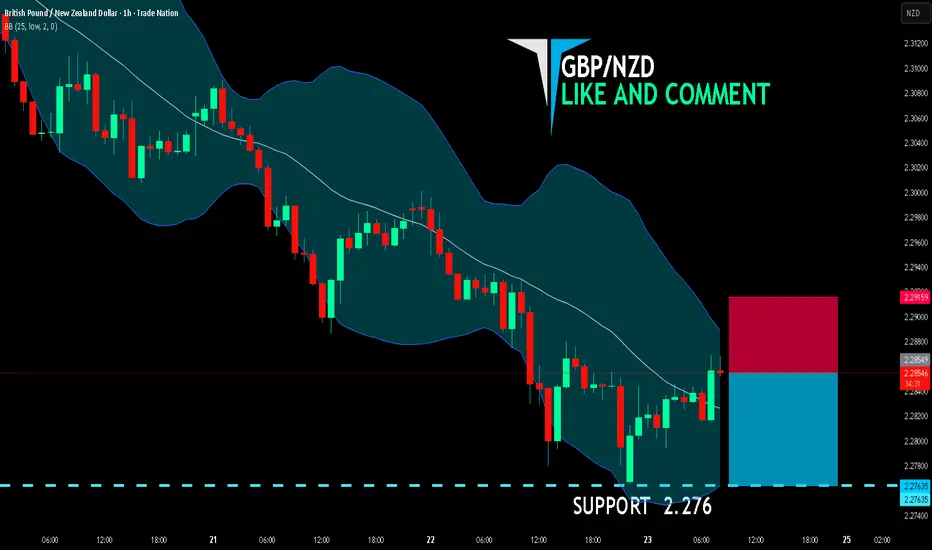
GBP/NZD SELLERS WILL DOMINATE THE MARKET|SHORT
GBP/NZD SIGNAL
Trade Direction: short
Entry Level: 2.285
Target Level: 2.276
Stop Loss: 2.291
RISK PROFILE
Risk level: medium
Suggested risk: 1%
Timeframe: 1h
Disclosure: I am part of Trade Nation's Influencer program and receive a monthly fee for using their TradingView charts in my analysis.
✅LIKE AND COMMENT MY IDEAS✅
1997 - 6 months CUP & HANDLE══════════════════════════════
Since 2014, my markets approach is to spot
trading opportunities based solely on the
development of
CLASSICAL CHART PATTERNS
🤝Let’s learn and grow together 🤝
══════════════════════════════
Hello Traders ✌
After a careful consideration I came to the conclusion that:
- it is crucial to be quick in alerting you with all the opportunities I spot and often I don't post a good pattern because I don't have the opportunity to write down a proper didactical comment;
- since my parameters to identify a Classical Pattern and its scenario are very well defined, many of my comments were and would be redundant;
- the information that I think is important is very simple and can easily be understood just by looking at charts;
For these reasons and hoping to give you a better help, I decided to write comments only when something very specific or interesting shows up, otherwise all the information is shown on the chart.
Thank you all for your support
🔎🔎🔎 ALWAYS REMEMBER
"A pattern IS NOT a Pattern until the breakout is completed. Before that moment it is just a bunch of colorful candlesticks on a chart of your watchlist"
═════════════════════════════
⚠ DISCLAIMER ⚠
The content is The Art Of Charting's personal opinion and it is posted purely for educational purpose and therefore it must not be taken as a direct or indirect investing recommendations or advices. Any action taken upon these information is at your own risk.

PIPR - 4 months CUP & HANDLE══════════════════════════════
Since 2014, my markets approach is to spot
trading opportunities based solely on the
development of
CLASSICAL CHART PATTERNS
🤝Let’s learn and grow together 🤝
══════════════════════════════
Hello Traders ✌
After a careful consideration I came to the conclusion that:
- it is crucial to be quick in alerting you with all the opportunities I spot and often I don't post a good pattern because I don't have the opportunity to write down a proper didactical comment;
- since my parameters to identify a Classical Pattern and its scenario are very well defined, many of my comments were and would be redundant;
- the information that I think is important is very simple and can easily be understood just by looking at charts;
For these reasons and hoping to give you a better help, I decided to write comments only when something very specific or interesting shows up, otherwise all the information is shown on the chart.
Thank you all for your support
🔎🔎🔎 ALWAYS REMEMBER
"A pattern IS NOT a Pattern until the breakout is completed. Before that moment it is just a bunch of colorful candlesticks on a chart of your watchlist"
═════════════════════════════
⚠ DISCLAIMER ⚠
The content is The Art Of Charting's personal opinion and it is posted purely for educational purpose and therefore it must not be taken as a direct or indirect investing recommendations or advices. Any action taken upon these information is at your own risk.

GNK - 4 months CUP & HANDLE══════════════════════════════
Since 2014, my markets approach is to spot
trading opportunities based solely on the
development of
CLASSICAL CHART PATTERNS
🤝Let’s learn and grow together 🤝
══════════════════════════════
Hello Traders ✌
After a careful consideration I came to the conclusion that:
- it is crucial to be quick in alerting you with all the opportunities I spot and often I don't post a good pattern because I don't have the opportunity to write down a proper didactical comment;
- since my parameters to identify a Classical Pattern and its scenario are very well defined, many of my comments were and would be redundant;
- the information that I think is important is very simple and can easily be understood just by looking at charts;
For these reasons and hoping to give you a better help, I decided to write comments only when something very specific or interesting shows up, otherwise all the information is shown on the chart.
Thank you all for your support
🔎🔎🔎 ALWAYS REMEMBER
"A pattern IS NOT a Pattern until the breakout is completed. Before that moment it is just a bunch of colorful candlesticks on a chart of your watchlist"
═════════════════════════════
⚠ DISCLAIMER ⚠
The content is The Art Of Charting's personal opinion and it is posted purely for educational purpose and therefore it must not be taken as a direct or indirect investing recommendations or advices. Any action taken upon these information is at your own risk.

6457 - 5 months RECTANGLE══════════════════════════════
Since 2014, my markets approach is to spot
trading opportunities based solely on the
development of
CLASSICAL CHART PATTERNS
🤝Let’s learn and grow together 🤝
══════════════════════════════
Hello Traders ✌
After a careful consideration I came to the conclusion that:
- it is crucial to be quick in alerting you with all the opportunities I spot and often I don't post a good pattern because I don't have the opportunity to write down a proper didactical comment;
- since my parameters to identify a Classical Pattern and its scenario are very well defined, many of my comments were and would be redundant;
- the information that I think is important is very simple and can easily be understood just by looking at charts;
For these reasons and hoping to give you a better help, I decided to write comments only when something very specific or interesting shows up, otherwise all the information is shown on the chart.
Thank you all for your support
🔎🔎🔎 ALWAYS REMEMBER
"A pattern IS NOT a Pattern until the breakout is completed. Before that moment it is just a bunch of colorful candlesticks on a chart of your watchlist"
═════════════════════════════
⚠ DISCLAIMER ⚠
The content is The Art Of Charting's personal opinion and it is posted purely for educational purpose and therefore it must not be taken as a direct or indirect investing recommendations or advices. Any action taken upon these information is at your own risk.

SILVER BEST PLACE TO SELL FROM|SHORT
SILVER SIGNAL
Trade Direction: short
Entry Level: 9,526.0
Target Level: 9,216.0
Stop Loss: 9,733.5
RISK PROFILE
Risk level: medium
Suggested risk: 1%
Timeframe: 1h
Disclosure: I am part of Trade Nation's Influencer program and receive a monthly fee for using their TradingView charts in my analysis.
✅LIKE AND COMMENT MY IDEAS✅

GOLD BEARISH BIAS RIGHT NOW| SHORT
Hello, Friends!
GOLD uptrend evident from the last 1W green candle makes short trades more risky, but the current set-up targeting 4,723.13 area still presents a good opportunity for us to sell the pair because the resistance line is nearby and the BB upper band is close which indicates the overbought state of the GOLD pair.
Disclosure: I am part of Trade Nation's Influencer program and receive a monthly fee for using their TradingView charts in my analysis.
✅LIKE AND COMMENT MY IDEAS✅

EUR/NZD BEST PLACE TO BUY FROM|LONG
EUR/NZD SIGNAL
Trade Direction: long
Entry Level: 1.990
Target Level: 2.003
Stop Loss: 1.982
RISK PROFILE
Risk level: medium
Suggested risk: 1%
Timeframe: 1h
Disclosure: I am part of Trade Nation's Influencer program and receive a monthly fee for using their TradingView charts in my analysis.
✅LIKE AND COMMENT MY IDEAS✅

AUD/USD SHORT FROM RESISTANCE
AUD/USD SIGNAL
Trade Direction: short
Entry Level: 0.680
Target Level: 0.677
Stop Loss: 0.682
RISK PROFILE
Risk level: medium
Suggested risk: 1%
Timeframe: 1h
Disclosure: I am part of Trade Nation's Influencer program and receive a monthly fee for using their TradingView charts in my analysis.
✅LIKE AND COMMENT MY IDEAS✅

XAUUSD – H2 Technical Outlook Liquidity Pullback Within a Strong Bullish Structure | Lana ✨
Gold continues to trade within a well-defined bullish structure on the H2 timeframe. The recent surge was impulsive, followed by a healthy retracement that appears to be rebalancing liquidity rather than signaling a trend reversal.
Price action remains constructive as long as the market respects key structural levels and the ascending trendline.
📈 Market Structure & Trend Context
The overall trend remains bullish, with higher highs and higher lows still intact.
Price continues to respect the ascending trendline, which has acted as reliable dynamic support throughout the uptrend.
The recent pullback occurred after an aggressive upside expansion, fitting the classic sequence:
Impulse → Pullback → Continuation
No clear distribution pattern is visible at this stage. As long as structural support holds, the bias remains BUY on pullbacks, not selling strength.
🔍 Key Technical Zones & Value Areas
Primary Buy POC Zone: 4764 – 4770
This area represents a high-volume node (POC) and aligns closely with the rising trendline.
It is a natural zone where price may rebalance before resuming the bullish trend.
Secondary Value Area (VAL–VAH): 4714 – 4718
A deeper liquidity zone that could act as support if sell pressure temporarily increases.
Near-term resistance: 4843
Acceptance above this level strengthens the continuation scenario.
Psychological reaction zone: 4900
Likely to generate short-term hesitation or profit-taking.
Higher-timeframe expansion targets:
5000 (psychological level)
2.618 Fibonacci extension, where major liquidity may be resting.
🎯 Trading Plan – H2 Structure-Based
✅ Primary Scenario: BUY the Pullback
Buy Entry:
👉 4766 – 4770
Lana prefers to engage only if price pulls back into the POC zone and shows bullish confirmation on H1–H2 (trendline hold, strong rejection of lower prices, or bullish follow-through).
Stop Loss:
👉 4756 – 4758
(Placed ~8–10 points below entry, beneath the POC zone and the ascending trendline)
🎯 Take Profit Targets (Scaled Exits)
TP1: 4843
First resistance zone — partial profit-taking recommended.
TP2: 4900
Psychological level with potential short-term reactions.
TP3: 5000
Major psychological milestone and upside expansion target.
TP4 (extension): 5050 – 5080
Area aligned with the 2.618 Fibonacci extension and higher-timeframe liquidity.
The preferred approach is to scale out gradually and protect the position, adjusting risk as price confirms continuation.
🌍 Macro Context (Brief)
According to Goldman Sachs, central banks in emerging markets are expected to continue diversifying reserves away from traditional assets and into gold.
Average annual central bank gold purchases are projected to reach around 60 tons by 2026, reinforcing structural demand for gold.
This ongoing accumulation supports the idea that pullbacks are more likely driven by positioning and profit-taking, rather than a shift in long-term fundamentals.
🧠 Lana’s View
This remains a pullback within a bullish trend, not a bearish reversal.
The focus stays on buying value at key liquidity zones, not chasing price at highs.
Patience, structure, and disciplined execution remain the edge.
✨ Respect the trend, trade the structure, and let price come to your zone.
