AUD/CHF SENDS CLEAR BEARISH SIGNALS|SHORT
Hello, Friends!
Previous week’s green candle means that for us the AUD/CHF pair is in the uptrend. And the current movement leg was also up but the resistance line will be hit soon and upper BB band proximity will signal an overbought condition so we will go for a counter-trend short trade with the target being at 0.528.
Disclosure: I am part of Trade Nation's Influencer program and receive a monthly fee for using their TradingView charts in my analysis.
✅LIKE AND COMMENT MY IDEAS✅
Techincalanalysis

USOIL BULLISH BIAS RIGHT NOW| LONG
USOIL SIGNAL
Trade Direction: long
Entry Level: 57.53
Target Level: 59.96
Stop Loss: 55.93
RISK PROFILE
Risk level: medium
Suggested risk: 1%
Timeframe: 1D
Disclosure: I am part of Trade Nation's Influencer program and receive a monthly fee for using their TradingView charts in my analysis.
✅LIKE AND COMMENT MY IDEAS✅

NZD/USD BEST PLACE TO SELL FROM|SHORT
Hello, Friends!
Previous week’s green candle means that for us the NZD/USD pair is in the uptrend. And the current movement leg was also up but the resistance line will be hit soon and upper BB band proximity will signal an overbought condition so we will go for a counter-trend short trade with the target being at 0.574.
Disclosure: I am part of Trade Nation's Influencer program and receive a monthly fee for using their TradingView charts in my analysis.
✅LIKE AND COMMENT MY IDEAS✅

GBP/USD BEARS ARE STRONG HERE|SHORT
Hello, Friends!
GBP-USD uptrend evident from the last 1W green candle makes short trades more risky, but the current set-up targeting 1.327 area still presents a good opportunity for us to sell the pair because the resistance line is nearby and the BB upper band is close which indicates the overbought state of the GBP/USD pair.
Disclosure: I am part of Trade Nation's Influencer program and receive a monthly fee for using their TradingView charts in my analysis.
✅LIKE AND COMMENT MY IDEAS✅

Is BTC Ready for a Major Breakout? Watch These Levels!BTC/USD 1-Hour Market Analysis
1. Current Price Structure
BTC has been trading within a range, bouncing between the resistance zone around 94,000 and the support zone near 89,300.
The chart shows clear retracements with higher lows forming within the support range, signaling potential for upward movement.
2. Liquidity Zones
The resistance zone (94,000) continues to act as a solid barrier. A breakout above this level could pave the way for price to surge higher towards the target levels.
On the downside, support zones (89,300) have been effectively holding, providing a floor for the price action.
3. Potential Scenarios
Bullish Scenario: If BTC breaks the resistance level (94,000), we can expect an impulsive rally targeting 94,500 and then reaching 95,000+.
Bearish Scenario: If BTC fails to hold above 89,300, it might retest the support zone, opening the door for a decline towards 87,000.
4. Market Sentiment
The market seems to be in a consolidation phase with liquidity accumulation at key support and resistance levels.
Investors should be cautious of false breakouts in this range as the market is in a waiting mode before key data releases (i.e., NFP, ADP) that could dictate the next major move.
5. Trading Strategy
Buy near Support at 89,300 with a target around 94,000.
Sell near Resistance at 94,000 if price fails to break through, targeting 92,000-91,500.
Be sure to monitor the liquidity closely as this could indicate a potential breakout or breakdown.

AUD/CHF LONG FROM SUPPORT
Hello, Friends!
AUD/CHF pair is in the uptrend because previous week’s candle is green, while the price is evidently falling on the 4H timeframe. And after the retest of the support line below I believe we will see a move up towards the target above at 0.536 because the pair is oversold due to its proximity to the lower BB band and a bullish correction is likely.
Disclosure: I am part of Trade Nation's Influencer program and receive a monthly fee for using their TradingView charts in my analysis.
✅LIKE AND COMMENT MY IDEAS✅

GOLD BEARS WILL DOMINATE THE MARKET|SHORT
GOLD SIGNAL
Trade Direction: short
Entry Level: 4,338.48
Target Level: 4,270.79
Stop Loss: 4,383.65
RISK PROFILE
Risk level: medium
Suggested risk: 1%
Timeframe: 1h
Disclosure: I am part of Trade Nation's Influencer program and receive a monthly fee for using their TradingView charts in my analysis.
✅LIKE AND COMMENT MY IDEAS✅

GBP/CAD BULLS ARE GAINING STRENGTH|LONG
GBP/CAD SIGNAL
Trade Direction: long
Entry Level: 1.840
Target Level: 1.844
Stop Loss: 1.838
RISK PROFILE
Risk level: medium
Suggested risk: 1%
Timeframe: 1h
Disclosure: I am part of Trade Nation's Influencer program and receive a monthly fee for using their TradingView charts in my analysis.
✅LIKE AND COMMENT MY IDEAS✅

Waiting for Premium Pullback Buy the Bullish Continuation1. Market Context & Structure (H1)
• After a prolonged consolidation phase, Gold has delivered a clear bullish BOS, breaking above the previous highs around 4,24x–4,25x.
• The current impulse originated from the EQL → OB 4,209 zone, confirming active buying flow and a shift into a short-term uptrend.
• Price is now trading above the Premium Zone at 4,265; any pullback into this area is considered a technical retracement within the bullish trend.
2. Key Technical Zones
• Main OB – Demand: around 4,209 → Origin of the current bullish leg; a strong BUY zone if price holds.
• Premium Pullback Buy Zone: 4,265 – 4,270 → First discount after BOS; priority area to look for BUY setups.
• Target 1 – Reaction Zone: 4,322 – 4,323 → Fibo 0.5–0.618 confluence; potential profit-taking / short-term sell reaction.
• Target 2 – Extension Zone: 4,366 – 4,367 (Fibo 1.272) → Bullish extension target and potential liquidity sweep zone.
3. Trading Scenarios
Main Scenario – Trend BUY at Premium Zone
• Wait for pullback to 4,265 – 4,270.
• Look for confirmation: long lower wicks, bullish engulfing, or bullish ChoCH on M15–H1.
• Execute BUY with trend continuation.
TP1: 4,322
TP2: 4,366
• Partial TP at TP1, move SL to BE, hold remainder to TP2.
• Invalidation: H1 close below 4,258 → pause BUY scenario.
Scenario 2 – Deep BUY at OB 4,209
• If price breaks Premium decisively and drops to OB 4,209, do not catch a falling knife.
• Wait for strong bullish reaction and reversal structure (new HL, bullish ChoCH).
TP: 4,265 → 4,322
4. Risk Management Notes
• Avoid FOMO BUY at highs after strong bullish candles.
• SELL setups are only short-term reactions, not the main bias.
• Bias remains BUY on dips as long as H1 holds above 4,209.

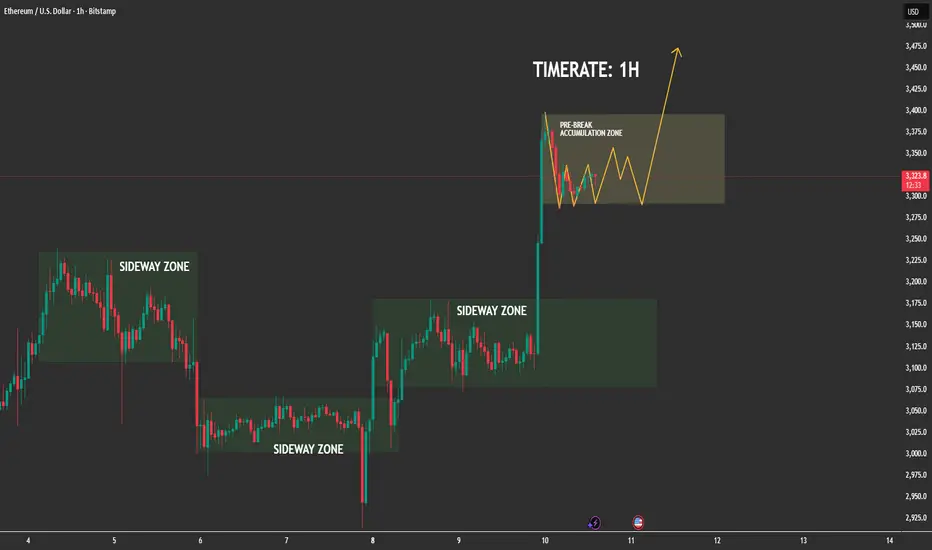
Ethereum Has Entered Its Pre-Expansion Accumulation📊 (1) MARKET STRUCTURE — CLEAN SIDEWAY → BREAKOUT → RE-ACCUMULATION
The chart shows a repeating pattern:
✔ Phase 1: Sideway Zone
ETH repeatedly compresses in sideways zones, forming liquidity pools and equal highs/lows.
✔ Phase 2: Breakout With Strong Momentum
Each sideways block ends with a powerful impulsive candle clear evidence of aggressive buy-side imbalance.
✔ Phase 3: Post-Break Re-Accumulation (CURRENT PHASE)
Price is now inside the highlighted pre-break accumulation zone,
moving in a tight, controlled structure a textbook bullish continuation setup.
This is the phase where institutional traders rebalance orders before the next run.
📍 (2) PRICE BEHAVIOR — BULLS IN FULL CONTROL
-No sharp rejections after the breakout
-Dips are shallow and quickly absorbed
-Market is forming higher low micro-structures
-Momentum clearly stays in the hands of buyers
This confirms the market is not distributing, but absorbing liquidity and building a base.
🌐 (3) MACRO FACTORS SUPPORTING ETH UPSIDE
✔ ETH ETF Approval Momentum (US + Asia)
Regulatory mood continues shifting positively, with multiple jurisdictions preparing Ethereum ETF products. Institutional demand keeps increasing quietly in the background.
✔ Falling US Inflation & Dovish Fed Expectations
Recent CPI and PPI reports show cooling inflation. The market widely expects 2025–2026 rate cuts, which historically push liquidity into risk assets ETH benefits directly.
✔ Ethereum Supply Shock
-Over 27% of ETH is staked
-Net supply remains deflationary under high network activity
-Reduced exchange reserves signal accumulation
This creates a tightening supply environment that amplifies price expansion.
✔ Altcoin Rotation Phase
BTC dominance stabilizing → capital increasingly flows into ETH and large-cap alts.
Macro + on-chain + liquidity flows all align with a bullish continuation.
⏳ (4) HTF CONTEXT — BULL CYCLE CONFIRMED
Higher timeframes show:
-ETH broke out of a weekly compression range
-Structure is fully bullish
-Market currently resetting before next leg
-No bearish reversal signals anywhere in sight
This supports the thesis that the current 1H accumulation is not random, it is part of a much larger bullish leg forming.
🚀 (5) EXPECTATION — HIGH PROBABILITY SCENARIO
ETH is expected to:
-Continue oscillating inside the pre-break accumulation zone
-Form a series of small higher lows as drawn
-Absorb liquidity from both sides
-Break out toward 3,400 → 3,450+
The path of least resistance remains upward.
🎯 (6) TRADING INSIGHT (Non-Signal)
Markets only explode after liquidity is collected.
ETH is doing exactly that holding strong after a breakout and compressing before expansion.
This is the signature behaviour of a healthy bullish trend.
XAUUSD H1 Volume Profile and Key Price AreasXAUUSD H1 – Volume Profile and Key Price Areas
Gold remains in a strong uptrend, with the primary strategy focused on buying pullbacks
PRIORITY SCENARIO – MAIN STRATEGY
Buy-the-dip approach aligned with the dominant trend using Volume Profile levels
Expected buy zone: around 4253 based on VAH
Short-term range to monitor: 4263 – 4285
Price expectation: rebound from VAH toward the upper range before further expansion
Position management:
If price holds above the 4263 area and shows clear bullish reaction, maintaining long exposure remains favorable.
If price is strongly rejected near 4285, risk should be reduced as this zone represents an important short-term resistance.
ALTERNATIVE SCENARIO – SECONDARY SETUP
Short-term countertrend opportunity at an extended resistance level
Sell zone for the alternative scenario: around 4310 at the Fibonacci extension
This setup is only considered if clear rejection signals appear at the level
KEY REASONS
The bullish structure on the H1 timeframe remains intact
Volume Profile highlights the VAH near 4253 as a high-probability reaction zone
The 4310 area represents an extended resistance suitable for profit-taking or short-term pullback reactions
MACRO CONTEXT
The Federal Reserve continues its rate-cutting cycle and maintains a dovish stance, putting pressure on the US dollar and supporting gold prices.
Geopolitical tensions and concerns about US economic slowdown further reinforce safe-haven demand.
Markets are now focused on the upcoming Nonfarm Payrolls report, where weaker data could drive further upside, while stronger data may trigger a short-term correction.
RISK MANAGEMENT AND MONITORING
Avoid chasing price while gold trades within the 4263 – 4285 range.
The bullish scenario becomes invalid if price breaks clearly below the support area beneath the VAH.
Expect increased volatility around major economic data releases and manage exposure accordingly.

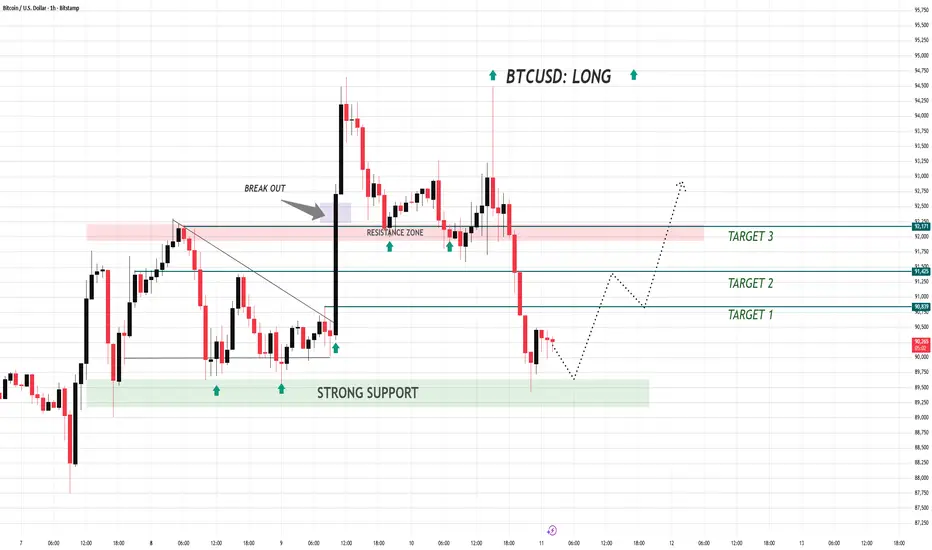
Bitcoin Stabilizes as Traders Await Fed’s Rate Path Signal🔹 MARKET BRIEFING – BTC/USD (1H)
Market State:
– Price is reacting strongly from the major support zone and forming a short-term base after the sharp selloff, showing early signs of buyer absorption.
Key Levels:
– Support: 89,600
– Resistance: 91,450
– Breakout Zone: 92,100 – 92,300
Next Move:
– Bullish bias holds as long as price stays above support; reclaiming 91,450 would open the path toward 92,300.
XAUUSD – Post FOMC | ChumTrades Daily PlanXAUUSD – Post FOMC | ChumTrades Daily Plan
Market Context
• Strong rejection at 4245 → buyer momentum weakening.
• Prefer selling at premium zones, buying at lower demand zones.
• Expect gold to continue ranging within 4245 ⇆ 4180.
🔻 SELL Zones
1) Main SELL Zone: 4238–4245
Entry: 4238–4245
SL: 4255
TP1: 4225
TP2: 4204
TP3: 4180
2) SELL SCALP: 4230–4233
TP: 4218–4210
SL: 4237
🟢 BUY Zones
1) BUY SCALP: 4188–4190–4192
TP: 4210 → 4218 → 4230 → 4240
SL: 4278
2) Main BUY Zone: 4163
SL: 100 pips
TP: 100 / 200 / 300 pips
RR: 1 : 3
🎯 Bias
• Below 4245 → market favors sideway–down movement.
• Only a breakout above 4265 signals a potential bullish shift.
If you find this plan helpful, please leave a like and follow ChumTrades for daily plans & realtime updates!
Feel free to drop your own market view in the comments so we can discuss together.

GBP/JPY SELLERS WILL DOMINATE THE MARKET|SHORT
Hello, Friends!
We are going short on the GBP/JPY with the target of 206.517 level, because the pair is overbought and will soon hit the resistance line above. We deduced the overbought condition from the price being near to the upper BB band. However, we should use low risk here because the 1W TF is green and gives us a counter-signal.
Disclosure: I am part of Trade Nation's Influencer program and receive a monthly fee for using their TradingView charts in my analysis.
✅LIKE AND COMMENT MY IDEAS✅

NZD/USD BEARS ARE GAINING STRENGTH|SHORT
NZD/USD SIGNAL
Trade Direction: short
Entry Level: 0.578
Target Level: 0.576
Stop Loss: 0.579
RISK PROFILE
Risk level: medium
Suggested risk: 1%
Timeframe: 1h
Disclosure: I am part of Trade Nation's Influencer program and receive a monthly fee for using their TradingView charts in my analysis.
✅LIKE AND COMMENT MY IDEAS✅

EUR/CAD BEST PLACE TO SELL FROM|SHORT
Hello, Friends!
EUR/CAD is making a bullish rebound on the 4H TF and is nearing the resistance line above while we are generally bearish biased on the pair due to our previous 1W candle analysis, thus making a trend-following short a good option for us with the target being the 1.604 level.
Disclosure: I am part of Trade Nation's Influencer program and receive a monthly fee for using their TradingView charts in my analysis.
✅LIKE AND COMMENT MY IDEAS✅

EUR/JPY BEARS ARE STRONG HERE|SHORT
EUR/JPY SIGNAL
Trade Direction: short
Entry Level: 182.313
Target Level: 181.931
Stop Loss: 182.565
RISK PROFILE
Risk level: medium
Suggested risk: 1%
Timeframe: 1h
Disclosure: I am part of Trade Nation's Influencer program and receive a monthly fee for using their TradingView charts in my analysis.
✅LIKE AND COMMENT MY IDEAS✅

GOLD (XAU/USD): Day Trading Setup for Today📈GOLD is currently consolidating within a horizontal intraday range.
Following a test of the channel's support, the price may continue to ascend towards its resistance.
As a confirmation, I observe a head and shoulders pattern formation.
Target - 4255

XAU/USD – H1 Trading Plan: Buy at OB 4,19x – 4,18x, Targets 4,241. Market Structure (H1)
Gold is retracing back into bullish structure after breaking a series of bullish ChoCH and BoS, forming a new high around 4,24x. The current decline is only a technical pullback because:
• Price is returning to the Buy Order Block at 4,188 – 4,196.
• This zone aligns with trendline support and the demand base that fueled the previous impulse.
• The macro structure remains bullish as long as H1 does not close below 4,188.
→ This is a clear pullback–continuation setup: wait for price to retrace into discount, then target higher zones.
2. Key Levels
🔹 Demand Zone (Buy Zone): 4,188 – 4,196
• Bullish OB
• Trendline support
• Priority BUY area
🔹 Resistance 1: 4,217 – 4,218
• Multiple rejections
• Breakout → next bullish leg
🔹 Resistance 2: 4,238 – 4,239
• 0.5–0.618 Fibo confluence
• Possible mild sell reaction
🔹 Liquidity & Targets:
• 4,259 → Fibo 1.272
• 4,278 → Fibo 1.618 + resting liquidity
3. Trading Plan
🔸 Main Scenario – BUY at OB 4,19x – 4,18x
Conditions:
• Price taps 4,188 – 4,196
• Reversal signals: pin bar, engulfing, or bullish ChoCH
Targets:
TP1: 4,217
TP2: 4,238
TP3: 4,259
TP4: 4,278
Invalidation:
• H1 close below 4,185 → stay out.
🔸 Alternate Scenario – Price goes up without retesting OB
If price holds above 4,210 and breaks 4,217:
• Wait for retest of 4,217
• BUY continuation toward 4,238 → 4,259 → 4,278
Market Outlook
Gold is accumulating and building a base for a stronger breakout. The OB Buy zone 4,19x – 4,18x remains the highest-probability reversal area.

XAUUSD SELLSBreak of structure. 1H OB and 15M OB in the same price area. Let’s see how this goes. Looks solid. This is not financial advice.

XAU/USD: Buy at OB 4.18x–4.17x; Sell on reaction.✍️ Captain Vincent – SMC Flow Analysis
📊 Market Structure (H1)
Gold continues to accumulate within the range of 4,200–4,220 after failing to break the recent peak. The structure shows:
• Multiple ChoCH – BoS declines → selling pressure still leads in the short term.
• However, the OB Buy 4,184–4,170 zone remains a crucial structural bottom, where buyers react strongly once swept.
• Above, the market leaves a Liquidity Sell area at 4,261, a natural target if gold gathers enough liquidity below.
→ The current phase is liquidity gathering before making a big move.
💎 Key Levels – Price Zones to Watch
🔸 Resistance / Sell Zone
• 4,218 → intraday resistance, price reacts multiple times.
• 4,243–4,244 → confluence of sideways peak + old BoS.
• Liquidity Sell: 4,261 → extended target if price breaks strongly upwards.
🔸 Support / Buy Zone
• 4,200–4,201 → short-term price balance zone.
• OB Buy 4,184–4,170 → strong demand, where the previous trend initiated.
• If breaking 4,170 → price may sweep deeper but remains in the ideal discount zone for BUY hunting.
🎯 Trading Plan – Clear and Easy to Follow
1️⃣ Main Scenario – Prioritize BUY at OB 4,184–4,170
Expect the market to create a sweep below 4,200, touching OB Buy to gather liquidity before bouncing up.
BUY Conditions:
• Price touches 4,184–4,170
• Reversal signals appear on M15–H1: pin bar, engulfing, rising ChoCH
• Decline slows down or buying force becomes clear
Targets:
• TP1: 4,190
• TP2: 4,200
• TP3: 4,215
• TP4 extended: 4,261 (Liquidity Sell)
Invalidation: H1 closes below 4,165 → stay out and reassess the structure.
2️⃣ Secondary Scenario – Short SELL when price retests 4.24x
If the price does not drop immediately but pulls up:
SELL Conditions:
• Retest 4,243–4,244
• Strong reaction appears: rejection wick, declining ChoCH
• Must not close H1 above 4,250
Targets:
• TP1: 4,235
• TP2: 4,225
• TP3: OB Buy 4,184–4,170
Invalidation: H1 closes above 4,250 → stop SELL, shift bias to observe breakout.
3️⃣ Extended Scenario – Sweep peak 4,261
Only activate when:
• Price bounces strongly from OB Buy
• Clear breakout of 4,243 zone
• Structure forms HL → HH
At that point, gold will tend to run straight up to sweep liquidity at 4,261 before the market chooses a new direction.
⚠️ Risk Management Notes
• Do not BUY when price is still within the resistance zone 4,218–4,243.
• SELL is only a short-term strategy, do not go against the major trend if a breakout occurs.
• OB Buy 4,184–4,170 is the zone with the highest probability of triggering an upward wave.

XAUUSD – Brian | After the rate cutXAUUSD – Brian | After the rate cut, Volume Profile still favours further downside
1. Market snapshot
After the rate cut, gold saw a bounce but failed to sustain the upside and is still hovering below last week’s highs.
In the Asian session, price only ticked up slightly before being sold off again – a sign that buying pressure is not particularly strong at these levels.
Risk-on sentiment has returned and the USD is seeing a modest recovery, which is weighing on XAU/USD.
That said, expectations for the Fed to maintain a dovish tone could still cap USD strength in the medium term.
Overall, in the short term Brian still leans towards a downside move, preferring to sell into liquidity above rather than chase buys.
2. Volume Profile view – Key levels to watch
On the H1 chart, Volume Profile highlights three main areas:
VAL – Buy scalping zone: around 4,207
→ Current lower value area, where a short technical bounce may appear.
Liquidity / Sell zone: around 4,222
→ Liquidity pocket above, lining up with VAH and a volume cluster – an attractive area to look for sells if price is pushed back up for a retest.
Deeper buy zone: around 4,166
→ Broader demand area below; if price flushes lower after sweeping liquidity, this is where dip-buying interest may show up.
3. Trade scenarios (for reference)
Scenario 1 – Sell at the 4,222 liquidity zone (primary idea)
Idea: Wait for price to retrace into the 4,222 liquidity zone and then look for rejection signals on H1/M15.
Sell zone: 4,220–4,223
Suggested SL: Above 4,230
Targets:
TP1: 4,207 (VAL)
TP2: 4,190–4,185
TP3: 4,170–4,166 (deeper buy zone)
This setup follows the current bearish bias, using the logic of “sell the rally into high-volume + liquidity zones”.
Scenario 2 – Light buys at VAL 4,207 & buy zone 4,166
Scalp buy at VAL:
Entry zone: 4,204–4,207
Target: bounce back towards 4,217–4,220 and then exit, not a long hold.
Buy at the deeper 4,166 zone (cleaner level):
Entry zone: 4,164–4,168
SL: Below 4,158
TP: 4,190 → 4,210 if a clear bullish candle reaction forms and the Fed does not turn overly hawkish.
Both buy scenarios are purely short-term corrective plays, so position size should be kept modest as the main bias remains to the downside.
Be patient and only start thinking about sells once price tags the 4,222 area – avoid forcing entries when price is stuck in the middle of the range.
In summary: Selling around 4,222 is the primary plan, while buys at 4,207 and 4,166 are secondary strategies that only come into play if there is a clear reaction from Volume Profile and price action.

SPS Commerce | SPSC | Long at $77.51SPS Commerce NASDAQ:SPSC is a leading cloud-based supply chain management software provider, specializing in electronic data interchange (EDI), fulfillment, and e-commerce integration solutions. Key customers include major retailers like Walmart NYSE:WMT , Target NYSE:TGT , Home Depot NYSE:HD ; Procter & Gamble NYSE:PG , Nestlé OTC:NSRGY ; Sysco NYSE:SYY , and US Foods NYSE:USFD . As of 2025, SPS Commerce serves over 12,000 customers and connects to more than 100,000 trading partners globally.
Technical Analysis
The price fell through my "crash" simple moving average zone (green lines). This area is often an algorithmic share accumulation zone. The price spiked into the "crash" zone as the day went by after the earnings release. While this is still a high growth stock, there is still risk with the slowing economy, P/E ratio of 36x, and two open price gaps on the daily chart near $58 and $38. These price gaps will likely get filled if the US enters a recession, but are we really there yet? Depending on where you look (retail vs tech), there answer varies. But my bets are no - publicly. There is usually a Christmas rally every year, and NASDAQ:SPSC is in "oversold" territory in the near term. The price may dead cat bounce to $53, but I suspect it would take major negative economic news or a breakdown in company fundamentals to get there.
Financial Health
Debt-to-equity: 0x (healthy)
Quick ratio / ability to pay current bills: 1.5 (healthy / able to pay)
Altman's Z Score / bankruptcy risk: 19 (extremely low risk)
Earnings and Revenue Growth
Earnings per share growth from 2024 ($3.48) to 2028 ($6.52): 87.4%
Revenue growth from 2024 ($638 million) to 2028 ($1.03 billion): 61.4%
www.tradingview.com
Action
Given the overall health of the company, potential for a Christmas rally, and technical analysis "crash" entry, NASDAQ:SPSC is in a personal buy zone at $77.51.
Targets into 2028
$90.00 (+16.1%)
$100.00 (+29.0%)
