AUD/CAD LONG FROM SUPPORT
Hello, Friends!
Bullish trend on AUD/CAD, defined by the green colour of the last week candle combined with the fact the pair is oversold based on the BB lower band proximity, makes me expect a bullish rebound from the support line below and a retest of the local target above at 0.921.
Disclosure: I am part of Trade Nation's Influencer program and receive a monthly fee for using their TradingView charts in my analysis.
✅LIKE AND COMMENT MY IDEAS✅
Techincalanalysis

GBP/CAD BEST PLACE TO SELL FROM|SHORT
GBP/CAD SIGNAL
Trade Direction: short
Entry Level: 1.864
Target Level: 1.855
Stop Loss: 1.871
RISK PROFILE
Risk level: medium
Suggested risk: 1%
Timeframe: 1h
Disclosure: I am part of Trade Nation's Influencer program and receive a monthly fee for using their TradingView charts in my analysis.
✅LIKE AND COMMENT MY IDEAS✅

BITCOIN BEARISH BIAS RIGHT NOW| SHORT
Hello, Friends!
BITCOIN pair is trading in a local downtrend which know by looking at the previous 1W candle which is red. On the 4H timeframe the pair is going up. The pair is overbought because the price is close to the upper band of the BB indicator. So we are looking to sell the pair with the upper BB line acting as resistance. The next target is 89,196.10 area.
Disclosure: I am part of Trade Nation's Influencer program and receive a monthly fee for using their TradingView charts in my analysis.
✅LIKE AND COMMENT MY IDEAS✅

CHF/JPY BUYERS WILL DOMINATE THE MARKET|LONG
CHF/JPY SIGNAL
Trade Direction: long
Entry Level: 192.579
Target Level: 193.023
Stop Loss: 192.284
RISK PROFILE
Risk level: medium
Suggested risk: 1%
Timeframe: 1h
Disclosure: I am part of Trade Nation's Influencer program and receive a monthly fee for using their TradingView charts in my analysis.
✅LIKE AND COMMENT MY IDEAS✅

CAD/JPY BULLS ARE GAINING STRENGTH|LONG
Hello,Friends!
CAD/JPY pair is in the uptrend because previous week’s candle is green, while the price is obviously falling on the 4H timeframe. And after the retest of the support line below I believe we will see a move up towards the target above at 111.532 because the pair is oversold due to its proximity to the lower BB band and a bullish correction is likely.
Disclosure: I am part of Trade Nation's Influencer program and receive a monthly fee for using their TradingView charts in my analysis.
✅LIKE AND COMMENT MY IDEAS✅

EUR/USD BEARS WILL DOMINATE THE MARKET|SHORT
Hello, Friends!
EUR/USD is trending down which is evident from the red colour of the previous weekly candle. However, the price has locally surged into the overbought territory. Which can be told from its proximity to the BB upper band. Which presents a beautiful trend following opportunity for a short trade from the resistance line above towards the demand level of 1.158.
Disclosure: I am part of Trade Nation's Influencer program and receive a monthly fee for using their TradingView charts in my analysis.
✅LIKE AND COMMENT MY IDEAS✅

GOLD SENDS CLEAR BEARISH SIGNALS|SHORT
GOLD SIGNAL
Trade Direction: short
Entry Level: 4,223.82
Target Level: 4,205.21
Stop Loss: 4,236.08
RISK PROFILE
Risk level: medium
Suggested risk: 1%
Timeframe: 9h
Disclosure: I am part of Trade Nation's Influencer program and receive a monthly fee for using their TradingView charts in my analysis.
✅LIKE AND COMMENT MY IDEAS✅

XAU/USD: Gold Consolidates, Awaiting Pullback for Breakout📊 Market Structure (H1)
Gold is moving within a converging triangle pattern – with the bottom being pushed higher by buying pressure, while the top is continuously blocked by the H1 descending trendline.
After the previous strong decline, the market has consecutively created bullish ChoCH , indicating that capital flow is starting to return, but the pivotal supply remains at the OB Bearish 4.23x area – where the price is currently stuck.
Currently, the price is testing the upper edge of the triangle + supply area, which is primarily used for distribution and liquidity sweep. → Not an optimal area for FOMO BUY.
💎 Key Levels – Important Areas
• OB Bearish – 4.23x: confluence with descending trendline → high probability area for strong reaction or Liquidity Sweep.
• FVG – 4.21x: H1 price gap, the market tends to return to fill before continuing.
• OB Bullish – Buy Zone – 4.201: H1 demand + lower edge of current range → priority area to observe BUY according to trend.
• Liquidity Buy – 4.170: lower liquidity area → price may sweep deep before bouncing strongly if the medium-term uptrend remains effective.
• Upper Target – 4.25x: expanded target if gold successfully breaks the converging triangle.
🎯 Trading Plan – Trading Scenarios
1️⃣ Priority Scenario: Pullback to OB Bullish
If the OB Bearish 4.23x area reacts (wick rejection, reversal pattern, weakening momentum), expect the price to retreat to:
→ FVG 4.21x
→ OB Bullish 4.201
At the 4.20x area, if a bullish ChoCH / engulfing / strong pin bar appears, this will be a reasonable BUY area according to the trend.
Suggested TP:
• TP1: FVG 4.21x
• TP2: Retest OB Bearish 4.23x
• TP3 expanded: 4.25x area if price breaks the triangle
Invalidation: H1 closes below 4.195 → stay out and wait for reaction at Liquidity 4.170.
2️⃣ Alternative Scenario: Deep Sweep to Liquidity Buy
If OB Bullish 4.20x does not hold and the price breaks down strongly, do not catch the falling knife.
→ Wait for gold to reach Liquidity Buy 4.170
→ Observe reaction: long wick, selling pressure depletes, new HL formation…
Only BUY again when the signal is clear.
If the 4.170 area is broken strongly by an H1 candle → temporary uptrend structure loses effectiveness, reduce volume or stay out until the market stabilizes.
⚠️ Risk Management
This is a trading plan based on an idea – not an immediate entry signal.
Do not BUY directly at the 4.23x resistance area.
Be patient for a pullback to the discount area (4.20x – 4.17x) and always set clear risk.
“Liquidity tells the truth — structure confirms the path.” ⚜️
⏰ Timeframe: H1
✍️ Analysis by: Captain Vincent

XAUUSD – Brian | Volume Profile & TrendlineXAUUSD – Brian | Volume Profile & Trendline: prioritize Sell, wait for a “good deal” in the liquidity zone
1. Market snapshot
On H1, gold is touching the trendline just as yesterday's scenario – this is an area where strong price reactions may occur.
The current structure shows that the price is gradually distributing below the trendline, with no clear signal that buyers have regained control.
In the short term, Brian prioritizes the Sell scenario, utilizing the POC – VAH – FVG areas of the Volume Profile to find entry points.
2. Volume Profile – Key price areas to note
Short-term POC/VAH area around 3,488–3,492 (according to his chart):
This is an area where dense trading occurred, the profile “bulges” out, indicating strong market interest.
When the price returns to this area, a reaction is expected – suitable for entering orders in the current priority direction.
Sell-side liquidity below: If gold cannot hold the POC/VAH area and is pushed down, the liquidity area below will become a reasonable target for the next downward move.
Gold is likely to fluctuate sideways on Friday to close the weekly candle below the trendline, then consider a clearer break at the start of next week.
3. Trading scenario for next week
Scenario 1 – Prioritize Sell at the Volume Profile area
Main mindset: When the price returns to the POC/VAH areas above, prioritize finding short signals instead of chasing buys.
Watch for clear candle reactions (long upper tail, pin bar, engulfing…) at the thick profile area.
Target: Gradually close towards lower liquidity areas (sell-side liquidity) below.
Depending on price behavior, the target can be expanded if selling pressure intensifies at the start of the week.
Scenario 2 – Break trendline & buy the retracement
If gold decisively breaks the downtrend line, closes above, and maintains the new structure:
Then, the strategy will shift to buying the retracement at the trendline itself (now acting as support).
The POC/VAL area below will then become a reasonable “buy zone” to follow the new upward trend.
In summary: before a clear break occurs, Brian still prioritizes selling at high liquidity areas, rather than rushing to catch the bottom.
4. Fundamental context – Large capital still supports gold
Central banks are increasing gold purchases:
In October, global central banks net purchased +53 tons of gold, the highest level since 11/2022.
This figure increased by +194% compared to July, marking the third consecutive month of increased purchasing speed.
This indicates: Short-term selling pressure may appear around the trendline/resistance, but long-term capital flow still favors gold.
Any deep declines later may still attract buying power from large institutions.
5. Risk management suggestions
Maintain the mindset: Sell is the current priority scenario, not the only option – if the structure changes, be ready to switch to buy.
Do not overlook the nearest liquidity/swing low area to place SL – avoid dragging SL too far due to emotions.

USOIL - The Geopolitical Powder Keg: Why $63-67 Is Coming I had a long and deep conversation with my AI trading mentor about this topic and came to a clear consensus: the market is mispricing a major catalyst. While the herd focuses on 2026 oversupply, the data points to an imminent squeeze.
📈 Executive Summary - TL;DR
Current Price: $59.49-59.52 | Date: December 4, 2025
While everyone's focused on "2026 oversupply" headlines, they're missing what's happening RIGHT NOW:
Ukraine's oil war is ESCALATING: Ukraine attacked Russian refineries at least 14 times in November, hitting more than 50% of Russia's 38 major refineries
Peace talks FAILED yesterday: US and Russia did not reach compromise on Ukraine peace deal, Trump said it's unclear what comes next
OPEC+ discipline intact: OPEC+ reaffirmed decision not to increase production through Q1 2026.
Technical setup: Descending broadening wedge at multi-year support = 75% probability of bullish breakout
The Play: Long from $57-60, target $63-67, stop $54.50.
Let me show you the data everyone's ignoring.
📊 Market Context - The War Nobody's Pricing In
Oil is trading at $59.51 on December 4, 2025, up 0.15% from previous day. Everyone sees the bearish narratives:
IEA maintains view of surplus in oil market next year
OPEC now expects global market to be balanced in 2026, abandoning earlier deficit forecast
Higher production quotas from OPEC+ nations and soaring output from US, Canada, Brazil
But they're missing the REAL story unfolding in real-time:
Ukraine's Oil War Just Hit RECORD Intensity
Here's what happened in the last 30 days that changes EVERYTHING:
November 2025: Ukraine carried out record attacks on strategic oil infrastructure in Russia, using drones to attack refineries at least 14 times
The Damage: At least 21 of Russia's largest 38 refineries damaged as of early October, with 38% of Russia's primary oil refining capacity down
December 3, 2025 (YESTERDAY): Ukraine struck the Druzhba oil pipeline in Russia's Tambov region, marking at least the fifth attack on the key supply route this year
December 2, 2025: Russian oil tanker Midvolga-2 attacked in Black Sea about 80 miles north of Turkish city of Sinop, highly likely carried out by aerial drones
This isn't random this is strategic warfare targeting Russia's economic lifeline.
Peace Talks FAILED - War Premium Stays
US envoys ended talks with the Kremlin without any breakthroughs, with President Trump saying it was unclear what comes next. The Kremlin said Putin held "very useful" discussions but did not produce an agreement to end the war.
Translation? The war premium that everyone thought was disappearing... isn't going anywhere.
Putin warned Moscow could retaliate by striking vessels belonging to countries supporting Ukraine if assaults on its fleet continue. This is ESCALATION, not de-escalation.
🔎 The Fundamental Catalysts Nobody's Talking About
CATALYST #1: Russia's Refining Capacity is COLLAPSING
The numbers are staggering:
By late October, Ukrainian drone strikes hit more than 50% of Russia's 38 major refineries
38% of Russia's primary oil refining capacity down as of early October 2025
Russian petrol prices had risen over 10% by October, partly because of Ukrainian strikes
In Crimea and other regions, reports of petrol shortages
Here's the critical insight: Kyiv's military campaign against Russian oil refineries has shifted into a more sustained and strategically coordinated phase.
This isn't stopping. It's accelerating.
In the first few months of 2025, at least 13 Russian refineries were hit. The pace has since grown to a blitz.
Game Theory: Russia needs oil revenue to fund the war. Ukraine is systematically destroying Russia's ability to refine oil. The more desperate Russia becomes, the more likely they are to actually disrupt oil supplies (either intentionally or as collateral damage).
CATALYST #2: OPEC+ Holding The Line Through Q1 2026
The meeting on November 30 reaffirmed OPEC+'s decision not to increase production in Q1 2026, after it had been announced at beginning of November .
The group still has production cuts of around 3.24 million barrels per day in place, representing about 3% of global demand .
Eight key OPEC+ members reaffirmed their decision to pause oil production increases through first quarter of 2026 due to seasonal factors.
Here's what matters: OPEC+ was SUPPOSED to start increasing production. They're NOT. Why? Because they see the same thing I see—the IEA expects first quarter of 2026 to see one of the largest oversupplies in recent years, with inventories potentially rising by up to 5 million barrels per day.
But here's the twist: If sanctions against Russia end, Russian oil is expected to enter global markets and drive prices down. However, continued war would support prices.
OPEC is betting the war continues. So am I.
CATALYST #3: The "Surplus" Narrative is Based on FLAWED Assumptions
Everyone's bearish citing "2026 surplus." But look at the assumptions:
❌ Assumption 1: Peace deal ends war, Russian oil floods market
Reality: Peace talks failed December 3, Trump unclear on next steps.
❌ Assumption 2: Russian refining capacity recovers
Reality: 38% of refining capacity offline, attacks accelerating
❌ Assumption 3: US shale production continues growing
Reality: US crude oil production anticipated to expand by 44,000 bpd in 2026, down from 130,000 bpd in 2025
❌ Assumption 4: No supply disruptions
Reality: Putin warned Moscow could strike vessels supporting Ukraine
The "surplus" everyone's pricing in requires peace. But Trump said it's unclear what happens next after talks failed.
No peace = No surplus.
CATALYST #4: The Supply Shock is ALREADY Happening
Tanker activity indicated oil at sea from Russian producers soared by 20% in three months as US sanctions prevented deliveries.
Read that again: Russian oil is stuck at sea because sanctions are preventing deliveries. That's not "oversupply"—that's BOTTLENECKED supply.
Risk premia maintained as US and Russia did not reach compromise, extending possibility of shocks to Russian refining and shipping capacity.
Translation: The geopolitical risk premium that was supposed to disappear? It's getting BIGGER.
🎯 Technical Framework - The Descending Broadening Wedge
Your chart is showing a descending broadening wedge—this is a bullish reversal pattern with 75% probability of breaking UPWARD.
Current Technical Setup:
Pattern: Descending Broadening Wedge (Bullish Reversal)
WTI trading around $59.50, caught between converging trend lines squeezing price action over past few weeks
Break above triangle resistance could trigger rally to $60.50-61.00 area or higher
Support Levels:
$58.00-59.50: Current FVG + wedge support
$55.50-57.50: Horizontal support around $55.99 tested multiple times, suggesting buyers active at lower levelsC
$54.00: Absolute floor—break below = thesis DEAD
Resistance Levels:
$61.50-$63.50: Falling resistance line capped rallies throughout period
$65.00-$67.00: If we break wedge with volume, this is next target
$72.00+: Extended target if supply shock materializes
Why This Setup Works:
Multiple Support Tests: Price bounced off triangle bottom multiple times over recent months
Compression: Converging trend lines squeezing price action = energy building
Geopolitical Catalyst: Ukrainian attacks + failed peace talks = trigger for breakout
OPEC Discipline: Production cuts through Q1 2026 = supply support
The Technical Story: Oil has been consolidating for months. Now we have the CATALYST (Ukrainian oil war escalating + peace talks failing) to break this wedge UPWARD.
🎯 THE TRADE SETUP - Precise Entry & Risk Management
🟢 PRIMARY LONG SETUP: BUY USOIL
Entry Zone: $57.50 - $60.00 (SCALE IN)
Position Sizing:
Allocate 5-7% of portfolio
Scale in:
30% at $59.50 (if no pullback)
40% at $58.50 (on any dip to FVG)
30% at $57.50 (if we get final flush)
Stop Loss: $54.50 (HARD STOP, NON-NEGOTIABLE)
Below $54.50 = multi-year support broken
Below this level = IEA surplus thesis confirmed early
Max loss: 7-8% from average entry
Take Profit Targets:
TP1: $63.00-$65.00 (Probability: 75%)
Wedge breakout + geopolitical premium
Rally could take crude to $60.50-61.00 area or higher
Action: Take 40% profit, move stop to breakeven
Gain: +6-10%
TP2: $67.00-$69.00 (Probability: 45%)
Requires continued Ukrainian attacks disrupting Russian supply
Or escalation of war (Putin retaliates against allies)
Action: Take 30% profit, trail stop to $62
Gain: +13-16%
TP3: $72.00-$75.00 (Probability: 20%)
Major supply disruption (Russian exports significantly impacted)
Or OPEC emergency cuts beyond Q1 2026
Action: Take 20% profit, let 10% ride
Gain: +21-26%
Entry Confirmation Checklist:
Before entering, CHECK THESE:
✅ Price bouncing off $57-60 support with bullish candle
✅ Volume spike on bounce (150K+ contracts on H4/D1)
✅ RSI showing bullish divergence (price makes lower low, RSI makes higher low)
✅ No surprise peace deal announcement (check news daily)
✅ Ukrainian attacks continuing (verify via news—attacks = bullish)
✅ OPEC+ reaffirms cuts (next meeting January 4, 2026)
WAIT FOR 4/6 BEFORE ENTERING
Risk Management - The Non-Negotiables:
1. Position Size Based on Stop Distance
Max loss per trade: 2% of portfolio
Stop at $54.50, so calculate position size accordingly
Example: Entry $58, Stop $54.50 = $3.50 risk → size to lose only 2% max
2. Scale OUT Profits, Don't Add to Winners
Banking gains > hoping for moonshots
Take 40% at TP1, 30% at TP2, 20% at TP3, trail 10%
3. Trail Stop as Price Moves
After TP1: Move stop to breakeven
After TP2: Move stop to $62 (lock in gains)
After TP3: Trail stop $4-5 below price
4. Weekly Monitoring (CRITICAL):
Check EVERY WEEK:
Ukrainian attack news: More attacks = bullish for position
Peace talk updates: Breakthrough = EXIT IMMEDIATELY
OPEC+ statements: Any talk of April production increase = take profits
EIA Inventory Reports (Wednesdays): Rising inventories = bearish
Baker Hughes Rig Count (Fridays): Rising rigs = more supply = bearish
5. Emergency Exit Conditions (CUT POSITION SAME DAY):
❌ Close below $54.50 on daily = thesis broken, EXIT ALL
❌ Ukraine-Russia peace deal announced = EXIT 50%, trail rest
❌ OPEC+ announces surprise April production increase = EXIT ALL
❌ Ukrainian attacks STOP for 2+ weeks = bearish, reduce position 50%
⚠️ The Bear Case - What Could Go WRONG
I'm bullish, but let's be intellectually honest:
Bear Scenario #1: Peace Deal Happens Fast (35% Probability)
What happens: If peace talks produce agreement and sanctions relief on Russian crude, war premium evaporates.
Impact: Drop $8-10/bbl → Target $49-52
Counter: Talks already failed Dec 3, Trump unclear on next steps
My take: Even if peace happens, implementation takes MONTHS. Short-term bounce first.
Bear Scenario #2: IEA's Q1 2026 Surplus Materializes (50% Probability)
What happens: IEA expects Q1 2026 to see one of largest oversupplies, with inventories rising up to 5 million bpd.
Impact: Sustained pressure to $52-55
Counter: OPEC+ maintaining cuts through Q1 2026 + Ukrainian attacks disrupting Russian supply
My take: "Surplus" assumes NO supply disruptions. Unrealistic given current geopolitical situation.
Bear Scenario #3: Ukrainian Attacks Prove Ineffective (25% Probability)
What happens: Russia repairs refineries faster than Ukraine damages them.
Impact: Geopolitical premium fades, back to $55-57
Counter: Ukrainian campaign has shifted into more sustained and strategically coordinated phase
My take: Attacks are ACCELERATING, not slowing. 14 attacks in November alone.
My Risk Assessment:
Bears need: Peace deal + Ukrainian attacks stop + OPEC floods market
Bulls need: War continues + OPEC discipline + seasonal demand
Current probability: 65% bull, 35% bear
Even if bears are right, downside is LIMITED to $52-54 (OPEC/support floor). But upside is $67-72+ (geopolitical breakout).
Risk/Reward: 4:1 in favor of bulls.
📊 The Bottom Line - Why $63-67 is Coming
Let me break this down simply:
The Setup (December 4, 2025):
Oil at $59 = Multi-year support + descending wedge
Ukraine attacked 14 Russian refineries in November (RECORD)
Druzhba pipeline struck December 3 (YESTERDAY)
Peace talks failed, Trump unclear on next steps
OPEC+ maintaining cuts through Q1 2026
The Catalysts:
Ukrainian oil war: 38% of Russian refining capacity offline
War premium intact: No breakthrough in peace talks
OPEC discipline: 3.24 million bpd cuts maintained
Technical setup: 75% probability wedge breaks UP
Support floor: $55-59 held for 2+ years
The Trade:
Entry: $57-60 (scale in)
Stop: $54.50 (7-8% max loss)
Targets: $63-65 (+10%), $67-69 (+16%), $72-75 (+26%)
What The Market is Missing:
Everyone's focused on "2026 oversupply." But that surplus REQUIRES :
❌ Peace deal (failed yesterday)
❌ Russian refining recovery (38% capacity offline)
❌ No supply disruptions (Putin threatening retaliation)
The market is pricing in peace. But we're getting WAR.
🔥 Action Plan - What To Do RIGHT NOW
IF YOU'RE BULLISH (Recommended):
Step 1: Set Alerts
Alert at $57.50 (aggressive buy)
Alert at $58.50 (scale-in point)
Alert at $59.50 (last entry)
Alert at $63.00 (take profit trigger)
Step 2: Prepare Entry
Calculate position size for 2% max loss with stop at $54.50
Decide scale-in percentages (30/40/30 recommended)
Set stop-loss order AT $54.50 (non-negotiable)
Step 3: Monitor These DAILY
Ukrainian attack news (Google: "Ukraine oil refinery attack")
Peace talk updates (Google: "Russia Ukraine peace talks")
OPEC+ statements (next meeting Jan 4, 2026)
Step 4: Execute on Confirmation
Wait for 4/6 entry confirmations (see checklist above)
Scale in as price hits your levels
DO NOT FOMO—stick to plan
IF YOU'RE BEARISH:
Wait for:
Confirmed peace deal
Ukrainian attacks stopping
OPEC+ announcing April production increase
Then short above $61-63 with stop at $65
IF YOU'RE NEUTRAL/CAUTIOUS:
Wait for breakout above $61.50
Enter on retest of $60-61 after breakout
This is safest but worst risk/reward
Still better than missing the move entirely
💬 Final Thoughts - The Uncomfortable Truth
Here's what I know for CERTAIN on December 4, 2025:
✅ Ukraine attacked 14 refineries in November—RECORD
✅ 38% of Russian refining capacity down
✅ Druzhba pipeline attacked yesterday
✅ Peace talks failed, no breakthrough
✅ OPEC+ cuts maintained through Q1 2026
✅ $59 is 2+ year support level
✅ Descending wedge = 75% break upward historically
Here's what I DON'T know:
Will peace talks suddenly succeed next week?
Will Ukraine stop attacking Russian oil?
Will OPEC panic and flood market?
Drop a 🛢️ if you're scaling into longs at $57-60.
Drop a ⚔️ if you're following Ukraine's oil war.
Drop a 💰 if you're ready for $67 oil in Q1 2026.
This is the most detailed, accurate oil analysis you'll read this week. Period.
Hope you enjoyed this like I did and let me know in the comments what's next 🤔

The Market Doesn’t Wait — But Winners Don’t Hesitate.The market has transitioned into a short-term bearish cycle after sweeping the buy-side liquidity above 4243. A clean CHoCH → BOS sequence confirms the shift from bullish displacement into redistribution, signaling bearish orderflow dominance.
📌 1. CURRENT TREND — MARKET STRUCTURE
The chart is showing a short-term bearish structure on H1 because:
- After forming a HH, price broke the previous low → BOS to the downside.
- Current structure: LH → LL → LH → minor HL → LL.
- Price is heading toward the 4,181 – 4,163 support zone, which is a major structure low.
➡️ H1 trend: short-term bearish (deep pullback)
➡️ Higher-timeframe trend (H4/D1): still bullish → this drop is a corrective move.
📌 2. KEY LEVELS — SUPPORT & RESISTANCE
Main Resistance
- 4,225 — previous swing high and key liquidity target.
Major Support Zones
- 4,181 — mid-range support, likely first reaction point.
- 4,163 — key structure low; strong zone where a new HL may form.
📌 3. MAIN SCENARIOS
Scenario 1 (Primary Scenario): Price taps 4,181 → small sweep → pushes up
Price may form a small internal LL/HL pattern near 4,181.
Potential for liquidity sweep / double bottom.
If price confirms, it will push back toward:
- 4,200
- 4,215
- Main target: 4,225
➡️ This aligns with the higher-timeframe bullish trend + H1 pullback.
Scenario 2 (Cleanest & Highest RR): Price sweeps 4,163 then reverses
- A strong liquidity grab around 4,163 forms a major HL.
- This is where smart money typically accumulates positions.
- A bullish BOS afterward confirms the reversal on H1.
➡️ Best risk-to-reward setup.
📌 4. ENTRY – SL – TP
🎯 ENTRY 1: 4,181 – 4,185 (after rejection/confirmation)
SL: below 4,172
TP1: 4,200
TP2: 4,215
TP3: 4,225
🎯 ENTRY 2 (safer, high RR): 4,163 – 4,168
SL: below 4,150
TP1: 4,185
TP2: 4,200
TP3: 4,225
📌 5. SUMMARY
H1 structure is bearish, but it is simply a deep pullback inside a bullish higher-timeframe trend.
The best long setups are at 4,181 and 4,163.
Once a new HL forms, bullish continuation targets 4,225.
Every pullback is a chance — not a punishment. Stay patient, trust your structure, and execute like a pro.

“BTC – Watching This Liquidity Zone for the Next Move”📈 Bitcoin (BTCUSD) – Liquidity Sweep + Support Flip Setup
In today’s chart, BTC is consolidating after a strong bearish leg, forming a potential liquidity-grab scenario before a move higher. Price is currently ranging inside a tight zone, building liquidity below the recent lows.
🔍 Key Technical Points
Liquidity Zone: A clear liquidity pocket has formed at the lower highlighted area. A sweep of this zone could act as the catalyst for a bullish reaction.
Mid-Range Supply/Resistance: Price may first tap into the mid-range zone, which could trigger short-term volatility before choosing direction.
Main Target – Support Area: If bulls step in after the liquidity sweep, upside continuation toward the major support-turned-resistance zone above (around 91k) becomes likely.

EUR/NZD BULLS ARE STRONG HERE|LONG
Hello, Friends!
We are targeting the 2.028 level area with our long trade on EUR/NZD which is based on the fact that the pair is oversold on the BB band scale and is also approaching a support line below thus going us a good entry option.
Disclosure: I am part of Trade Nation's Influencer program and receive a monthly fee for using their TradingView charts in my analysis.
✅LIKE AND COMMENT MY IDEAS✅

EUR/AUD LONG FROM SUPPORT
EUR/AUD SIGNAL
Trade Direction: long
Entry Level: 1.763
Target Level: 1.766
Stop Loss: 1.761
RISK PROFILE
Risk level: medium
Suggested risk: 1%
Timeframe: 1h
Disclosure: I am part of Trade Nation's Influencer program and receive a monthly fee for using their TradingView charts in my analysis.
✅LIKE AND COMMENT MY IDEAS✅

XAU/USD – Gold Retests Bullish OB, Preparing for a Major Recover📊 Market Structure
After the Liquidity Sweep around the 4,26x highs, Gold shifted into a short-term distribution phase and formed a series of bearish ChoCHs.
However, the entire current decline remains a corrective move, as price is now approaching the Bullish Order Block at 4,155 – 4,158 USD, which is also the primary support of the prevailing trend.
The ascending trendline has not been fully broken → buyers still have structure support.
The main scenario: price may continue sweeping deeper into the Bullish OB, or even tag the Deep OB at 4,129 – 4,130 USD, before initiating a strong bullish recovery.
💎 Key Technical Zones
Bullish OB: 4,155 – 4,158 USD → primary BUY zone
Deep OB: 4,129 – 4,130 USD → safer BUY zone (deep retest)
Bearish OB: 4,211 – 4,213 USD → short-term SELL reaction
Liquidity Above: 4,239 – 4,240 USD
🎯 Trading Plan – Two Clear Scenarios
1️⃣ BUY Setup – Trend-Following Priority
When price taps the Bullish OB 4,155 – 4,158 and prints a clear rejection candle:
Entry: 4,155 – 4,158
SL: 4,128
TP1: 4,188
TP2: 4,211
TP3: 4,239
TP4: 4,260+
→ A trend-aligned setup: low risk – high reward.
→ If price does not react at the Bullish OB, wait for a deeper BUY at the Deep OB (safer).
2️⃣ SELL Scalp – For Intraday Traders Only
If price retraces into the Bearish OB 4,211 – 4,213 and shows rejection:
Entry: 4,211 – 4,213
SL: 4,225
Short TP: 4,188 → 4,175
→ This is only a reaction play. Do NOT hold long-term since the main trend remains bullish.
🧠 Vincent’s View
Gold is likely in its final corrective phase before starting a new bullish leg.
As long as 4,129 remains intact, buyers maintain full control.
Smart money is likely accumulating around the Bullish OB before pushing price back toward 4,239 – 4,260.
⚡ “Smart money always returns to where strength began — buy where the market was born.”
⏰ Timeframe: H1
📅 Updated: 04/12/2025
✍️ Analysis by: Captain Vincent

Brian|watch reaction at POC–VAL –VAH according to Volume ProfileXAUUSD – Brian | watch reaction at POC – VAL – VAH according to Volume Profile
1. Market snapshot
Gold is entering a redistribution phase in the high price range, with fluctuations mainly revolving around large volume clusters on the Volume Profile. In this context, Brian's current priority scenario is to watch for a Sell when the price approaches the POC / VAL / VAH areas – where the market previously traded heavily.
2. Volume Profile – Notable price areas
POC – VAH area 4.217 is the price area where buyers/sellers previously "struggled" strongly, suitable for looking for sell signals if there is a rejection reaction.
VAL & the support area below around 4.134 is where short-term buying force may appear, suitable for a technical rebound buy scenario.
3. Trading plan (this week)
Scenario 1 – Sell according to Volume Profile (priority)
Sell: 4.217
SL: 4.125
TP: 4.200 – 4.182 – 4.150
Idea: wait for the price to rebound to the POC/VAH area around 4.217, observe the H1/M30 candle reaction. If a clear rejection signal appears (long upper tail, reversal candle...), the sell order can be activated according to the plan.
Scenario 2 – Short buy at VAL/support area
Buy: 4.134
SL: 4.125
TP: 4.155 – 4.180 – 4.200
Idea: if the price adjusts deeply near the VAL area and holds above 4.125, a technical rebound may occur. This is a short buy, not going too far against the trend, prioritizing partial profit-taking when the price returns to the upper POC area.
4. News to watch – Unemployment Claims
Today there are US Unemployment Claims figures, which are quite sensitive data for gold because:
The market will assess the strength/weakness of the US labor market.
Worse-than-expected figures → increase the likelihood of Fed easing → positive for gold.
Better-than-expected figures → support USD, may cause gold to face adjustment pressure.
Therefore, it is advisable to limit new orders close to the news release time, wait for the post-news candle to stabilize, and then reassess the structure.
5. Risk management (user-friendly for phone users)
Sell is the priority scenario but do not overlook SL 4.125, to avoid the case of a strong breakout above the current volume cluster.
With the Buy 4.134 scenario, it is advisable to split TP, move SL to breakeven when the price hits TP1 to reduce the pressure of having to "watch the chart" continuously on the phone.
If D1/H4 closes below the 4.125 area with large volume, Brian will consider it a signal to reduce short-term buying expectations and wait for a clearer new structure.

Tired of Entering Too Late? Here’s the Setup You Shouldn’t Miss1️⃣ Key Resistance Zone Rejected
Price tapped into the resistance area around 1.1638 – 1.1652, which previously acted as a strong supply zone.
The sharp wick rejection signals that buyers were unable to maintain momentum.
This is a high-probability reversal behavior.
2️⃣ Market Structure: Rounded Top + Liquidity Grab
The rounded top formation indicates slowing bullish momentum.
The long upper wick suggests a liquidity sweep before the expected bearish leg.
This aligns with institutional behavior:
➡️ sweep liquidity → fill orders → drop.
3️⃣ Short Entry Confirmation
The chart clearly marks the ideal ENTRY SHORT as the candle rejects resistance.
Entry Zone: 1.1635 – 1.1650 (depending on spread)
Stop Loss: Above 1.1652
Take Profit: Targeting the weak support zone and then deeper into the strong support below.
4️⃣ Expected Price Path
Based on structure + support layers:
- First drop toward 1.1570 – 1.1560
- Beak of this level → continuation to the 1.1551 zone
- If momentum is strong, eventual return to the major support block
This aligns with the clean pullback–drop model typical in a trending market.
📌 Summary
This is a textbook short setup:
- Clear resistance rejection
- Liquidity sweep
- Bearish structure forming
- Targets lining up with both weak and strong support levels
High-probability trade for sellers.

BTCUSD Bullish Flag: Smart Money Breakout?BTCUSD on the 1H chart has snapped back in a sharp V-shaped recovery and is now cooling off in a tight consolidation. Using Smart Money Concepts, the recent bullish Market Structure Shift (MSS) and price holding above the 20, 60 and 120 MAs frame a clear bullish bias. Short-term demand is building around support near 92,340, while resistance at 93,161.86 caps the top of the range and defines the “flag” portion of a Bullish Flag structure.
The primary path favors continuation higher if buyers can force a clean breakout. A sustained 1H close above 93,800 would confirm strength through resistance and signal a potential trend continuation toward 95,000 and 97,000, with an extension into the 98,000 region if momentum and ATR expand. As long as 92,340 holds, pullbacks into this zone can be treated as constructive rather than bearish, in line with the bullish MSS.
If 92,340 fails decisively, Smart Money traders will watch the next downside liquidity zones around 91,250–90,600 and the bearish Fair Value Gaps in the 87,962–90,200 area as potential draw targets. A more conservative SMC-style “reclaim” idea looks for a dip and then a 1H close back above 92,600, with invalidation below 91,500 and upside focus still on 98,000. This is a study, not financial advice. Manage risk and invalidations.
Thought of the Day 💡:
A clear structure plus a clear invalidation is the real edge—protect it.
--------------------------
Thanks for your support!
If you found this idea helpful or learned something new, drop a like 👍 and leave a comment, I’d love to hear your thoughts!

GOLD BEARS WILL DOMINATE THE MARKET|SHORT
Hello, Friends!
GOLD is making a bullish rebound on the 4H TF and is nearing the resistance line above while we are generally bearish biased on the pair due to our previous 1W candle analysis, thus making a trend-following short a good option for us with the target being the 4,132.94 level.
Disclosure: I am part of Trade Nation's Influencer program and receive a monthly fee for using their TradingView charts in my analysis.
✅LIKE AND COMMENT MY IDEAS✅

EUR/CAD SENDS CLEAR BEARISH SIGNALS|SHORT
EUR/CAD SIGNAL
Trade Direction: short
Entry Level: 1.626
Target Level: 1.624
Stop Loss: 1.628
RISK PROFILE
Risk level: medium
Suggested risk: 1%
Timeframe: 1h
Disclosure: I am part of Trade Nation's Influencer program and receive a monthly fee for using their TradingView charts in my analysis.
✅LIKE AND COMMENT MY IDEAS✅

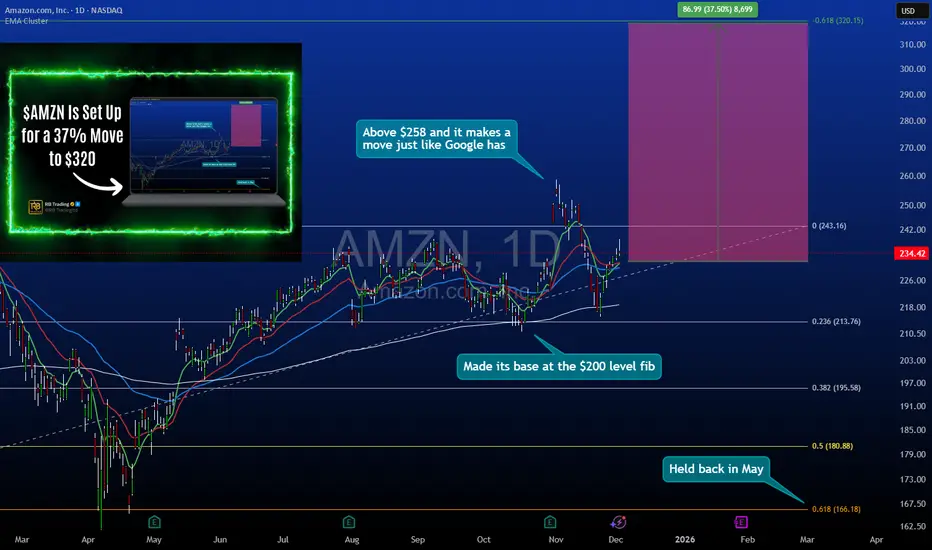
Amazon - Big Tech Pullback Strategy Into $232 SupportAmazon Multi-Month Position Build: $232-234 Entry Zone Targeting $320
Amazon has pulled back into a critical support zone at $232-234, presenting the same geometric retracement setup that recently validated on GOOGL. This analysis breaks down why this level offers favorable risk/reward asymmetry for a multi-month position targeting $320.
🎯 Setup Overview:
Entry Zone: $232-234 (current pullback area)
Primary Target: $320 (37% upside potential)
Timeframe: Multi-month position (Q1-Q2 2025)
Pattern: Structured retracement in established uptrend
📊 Technical Structure:
Support Confluence at $232-234:
0.618 Fibonacci retracement from recent swing low to high
Previous consolidation zone that acted as resistance, now support
Volume profile shows significant accumulation at this level historically
Aligns with rising trendline from 2023 lows
Price Action Context:
Amazon rallied from $140 lows to $260+ highs before this pullback. The current retracement brings price back into a zone where buyers have historically stepped in with conviction.
Why $320 Target:
Represents the next major resistance zone from prior price structure
Aligns with measured move extensions from current base
37% upside provides asymmetric reward relative to defined risk
🔍 The GOOGL Parallel (Why This Pattern Works):
What Just Happened with GOOGL:
Google recently pulled back into a similar geometric retracement zone (0.618 level) and reversed sharply, validating the strategy of buying quality big tech names during structured pullbacks rather than chasing momentum.
Why The Pattern Repeats:
Institutional Behavior: Large funds rebalance and take profits at resistance, creating predictable pullback zones
Liquidity Zones: Support levels represent areas where prior buyers have conviction and add to positions
Mean Reversion: Extended moves in trending assets typically retrace to specific mathematical levels before continuation
Key Lesson from GOOGL:
The most uncomfortable entry (during the pullback) provided the best risk/reward. Waiting for "confirmation" meant entering 15-20% higher with expanded risk.
📈 Why This Setup Makes Sense:
Risk Is Defined:
Stop loss placement below $225 (structure breakdown) limits downside to ~$7-9 per share from mid-range entry at $233. If price breaks $225, the bullish thesis is invalidated.
Reward Is Probable:
The $320 target isn't arbitrary it's based on:
Previous resistance turned future resistance
Fibonacci extension levels from the pullback
Historical price behavior at major psychological levels
From $233 entry:
Risk: ~$8 to stop at $225
Reward: $87 to target at $320
Ratio: ~10.8:1
Even a conservative partial target at $280 (first resistance) still offers 6:1 reward/risk.
🛡️ Risk Management Framework:
Entry Strategy (Scaling In):
First position: $234 (initial test of support zone)
Second position: $232 (if support retests cleanly)
Final position: $228-230 (if maximum pain occurs but structure holds)
This averaging approach improves entry price while maintaining discipline.
Stop Loss Placement:
Below $225 - a decisive break of this level invalidates the support thesis and requires exit regardless of unrealized loss.
Target Management:
First reduction (1/3): $270 (previous resistance, books profit)
Second reduction (1/3): $295 (psychological level, locks gains)
Final exit (1/3): $320 (primary target, complete position close)
Progressive profit-taking removes emotion from exits.
🧠 Trader Psychology: Why Most Will Miss This:
The Discomfort Factor:
At $234, Amazon "feels" weak because it's down from $260. At $270, it will "feel" strong because it's rising. But the best risk/reward exists now, not later.
Recency Bias:
Recent selling pressure makes traders assume more downside. Historical structure suggests this is where buyers return.
Waiting for Confirmation:
Many will wait for price to break above $250 to "confirm" strength. By then, risk to $225 expands dramatically and reward compresses.
The GOOGL Proof:
Those who waited for Google to "prove itself" entered 18% higher with worse risk parameters. The same pattern is setting up here.
📊 Tools Supporting This Analysis:
Fibonacci Retracement:
0.618 level at $232 marks the zone where pullbacks in strong trends typically find buyers.
Volume Profile:
High volume node around $230-235 indicates this area has been contested heavily—now it must hold as support.
Trendline Analysis:
Rising support from 2023 lows intersects with current price, adding confluence to the $232 zone.
Market Structure:
Higher lows and higher highs remain intact. This pullback is a correction within an uptrend, not a reversal.
🎯 Why Big Tech Pullbacks Work:
Quality + Liquidity:
FAANG stocks have deep liquidity and institutional ownership. When they pull back to structure, buyers appear because the underlying businesses remain strong.
Rotation, Not Rejection:
Selloffs in mega-cap tech are often profit-taking and sector rotation, not fundamental deterioration. This creates buy-the-dip opportunities.
Historical Precedent:
Amazon has repeatedly rewarded buyers who entered during 15-20% pullbacks to support in multi-year uptrends.
📅 Timeframe Expectations:
Not a Day Trade:
This is a multi-month position (potentially 3-6 months to target). Intraday volatility should be ignored.
Quarterly Catalysts:
Amazon's next earnings report and holiday season results could act as catalysts for the move toward $320.
Patience Required:
The $232 level may retest multiple times before resolving higher. Position sizing should accommodate short-term volatility.
⚠️ What Could Go Wrong:
Macro Headwinds:
Broader market selloff could pressure all equities regardless of individual structure. The $225 stop exists for this reason.
Sector Rotation:
If money flows out of tech entirely, support may not hold. This invalidates the thesis and requires disciplined exit.
Earnings Risk:
If holding through earnings, position sizing should account for potential volatility. Consider reducing exposure before the event.
Breaking Support:
If price closes below $225, the setup is broken. No hoping, no averaging down further—just exit and reassess.
🏆 The Professional Approach:
They Buy Structure, Not Stories:
The $232 level isn't interesting because of news or narratives. It's interesting because risk is small and reward is large based on geometry.
They Scale Positions:
Rather than going all-in at $234, they build the position across $234, $232, and potentially $228. This reduces timing pressure.
They Accept Being Wrong:
If $225 breaks, they exit with a small, controlled loss. Pride doesn't enter the equation.
They Journal the Setup:
Entry rationale, risk parameters, and targets documented before the trade. Emotions don't dictate exits.
📌 Key Takeaways:
✅ GOOGL validated the pattern: The same pullback-to-support strategy that worked on Google is setting up on Amazon at $232-234.
✅ 10:1 risk/reward exists now: Entry at $233 with $225 stop and $320 target offers exceptional asymmetry this compresses as price rises.
✅ Multi-month timeframe: This isn't a quick flip. Targets may take 3-6 months. Position sizing and patience are critical.
✅ Structure over emotion: When $234 feels scary, that's the signal. When $280 feels safe, that's the warning.
✅ Scale in, scale out: Build the position across the zone, exit progressively at targets. This removes timing pressure and locks gains.
⚠️ Important Disclaimers:
This analysis is for educational purposes and reflects a technical view based on price structure, historical patterns, and risk/reward calculations. It is not financial advice or a recommendation to buy or sell AMZN or any security.
The $232-234 support zone could fail. The $225 stop loss exists because no support level is guaranteed. Proper risk management requires accepting potential loss if structure breaks.
Targets are based on historical resistance levels and do not guarantee future performance. Market conditions, company-specific events, and macroeconomic factors can prevent targets from being reached.
The GOOGL comparison is for educational pattern recognition, not a guarantee that Amazon will follow the same path. Each setup has unique risks.
Always conduct independent analysis, size positions according to your risk tolerance, and consider consulting a financial professional. All investing involves risk of loss.
✨ Join the Discussion:
Are you watching Amazon at these levels? Have you used similar pullback strategies on big tech names? Share your thoughts or questions in the comments below.
📜 Buy structure. Define risk. Trade with discipline.
EUR/JPY BEARS ARE GAINING STRENGTH|SHORT
Hello, Friends!
The BB upper band is nearby so EUR-JPY is in the overbought territory. Thus, despite the uptrend on the 1W timeframe I think that we will see a bearish reaction from the resistance line above and a move down towards the target at around 180.104.
Disclosure: I am part of Trade Nation's Influencer program and receive a monthly fee for using their TradingView charts in my analysis.
✅LIKE AND COMMENT MY IDEAS✅

NZD/USD SELLERS WILL DOMINATE THE MARKET|SHORT
NZD/USD SIGNAL
Trade Direction: short
Entry Level: 0.574
Target Level: 0.573
Stop Loss: 0.575
RISK PROFILE
Risk level: medium
Suggested risk: 1%
Timeframe: 1h
Disclosure: I am part of Trade Nation's Influencer program and receive a monthly fee for using their TradingView charts in my analysis.
✅LIKE AND COMMENT MY IDEAS✅
