NZD/JPY BEARS WILL DOMINATE THE MARKET|SHORT
Hello, Friends!
We are now examining the NZD/JPY pair and we can see that the pair is going up locally while also being in a uptrend on the 1W TF. But there is also a powerful signal from the BB upper band being nearby, indicating that the pair is overbought so we can go short from the resistance line above and a target at 88.001 level.
Disclosure: I am part of Trade Nation's Influencer program and receive a monthly fee for using their TradingView charts in my analysis.
✅LIKE AND COMMENT MY IDEAS✅
Techincalanalysis

CAD/JPY SENDS CLEAR BEARISH SIGNALS|SHORT
Hello, Friends!
The BB upper band is nearby so CAD-JPY is in the overbought territory. Thus, despite the uptrend on the 1W timeframe I think that we will see a bearish reaction from the resistance line above and a move down towards the target at around 109.581.
Disclosure: I am part of Trade Nation's Influencer program and receive a monthly fee for using their TradingView charts in my analysis.
✅LIKE AND COMMENT MY IDEAS✅

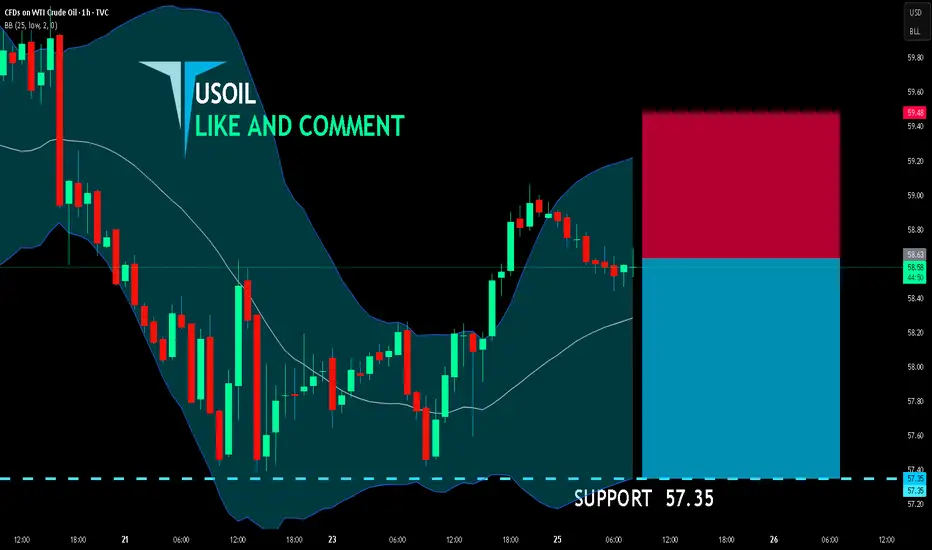
USOIL BEARS ARE GAINING STRENGTH|SHORT
USOIL SIGNAL
Trade Direction: short
Entry Level: 58.63
Target Level: 57.35
Stop Loss: 59.48
RISK PROFILE
Risk level: medium
Suggested risk: 1%
Timeframe: 1h
Disclosure: I am part of Trade Nation's Influencer program and receive a monthly fee for using their TradingView charts in my analysis.
✅LIKE AND COMMENT MY IDEAS✅
XAU/USD – Gold Maintains Uptrend, Monitor Reaction at FvG⏰ Timeframe: 30m
📅 Update: 25/11/2025
🔍 Market Context
After breaking the downtrend structure and creating consecutive bullish CHoCH, gold is maintaining above the Break–FvG zone at 4,107 USD, indicating that buying pressure is still controlling the recovery phase.
The price is in a reaccumulation phase after the break, and it is likely to need a short pullback to "gain momentum" towards the extended resistance zone above.
📊 Technical Structure
FvG Zone (4,107 USD): newly formed balance zone – acts as the main BUY Zone, where price reactions can be observed for quick scalping opportunities.
Break Structure: confirms active buying flow after a series of CHoCH, shifting short-term bias to bullish.
Target Expansion: the 4,188 → 4,228 USD range is an extended resistance band, coinciding with Fibonacci 1.272–1.618.
💎 Key Levels
🟢 Main Support (Support Zones):
• 4,067 USD – technical balance bottom, the last defense zone.
• 4,084 USD – secondary support, confluence with Fibo 0.382.
• 4,107 USD – main FvG zone, monitor reaction for buy scalp.
• 4,131 USD – dynamic support in the recovery cycle.
🔴 Resistance (Resistance Zones):
• 4,155 – 4,165 USD → intermediate resistance zone, potential short-term profit-taking when price reacts.
• 4,188 USD → confluence with Fibo 1.272 – short-term SELL Zone.
• 4,203 – 4,211 USD → extended supply zone, monitor reaction before the US session.
• 4,228 USD → extended resistance, the final target of the current uptrend.
🎯 Market Outlook
1️⃣ Priority Scenario:
– Price may retest the FvG zone – 4,107 USD, then bounce to test resistances 4,155 → 4,188 → 4,228.
– Prioritize monitoring reactions – quick scalping at resistance zones, avoid holding long positions as price approaches 4,211–4,228.
2️⃣ Alternative Scenario:
– If price closes below 4,107 USD, it may reopen the lower balance zone around 4,067 USD.
🧠 Analyst’s View
The market structure leans towards bullish continuation, but the upper zone is approaching a dense resistance cluster – suitable for reactive trading strategies:
→ Observe reactions at each zone to "scalp with the flow," rather than trying to hold the trend.
As long as price maintains above 4,107 USD, the priority remains buy-the-dip – take-profit-on-resistance.
🛡️ Risk Note
Short-term volatility is expanding – clear candle reaction confirmation is needed before taking action.
Analysis is for technical and educational purposes, not investment advice.

XAU/USD: Gold Bullish, Waiting for Perfect Buy Pullback📊 Market Structure
Gold is maintaining a strong bullish structure after a series of BoS from the bottom region. The most recent rally broke the 4,130 mark and continues to hold above the small OB area, indicating that the BUY side is still in control.
Currently, the price is slightly retracing to retest the structure — the target is to test the area:
• OB 4,130 – 4,126 USD
• Or deeper to FVG 4,104 – 4,089 USD
In both cases, these are discount areas to continue BUYING according to the main trend.
The larger trend still targets the upper liquidity levels including:
• 4,151
• 4,181
• 4,207
• 4,243
💎 Key Technical Zones
• OB Retest Zone: 4,130 – 4,126 (quick bounce area)
• FVG Zone: 4,104 – 4,089 (best discount area to BUY)
• Large Bearish OB: 4,045 – 4,060 (final area if price adjusts deeply)
• Target Zones: 4,151 – 4,181 – 4,207 – 4,243
🎯 Trading Plan – BUY (priority)
1️⃣ BUY 1 – Retest OB 4,130
• Entry: 4,126 – 4,131
• SL: below 4,115
• TP1: 4,151
• TP2: 4,181
• TP3: 4,207
• TP4: 4,243
→ This is a quick setup – for a short retracement before continuing.
2️⃣ BUY 2 – FVG 4,104 – 4,089 (best)
• Entry: 4,089 – 4,104
• SL: 4,070
• TP1: 4,151
• TP2: 4,181
• TP3: 4,207
• TP4: 4,243
→ This FVG area is a strong confluence: fibo, small demand, and trendline.
3️⃣ BUY 3 – OB Bearish shift (deep entry)
• Entry: 4,045 – 4,060
• SL: 4,020
• TP1: 4,104
• TP2: 4,151
• TP3: 4,207
→ Only activate when the market shakes strongly, but RR is extremely good.
🎯 SELL Scalp (secondary – only short trades)
Only SELL when the price reaches strong resistance areas and rejection signals appear:
• 4,151
• 4,181
• 4,207
• 4,243
Entry SELL: only enter when there is H1 rejection
SL: 10–15 USD
TP: back to 4,151 → 4,130
→ This is counter-trend, not a priority setup.
🧠 Vincent’s View
The overall trend is still bullish. The current retracements are just a “breathing phase” – the market is accumulating energy to continue pushing up to higher liquidity areas.
As long as the price stays above 4,089 – the bullish trend is not threatened.
“Smart Money buys the dip — Retail buys the breakout.” ⚜️
⏰ Timeframe: 1H
✍️ Analysis by: Captain Vincent

SPX500 Short
Deep crab pattern completes on M15, mapping a potential reversal zone.
Multiple tops formed on M15 and M30 at the same area, reinforcing overhead supply from the prior day’s high that price could not break.
RSI reached overbought on M15 and M30, indicating crowded long positioning.
Approximately 20 points of RSI bearish divergence across M15 and M30, consistent with a weakening advance.
H4 has turned down after last week’s rebound and now aligns with a downside continuation view.
Daily slope is flattening and price is trading beneath it, suggesting the early stages of a broader reversal can develop if sellers follow through.
Bias is short of the reversal zone identified by the deep crab and repeated tops.
Stop loss set at 50 pips to cap risk if resistance fails.
First target at 6,600, which is 100 pips from entry, with room to manage partials at nearby structure if momentum confirms.
Several US indices and other global indices are printing similar topping behavior and momentum fades, adding intermarket confluence to the short idea.

SOL long-term TASolana is in heavy distribution, currently the weekly downtrend is engaged, it needs more time to bottom out, there's a good support at this area of $130ish and if it's broken we can see the lows of $100ish again.

AUD/JPY SELLERS WILL DOMINATE THE MARKET|SHORT
AUD/JPY SIGNAL
Trade Direction: short
Entry Level: 101.104
Target Level: 98.334
Stop Loss: 102.941
RISK PROFILE
Risk level: medium
Suggested risk: 1%
Timeframe: 1D
Disclosure: I am part of Trade Nation's Influencer program and receive a monthly fee for using their TradingView charts in my analysis.
✅LIKE AND COMMENT MY IDEAS✅

GBP/JPY BEARISH BIAS RIGHT NOW| SHORT
Hello, Friends!
Previous week’s green candle means that for us the GBP/JPY pair is in the uptrend. And the current movement leg was also up but the resistance line will be hit soon and upper BB band proximity will signal an overbought condition so we will go for a counter-trend short trade with the target being at 203.382.
Disclosure: I am part of Trade Nation's Influencer program and receive a monthly fee for using their TradingView charts in my analysis.
✅LIKE AND COMMENT MY IDEAS✅

GBP/AUD BEST PLACE TO SELL FROM|SHORT
Hello, Friends!
GBP-AUD uptrend evident from the last 1W green candle makes short trades more risky, but the current set-up targeting 2.017 area still presents a good opportunity for us to sell the pair because the resistance line is nearby and the BB upper band is close which indicates the overbought state of the GBP/AUD pair.
Disclosure: I am part of Trade Nation's Influencer program and receive a monthly fee for using their TradingView charts in my analysis.
✅LIKE AND COMMENT MY IDEAS✅

EUR/JPY BULLS ARE STRONG HERE|LONG
Hello, Friends!
It makes sense for us to go long on EUR/JPY right now from the support line below with the target of 180.945 because of the confluence of the two strong factors which are the general uptrend on the previous 1W candle and the oversold situation on the lower TF determined by it’s proximity to the lower BB band.
Disclosure: I am part of Trade Nation's Influencer program and receive a monthly fee for using their TradingView charts in my analysis.
✅LIKE AND COMMENT MY IDEAS✅

Brian – Gold game plan for the US sessionBrian – Gold game plan for the US session
Gold’s rally yesterday shook a lot of traders out of position – the move was slow, steady and unforgiving, making it hard both to get in and to get out. For now, the short-term trend is clearer on H1, while H4 is still in transition.
Fundamental view – the Fed is confusing everyone
Fed expectations for December have been on a roller-coaster:
The market went from pricing a 25 bp cut in December at over 90%,
Then collapsed those odds to below 30%,
And has now swung sharply back again – all within about a month.
That kind of violent repricing in rate expectations usually creates two things for gold:
underlying support as soon as the market believes in easier policy again, and
choppy two-way volatility around each new data print or Fed comment.
So the macro backdrop still leans supportive for gold, but you do not want to ignore intraday whipsaws.
Technical view – H1 bullish, H4 testing the top of structure
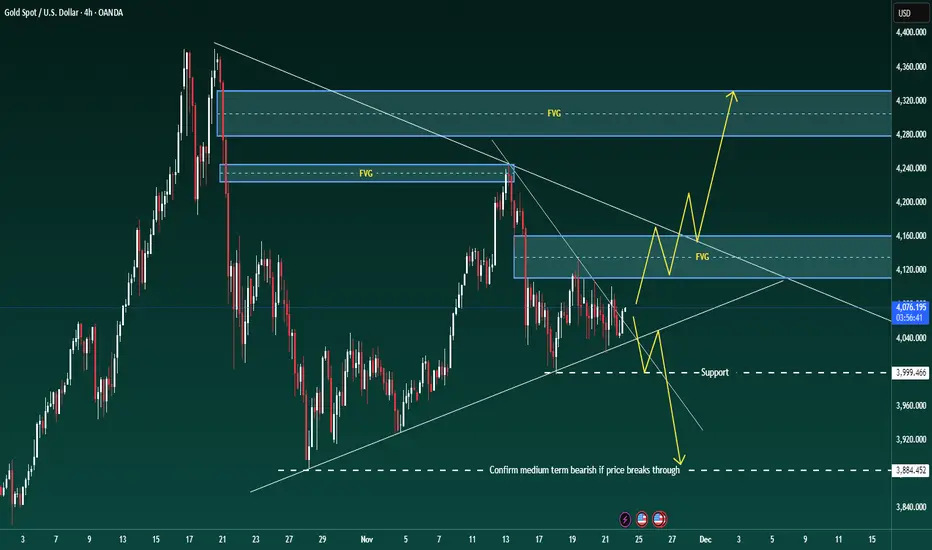
On the H4 chart: Price is trading above the rising medium-term trendline from late October, keeping the broader structure constructive as long as 4,000 holds.
We are now pushing up towards the descending trendline and a H4 supply/FVG band between roughly 4,160 and 4,200.
Higher up sits a larger FVG / resistance block around 4,280–4,330 – if price ever accepts above the current downtrend line, that zone becomes a realistic upside magnet.
On H1: Structure is clearly bullish with higher highs and higher lows after yesterday’s impulsive move.
The current leg is extended, so I prefer to buy dips into support or a clean retest, rather than chase at the top of the candle.
Core bias: still prefer buys with the trend. Shorts are tactical, only at clear reaction zones.
Key levels Resistance / sell zones
4,167–4,169: short-term reaction zone at the descending trendline and FVG
4,200–4,220: upper part of the same supply area
4,280–4,330: major H4 FVG / supply above
Support / buy zones
4,110–4,113: intraday support and potential retest area
4,080–4,070: minor support from recent consolidation
4,040–4,020: deeper pullback zone
4,000: key structural support; a break here would damage the bullish case
3,884: level that would confirm a medium-term bearish shift if price breaks and holds below
Trade scenarios (reference only, not financial advice)
Scenario 1 – Primary long: buy the dip into 4,110
Idea: stay with the bullish H1 structure, use the first decent pullback to get a better entry.
Entry: 4,110–4,113
Stop: 4,105
Targets: 4,125 → 4,140 → 4,180 → 4,200
I want to see price pull back into this zone after a push higher, ideally with a rejection wick or bullish candle confirming buyers are still in control.
Scenario 2 – Tactical short: fade the trendline at 4,167–4,169
Idea: counter-trend scalp from a clean confluence of resistance and FVG.
Entry: 4,167–4,169
Stop: 4,175
Targets: 4,155 → 4,140 → 4,120 → 4,105
This is not a swing short – it is a tactical trade against the intraday trend. Size should be smaller, and I would look to lock in profit or move to breakeven quickly if price reacts in our favour.
Scenario 3 – Breakout long if the trendline gives way
If gold pushes through the descending trendline and holds above the 4,170–4,180 zone:
I will shift back to a breakout-continuation mindset, looking to buy pullbacks above the broken trendline.
The next upside magnets then become 4,220 first and eventually the 4,280–4,330 FVG.
As long as 4,000 holds, I respect the upside and prefer to position with the trend, not against it. If we ever see a daily close below 4,000 and then 3,884, the whole story flips and I’ll start treating rallies as selling opportunities.
Trade the structure in front of you, not the headline noise. Manage risk around the shifting Fed expectations, and let the levels do the heavy lifting.
If this breakdown helps with your game plan, follow Brian for more gold updates during the US session and drop your own view in the comments so we can compare scenarios.

XAU/USD: Gold Uptrend - Buy at 4,090 & 4,044 USD📊 Market Structure
Gold is maintaining an upward structure after creating a series of bullish BoS from the Demand zone. Currently, the price is technically pulling back to discount zones, where the BUY side has more advantages.
Above, the 4,206 USD zone is confirmed as OB Bearish , acting as strong resistance and a potential reversal point for the SELL side.
Below, the discount zones including Fibo–Buy 4,090 and OB Bullish 4,044–4,047 USD are reasonable places to wait for BUY to continue following the main trend.
💎 Key Technical Zones
• Fibo–Buy Zone: 4,085 – 4,095 → priority BUY zone
• FVG Reaction Zone: around 4,095 – 4,105 → signal present → BUY immediately
• OB Bullish: 4,044 – 4,047 → deep, safe BUY zone
• OB Bearish: 4,206 → strong SELL zone
• Partial resistance for SELL scalp: 4,169 – 4,186 – 4,206 – 4,237
🎯 Trading Plan – BUY (Main Priority)
1️⃣ Main BUY – Fibo–Buy 4,090
• Entry: 4,085 – 4,095
• SL: below 4,060
• TP1: 4,169
• TP2: 4,186
• TP3: 4,206 / 4,237
→ This is the most beautiful discount zone according to structure + fibo + trendline.
2️⃣ BUY on Reaction – FVG
If the price only touches FVG 4,095–4,105 and then shows a strong rejection candle:
• BUY immediately when there is a signal
• Target remains: 4,169 → 4,186 → 4,206 → 4,237
3️⃣ Defensive BUY – OB Bullish 4,044
• Entry: 4,044 – 4,047
• SL: 4,020
• TP1: 4,095
• TP2: 4,169
• TP3: 4,206
→ This is the “last bottom” zone before the uptrend is threatened.
🎯 Trading Plan – SELL SCALP (Not the Main Trend)
Zones where SELL can react when a reversal candle appears:
• 4,169 USD
• 4,186 USD
• 4,206 USD (OB Bearish)
• 4,237 USD (Supply)
Entry SELL: when there is a clear rejection (H1 long wick / engulfing)
SL: above the zone 10–15 USD
TP: back to 4,186 → 4,169 → 4,128
→ These are counter-trend scalp orders, only for flexible traders.
🧠 Vincent’s View
The main trend is still up, adjustments down to FVG – Fibo – OB Bullish are all beautiful BUY opportunities.
The BUY side dominates as long as 4,044 is not broken – SELL is only secondary, BUY remains the main play.
“Buy at discount, sell at reaction — that’s how the market moves.”
⏰ Timeframe: 1H
✍️ Analysis by: Captain Vincent

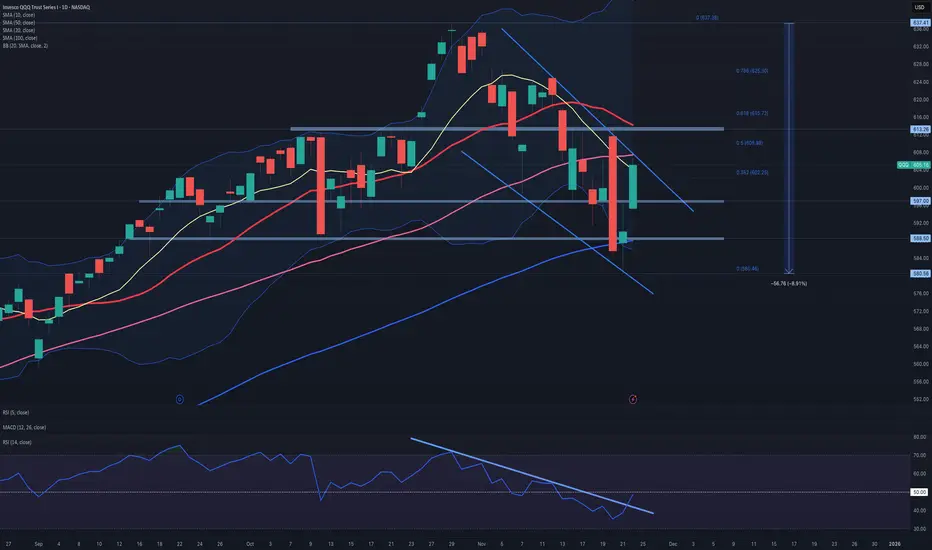
$QQQ: IS THE PULLBACK OVER ?Has the pullback from the all-time high concluded?
Analysis of the chart indicates that the decline from the all-time high appears corrective. This suggests it is unlikely to undermine the prevailing upward trend that began at the lows observed in April, despite registering a 9% decrease.
It is noteworthy that the 0.382 retracement level lies at 548, and the 200-day simple moving average (SMA) is positioned at 544. Consequently, the correction remains well within the boundaries of the existing uptrend, as it has yet to approach the typical 0.382 retracement threshold.
There is also potential evidence of a bullish flag pattern emerging.
The presence of a bearish marubozu candle followed by a doji during the downtrend could imply a potential reversal, with today's bullish gap-up-and-go serving as a possible confirmation signal.
Furthermore, the 14-period RSI has surpassed its resistance trendline; however, this should be validated by a sustained move above the 50 level.
While there are encouraging technical signals, a definitive bottom has not yet been confirmed yet.
Key indicators to monitor include:
• The establishment of higher highs and higher lows, maintaining support at 588.
• A break above the upper trendline of the flag pattern, including moves above the 50-day moving average and significant resistance at 613.
Although QQQ continues in a favorable direction, it is premature to confirm a conclusive trend reversal at present.
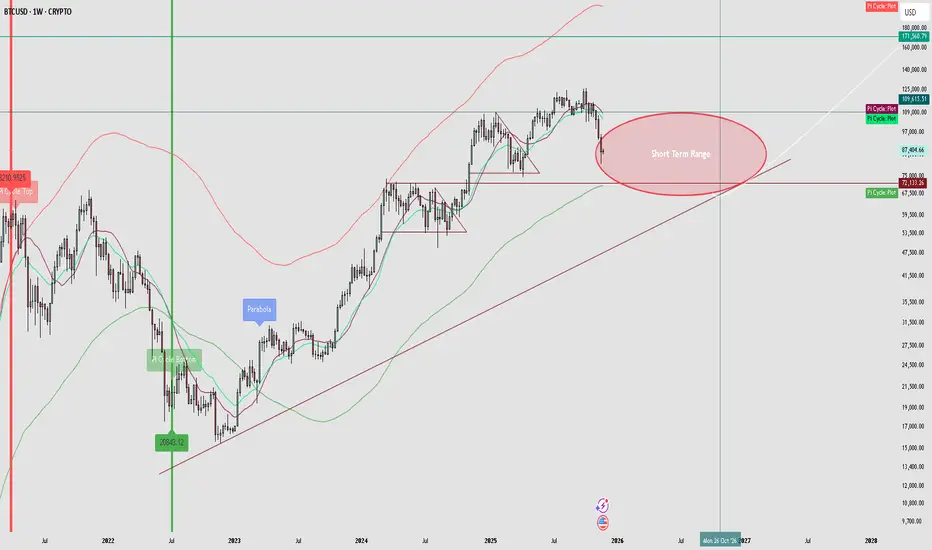
The Bear MarketHere’s my current view of the Bitcoin market:
The 4-year cycle still appears intact, and many who doubt it seem to be in the denial phase. While some market dynamics have changed, the overall structure is still on track. Based on prior cycles, I expect a bear-market bottom to form roughly 324–340 days from now. Until then, I plan to avoid leverage and focus on accumulating during deeper pullbacks. I view Bitcoin around $68k as fair value, with prices above that currently leaning toward overvaluation.
I also disagree with the idea that the cycle can’t be over simply because “too many people are calling the top.” As Bitcoin matures and more cycles unfold, more traders naturally recognize recurring patterns. Increased awareness doesn’t invalidate the possibility that the top is already in.
Comparing this cycle to 2021 is also misleading. The previous double-top was heavily influenced by the pandemic, unprecedented Federal Reserve intervention, stimulus payments, and the surge of retail traders stuck at home. Those conditions don’t exist today. This cycle has been driven instead by regulatory clarity, institutional involvement, and growing governmental trust—resulting in a healthier, more sustainable rally.
Despite extreme fear in the market and widespread pessimism, I believe we still have downside ahead due to broader economic fragility. My current expectation is for a market bottom around October 2026, followed by a renewed parabolic move into the next bull market. I don’t expect Bitcoin to reach $1 million by 2030, though it may be possible someday.
Brian – Gold Money Flow Map for the US Session TodayBrian – Gold Money Flow Map for the US Session Today
Technical analysis – trendline, FVG, and two clear scenarios
On H4, gold is still maintaining a medium-term uptrend line drawn from the end of October. The decline in the Asian session this morning was not strong enough to break the structure; the price touched the trendline and then bounced up, indicating that the sellers have not yet "crushed" this support area.
Current structure: The price is accumulating around the 4,050–4,080 area in a sideways candle cluster, lying on the uptrend line and above the 4,000 support.
Above, the 4,120–4,170 area is an FVG + important supply zone; higher is a larger FVG around 4,280–4,330 – if "filled," it is a potential area for a strong profit-taking move.
Below, the 4,000 mark is a key support; losing this mark, the price could quickly slide to the 3,884 area – marked on the chart as the level confirming a medium-term downtrend if breached.
Until 4,000 is broken, I consider this an accumulation area with a high possibility of "fake breaks" on both sides – so prioritize trading according to the trendline, not guessing tops and bottoms in the noise area.
Key levels
Resistance / sell zone: 4,100–4,110: buy confirmation zone, if rejected will become short-term supply
4,170–4,173: FVG / supply, medium-term short zone
4,280–4,330: large FVG above
Support: 4,048–4,050: trendline + intraday breakout zone
4,022–4,005: next support if the price slides off 4,040
4,000: psychological and structural support
3,884: final support; breaking down will confirm a medium-term downtrend
Trade scenarios (for reference, not investment advice)
1. Sell break intraday – follow the trend if the trendline breaks
Entry: sell when the price breaks the short trend at 4,048–4,050
SL: 4,056
TP: 4,040 → 4,022 → 4,005
Idea: if the price breaks below the current accumulation cluster and short trendline, I want to follow the initial selling force, targeting the adjacent support area 4,022–4,005. When the order goes right, SL can be moved to BE around 4,040.
2. Sell “premium” – short at the upper FVG zone
Entry: 4,170–4,173
SL: 4,178
TP: 4,160 → 4,145 → 4,122 → 4,100
This is a price zone I consider "beautiful" for medium-term trading if the market gives a deep retracement. FVG + H4 resistance converge; if the price is strongly rejected here, the TPs are successively the lower demand zone and the current range bottom.
3. Buy only after clean breakout – do not rush to catch the bottom
I am only interested in buy orders when the market structure truly confirms:
Trigger: H1/H2 candle closes clearly above 4,100
Entry: buy right around 4,100 after breakout
SL: 4,092
TP: medium-term towards the 4,145 → 4,170 → 4,230+ depending on momentum
This scenario considers 4,100 as the "exit door" from the current accumulation area. If this area holds as new support, buyers will have a clearer advantage and the money flow could push the price up to gradually fill the upper FVGs.
USD/CHF BULLS ARE GAINING STRENGTH|LONG
Hello, Friends!
USD/CHF is trending up which is clear from the green colour of the previous weekly candle. However, the price has locally plunged into the oversold territory. Which can be told from its proximity to the BB lower band. Which presents a classical trend following opportunity for a long trade from the support line below towards the supply level of 0.806.
Disclosure: I am part of Trade Nation's Influencer program and receive a monthly fee for using their TradingView charts in my analysis.
✅LIKE AND COMMENT MY IDEAS✅

SILVER BEARS ARE STRONG HERE|SHORT
SILVER SIGNAL
Trade Direction: short
Entry Level: 4,992.1
Target Level: 4,536.3
Stop Loss: 5,296.0
RISK PROFILE
Risk level: medium
Suggested risk: 1%
Timeframe: 1D
Disclosure: I am part of Trade Nation's Influencer program and receive a monthly fee for using their TradingView charts in my analysis.
✅LIKE AND COMMENT MY IDEAS✅

GBP/CHF SHORT FROM RESISTANCE
GBP/CHF SIGNAL
Trade Direction: short
Entry Level: 1.059
Target Level: 1.049
Stop Loss: 1.066
RISK PROFILE
Risk level: medium
Suggested risk: 1%
Timeframe: 6h
Disclosure: I am part of Trade Nation's Influencer program and receive a monthly fee for using their TradingView charts in my analysis.
✅LIKE AND COMMENT MY IDEAS✅

EUR/CHF BEARS WILL DOMINATE THE MARKET|SHORT
Hello, Friends!
EUR/CHF pair is in the uptrend because previous week’s candle is green, while the price is evidently rising on the 1D timeframe. And after the retest of the resistance line above I believe we will see a move down towards the target below at 0.925 because the pair overbought due to its proximity to the upper BB band and a bearish correction is likely.
Disclosure: I am part of Trade Nation's Influencer program and receive a monthly fee for using their TradingView charts in my analysis.
✅LIKE AND COMMENT MY IDEAS✅

XAU/USD Weekly Outlook | Gold Stuck in Consolidation RangeGold ended the week stuck inside a broad consolidation range, trading between 4052 support and 4098 resistance, showing indecision as neither buyers nor sellers have been able to take control.
Both the MA50 and MA200 are flat, reflecting a lack of strong directional momentum — the market is in balance, waiting for a catalyst.
Buyers need a confirmed break and sustained hold above 4098, followed by a break of 4142, to shift momentum. Until then, any upside attempts remain corrective within the range.
Failure to reclaim 4098 increases downside pressure. A drop below 4052 would expose the
4016–3968 Support Zone. If selling momentum extends further, gold could slide into the HTF Support Zone at 3921–3862, which is a major higher-timeframe demand area.
📌 Key levels to watch:
Resistance:
4098
4142
4198
4232
Support:
4052
4016
3968
3921
3862
🔎 Fundamental focus:
This week brings key U.S. data releases such as Core PPI, Retail Sales, Consumer Confidence, and Durable Goods Orders. With gold stuck in a range, any surprise in inflation or consumer strength could spark volatility.

Gold (XAU/USD) Targeting FVG After Liquidity Sweep and Support ?Market Structure
Price recently swept liquidity below the marked support area (the swing low on the 21st–22nd).
This was followed by a strong reaction upward, signaling possible accumulation and sell-side liquidity sweep (SSL).
2. Consolidation & Middle Range
Price is oscillating inside a horizontal range.
The dotted line labeled Middle Range marks the mid-point of this consolidation.
Reclaiming and holding above this midpoint typically signals bullish intent.
3. Liquidity Above (Buy-Side Liquidity – BSL / $$$)
There is a clear cluster of highs on the right side marked “$$$”, representing buy-side liquidity.
These highs are prime targets for a bullish move.
4. Fair Value Gap (FVG)
A large FVG sits above current price.
If price breaks the range, the FVG becomes a high-probability magnet—likely where the next significant reaction will occur.
Expected Scenario (as shown in the drawing)
Small retracement toward support.
Break through middle range.
Sweep the liquidity at “$$$.”
Push into the higher FVG zone.

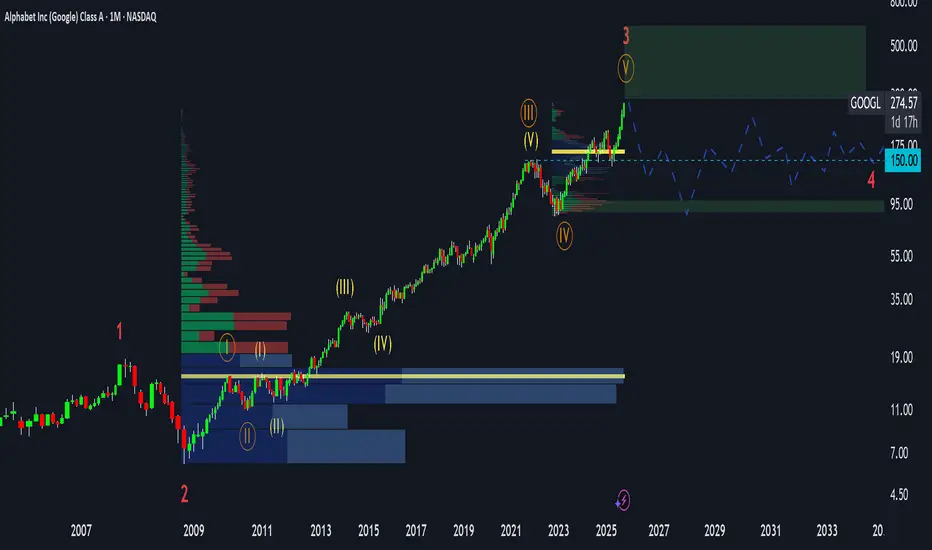
Is Google Entering Distribution? (GOOG, GOOGL Analysis)⚡ Overview
Recently, the charts of all major tech giants — Apple, Amazon, Google, Meta, and Microsoft — have started to look almost identical.
Each of them seems to be either topping out or entering what looks like a distribution phase.
In this post, I’ll share my technical and fundamental outlook on Google (GOOG, GOOGL), along with the key risks and price zones I’m watching as a trader.
💡 Fundamental View
From a fundamental perspective, Google still looks strong:
The P/E ratio has been growing steadily.
Revenue continues to rise.
The company has been aggressively buying back shares for years.
So fundamentally, this is not a bubble.
By Peter Lynch’s fair value formula, Google remains fairly valued, maybe even with a modest upside left.
However, strong fundamentals don’t always mean big growth ahead — especially when the market has already priced in perfection.
And that’s typically when the distribution phase begins.
📈 Technical View
According to Elliott Wave Theory, Google seems to be completing the fifth sub-wave within a larger third wave —
a structure that often marks the final stage before a distribution or correction phase.
On the long-term chart, price is now approaching the upper boundary of the rising channel,
with limited upside potential — possibly up to $430–$450, which represents the top zone.
Beyond that, the probability of continued growth drops sharply, while correction risk increases significantly.
⚙️ Market Structure
When analyzing the volume profile, the largest accumulation zone sits around $15 – $16 —
that’s where long-term investors entered 15 years ago.
Those early buyers are now sitting on massive unrealized profits,
and many are gradually distributing (selling) positions into current strength.
Meanwhile, retail traders often see the ongoing move as “more upside ahead.”
But in reality, this could be the final buying climax before a deeper correction.
🧩 Cycle Context
Interestingly, the same pattern is visible across Apple, Meta, Amazon, and Microsoft.
It’s not just about one stock — the entire Big Tech segment appears to be entering a similar maturity stage of the cycle.
That’s why I believe Google could soon transition from markup to distribution,
followed by a potential multi-quarter sideways or corrective phase.
💬 What’s your take? Do you think Google will reach $400 before correcting — or has the top already formed?
👇 Share your view in the comments.