1:18RR long position goldi had a successful scalp and executed good entries on the fvg and trend liquidity on gold during asians session today but with the scalp the idea was to secure profits at the PDH/ATH while i wait for NY / London session to see if gold will continue to rise like a rocket.
the whole idea here is the long position the bigger picture because with the technical analyses my anticipation has always been to see gold rising till infinity to start with $3500 and $3700.
do you think gold prices will increases to the final key levels?
Techincalanalysis

CAD/JPY SENDS CLEAR BULLISH SIGNALS|LONG
Hello, Friends!
CAD/JPY pair is trading in a local downtrend which we know by looking at the previous 1W candle which is red. On the 6H timeframe the pair is going down too. The pair is oversold because the price is close to the lower band of the BB indicator. So we are looking to buy the pair with the lower BB line acting as support. The next target is 107.013 area.
Disclosure: I am part of Trade Nation's Influencer program and receive a monthly fee for using their TradingView charts in my analysis.
✅LIKE AND COMMENT MY IDEAS✅

AUD/JPY BEARS ARE GAINING STRENGTH|SHORT
Hello, Friends!
We are going short on the AUD/CHF with the target of 96.111 level, because the pair is overbought and will soon hit the resistance line above. We deduced the overbought condition from the price being near to the upper BB band. However, we should use low risk here because the 1W TF is green and gives us a counter-signal.
Disclosure: I am part of Trade Nation's Influencer program and receive a monthly fee for using their TradingView charts in my analysis.
✅LIKE AND COMMENT MY IDEAS✅

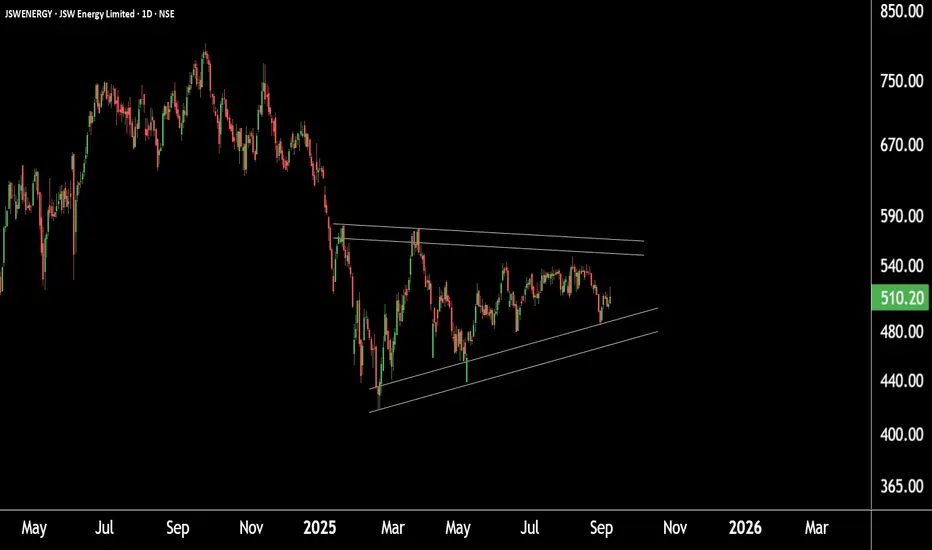
Chart Alert: Major Pattern Formation in JSW EnergyThis is the daily timeframe chart of JSW Energy.
The stock is currently forming a symmetrical triangle pattern with support around ₹465–₹475 and resistance near ₹564–₹570.
If JSW Energy sustains above this resistance zone, it could trigger a breakout, potentially leading to higher price levels in the coming sessions.
Thank you.
SILVER SELLERS WILL DOMINATE THE MARKET|SHORT
SILVER SIGNAL
Trade Direction: short
Entry Level: 4,066.6
Target Level: 3,923.7
Stop Loss: 4,160.4
RISK PROFILE
Risk level: medium
Suggested risk: 1%
Timeframe: 12h
Disclosure: I am part of Trade Nation's Influencer program and receive a monthly fee for using their TradingView charts in my analysis.
✅LIKE AND COMMENT MY IDEAS✅

GBP/CAD BEARISH BIAS RIGHT NOW| SHORT
GBP/CAD SIGNAL
Trade Direction: short
Entry Level: 1.867
Target Level: 1.854
Stop Loss: 1.875
RISK PROFILE
Risk level: medium
Suggested risk: 1%
Timeframe: 8h
Disclosure: I am part of Trade Nation's Influencer program and receive a monthly fee for using their TradingView charts in my analysis.
✅LIKE AND COMMENT MY IDEAS✅

GBP/JPY BEST PLACE TO SELL FROM|SHORT
Hello, Friends!
We are now examining the GBP/JPY pair and we can see that the pair is going up locally while also being in a uptrend on the 1W TF. But there is also a powerful signal from the BB upper band being nearby, indicating that the pair is overbought so we can go short from the resistance line above and a target at 199.370 level.
Disclosure: I am part of Trade Nation's Influencer program and receive a monthly fee for using their TradingView charts in my analysis.
✅LIKE AND COMMENT MY IDEAS✅

Gold🔸As expected, the gold price has continued its upward rally over the past weeks.
🔹It is still possible to re-enter the buy trade for the classic target of 3645 on pullbacks.
🔸The divergence in the RSI indicator can be seen on the 4-hour chart, which can be considered a good place to exit the trade and save profits.
🔹However, as long as the 4-hour candle does not close below 3511, it is possible to take risks for short-term purchases within the specified ranges.

XAUUSD – Week 08/09 to 12/09, CPI & PPI in FocusXAUUSD – Week 08/09 to 12/09, CPI & PPI in Focus
Good day Traders,
Gold posted a notable advance last week, recording new highs on a near-daily basis. While this type of price action is not unprecedented, it has introduced an element of caution to the market. Investor sentiment remains firmly skewed towards the long side, reaffirming gold’s position as a key safe-haven asset.
Fundamental Outlook
Attention this week will centre on the release of US CPI and PPI data. These figures will be critical in assessing the financial health of the US economy and could directly shape the Federal Reserve’s decision on a potential rate cut in September.
Technical Outlook
Price has already surpassed the Fibonacci 1.618 extension, with the next upside projection aligning near the 2.618 level at 3687.
Prior to reaching this objective, a modest retracement into nearby FVG (Fair Value Gap) zones is possible.
On a longer-term horizon, the 3467 – 3475 region is highlighted as a constructive area for accumulation, supported by the confluence of FVG, Dibo and Volume Profile.
Trading Scenarios
Upside Bias: Long positions remain the preferred approach. The 3467–3475 area offers a technically favourable entry zone for those with a longer-term outlook.
Downside Case: Short exposure should only be considered upon evidence of a reversal structure, with confirmation via a break below 3510, or rejection from the 2.618 Fibonacci extension.
Final Thoughts
For the week ahead, gold continues to be best approached from the long side. Nevertheless, traders should closely monitor price reactions at the identified technical levels and adjust accordingly. With key macroeconomic releases imminent, maintaining disciplined risk management remains essential.

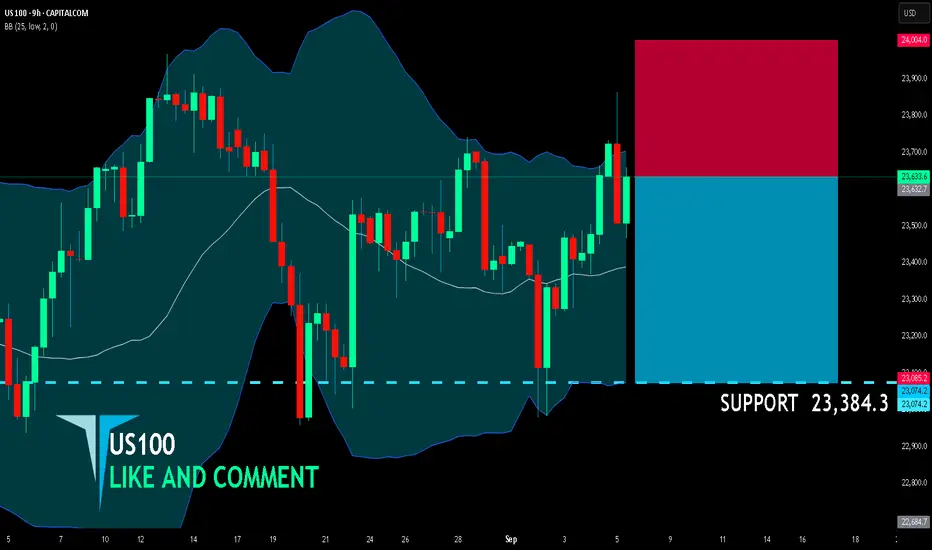
US100 SHORT FROM RESISTANCE
US100 SIGNAL
Trade Direction: short
Entry Level: 23,632.7
Target Level: 23,384.3
Stop Loss: 24,004.0
RISK PROFILE
Risk level: medium
Suggested risk: 1%
Timeframe: 9h
Disclosure: I am part of Trade Nation's Influencer program and receive a monthly fee for using their TradingView charts in my analysis.
✅LIKE AND COMMENT MY IDEAS✅
GBP/AUD BEARS WILL DOMINATE THE MARKET|SHORT
Hello, Friends!
Previous week’s green candle means that for us the GBP/AUD pair is in the uptrend. And the current movement leg was also up but the resistance line will be hit soon and upper BB band proximity will signal an overbought condition so we will go for a counter-trend short trade with the target being at 2.047.
Disclosure: I am part of Trade Nation's Influencer program and receive a monthly fee for using their TradingView charts in my analysis.
✅LIKE AND COMMENT MY IDEAS✅

NZD/JPY BULLS ARE GAINING STRENGTH|LONG
Hello, Friends!
NZD-JPY downtrend evident from the last 1W red candle makes longs trades more risky, but the current set-up targeting 87.632 area still presents a good opportunity for us to buy the pair because the support line is nearby and the BB lower band is close which indicates the oversold state of the NZD/JPY pair.
Disclosure: I am part of Trade Nation's Influencer program and receive a monthly fee for using their TradingView charts in my analysis.
✅LIKE AND COMMENT MY IDEAS✅

NZD/CAD LONG FROM SUPPORT
NZD/CAD SIGNAL
Trade Direction: long
Entry Level: 0.807
Target Level: 0.814
Stop Loss: 0.803
RISK PROFILE
Risk level: medium
Suggested risk: 1%
Timeframe: 12h
Disclosure: I am part of Trade Nation's Influencer program and receive a monthly fee for using their TradingView charts in my analysis.
✅LIKE AND COMMENT MY IDEAS✅

CAD/CHF BEARS ARE STRONG HERE|SHORT
Hello, Friends!
We are going short on the CAD/CHF with the target of 0.578 level, because the pair is overbought and will soon hit the resistance line above. We deduced the overbought condition from the price being near to the upper BB band. However, we should use low risk here because the 1W TF is green and gives us a counter-signal.
Disclosure: I am part of Trade Nation's Influencer program and receive a monthly fee for using their TradingView charts in my analysis.
✅LIKE AND COMMENT MY IDEAS✅

USD/JPY SELLERS WILL DOMINATE THE MARKET|SHORT
Hello, Friends!
It makes sense for us to go short on USD/JPY right now from the resistance line above with the target of 147.408 because of the confluence of the two strong factors which are the general downtrend on the previous 1W candle and the overbought situation on the lower TF determined by it’s proximity to the upper BB band.
Disclosure: I am part of Trade Nation's Influencer program and receive a monthly fee for using their TradingView charts in my analysis.
✅LIKE AND COMMENT MY IDEAS✅

USD/CHF BEARS ARE GAINING STRENGTH|SHORT
Hello, Friends!
USD/CHF is making a bullish rebound on the 6H TF and is nearing the resistance line above while we are generally bearish biased on the pair due to our previous 1W candle analysis, thus making a trend-following short a good option for us with the target being the 0.801 level.
Disclosure: I am part of Trade Nation's Influencer program and receive a monthly fee for using their TradingView charts in my analysis.
✅LIKE AND COMMENT MY IDEAS✅

Ethereum Weekly Analysis📊 Ethereum Weekly Analysis
This week, I have analyzed the ETH/USDT chart focusing on key support & resistance levels, market structure, and potential trading zones.
The breakdown includes:
🔹 Weekly trend direction
🔹 Major support & resistance zones
🔹 Key liquidity levels & possible reversal points
🔹 Short & long opportunities based on structure
This analysis is purely educational and based on my personal trading experience. Always manage risk properly and do your own research before trading

GOLD SENDS CLEAR BEARISH SIGNALS|SHORT
GOLD SIGNAL
Trade Direction: short
Entry Level: 3,586.96
Target Level: 3,559.28
Stop Loss: 3,605.13
RISK PROFILE
Risk level: medium
Suggested risk: 1%
Timeframe: 1h
Disclosure: I am part of Trade Nation's Influencer program and receive a monthly fee for using their TradingView charts in my analysis.
✅LIKE AND COMMENT MY IDEAS✅

EUR/NZD BEARS ARE GAINING STRENGTH|SHORT
Hello, Friends!
EUR-NZD uptrend evident from the last 1W green candle makes short trades more risky, but the current set-up targeting 1.942 area still presents a good opportunity for us to sell the pair because the resistance line is nearby and the BB upper band is close which indicates the overbought state of the EUR/NZD pair.
Disclosure: I am part of Trade Nation's Influencer program and receive a monthly fee for using their TradingView charts in my analysis.
✅LIKE AND COMMENT MY IDEAS✅

EUR/AUD SELLERS WILL DOMINATE THE MARKET|SHORT
Hello, Friends!
EUR/AUD pair is in the uptrend because previous week’s candle is green, while the price is evidently rising on the 3H timeframe. And after the retest of the resistance line above I believe we will see a move down towards the target below at 1.779 because the pair overbought due to its proximity to the upper BB band and a bearish correction is likely.
Disclosure: I am part of Trade Nation's Influencer program and receive a monthly fee for using their TradingView charts in my analysis.
✅LIKE AND COMMENT MY IDEAS✅

Bitcoin – H4 Mid-Term OutlookBitcoin – H4 Mid-Term Outlook
Good day Traders,
Bitcoin remains in a broad sideways range. Although the recent NFP release generated strong trading volume, the market has yet to confirm a dominant direction. For now, price continues to rotate within the 107k – 113k area.
Elliott Wave View
There are signs that Wave 5 has likely completed, while an A–B corrective phase is developing. Within this structure, the market could still deliver one more upward move before clarity emerges.
Trendline & Critical Levels
A descending trendline is capping upside momentum, offering potential early short entries. Still, a decisive break below 107k would be needed to confirm a mid-term bearish structure.
Alternatively, if price retests the trendline and rebounds, a wave C rally could unfold.
It is also worth noting that BTC remains above its rising channel, signalling that sellers have yet to take full control.
Possible Scenarios
Bullish Scenario:
Holding above 107k and breaking through 113k would open the way towards 115k – 118k. Long setups should ideally be backed by stronger volume or a confirming MACD signal.
Bearish Scenario:
A failure to defend 107k could accelerate selling pressure, dragging price back towards 104k – 101k, where key support lies.
Professional Insight
The market currently lacks clear direction in the mid-term. Monitoring price action at 107k and along the descending trendline will be critical for defining the next move. Until then, flexibility and strict risk management remain vital for traders navigating this environment.

USOIL BULLISH BIAS RIGHT NOW| LONG
USOIL SIGNAL
Trade Direction: long
Entry Level: 63.13
Target Level: 65.08
Stop Loss: 61.82
RISK PROFILE
Risk level: medium
Suggested risk: 1%
Timeframe: 9h
Disclosure: I am part of Trade Nation's Influencer program and receive a monthly fee for using their TradingView charts in my analysis.
✅LIKE AND COMMENT MY IDEAS✅

EUR/CAD BEST PLACE TO SELL FROM|SHORT
EUR/CAD SIGNAL
Trade Direction: short
Entry Level: 1.610
Target Level: 1.600
Stop Loss: 1.616
RISK PROFILE
Risk level: medium
Suggested risk: 1%
Timeframe: 9h
Disclosure: I am part of Trade Nation's Influencer program and receive a monthly fee for using their TradingView charts in my analysis.
✅LIKE AND COMMENT MY IDEAS✅
