EURNZD trend breakout and start of correctionEURNZD has broken below the ascending channel and confirmed the breakout under 2.0350. This indicates the start of a corrective phase. Downside targets are 2.0190, 2.0020, and 1.9860. As long as the price stays below the confirmation zone, sellers dominate the market. A return above 2.0370 would cancel the bearish outlook and restore the upward trend.
The New Zealand dollar remains supported by stable macroeconomic data and expectations that the RBNZ will maintain tight policy longer than the ECB. Meanwhile, the euro faces pressure from weak industrial performance and sluggish recovery across the eurozone. These factors favor further downside for EURNZD.
Following the breakout and confirmation, EURNZD is likely to continue its correction. As long as the price remains below 2.0350, the bias stays bearish with targets at 2.0190, 2.0020, and 1.9860.
Techincalanalysis

MEMECORE/USDT — Range Recovery Forming, Watching Higher levelsMEMECORE has shown a steady rebound from the lower range near $2.00, regaining short-term momentum as it attempts to reclaim the $2.34 zone, which has acted as a strong resistance multiple times.
A confirmed breakout above $2.34 would signal a shift in momentum and open the path toward the range high at $2.53, where the next major liquidity zone sits.
📊 Technical Overview:
Range Support: $2.00
Range Resistance: $2.34
Breakout Target: $2.53
Bias: Neutral → Bullish above $2.34
If MEMECORE continues to hold above the $2.00 base with rising volume, the structure suggests potential for a range breakout and short-term trend reversal.
📈 Outlook: Building strength inside range
🎯 Targets: $2.34 → $2.53

SILVER BULLS WILL DOMINATE THE MARKET|LONG
SILVER SIGNAL
Trade Direction: long
Entry Level: 4,960.5
Target Level: 5,379.0
Stop Loss: 4,680.9
RISK PROFILE
Risk level: medium
Suggested risk: 1%
Timeframe: 9h
Disclosure: I am part of Trade Nation's Influencer program and receive a monthly fee for using their TradingView charts in my analysis.
✅LIKE AND COMMENT MY IDEAS✅

NZD/JPY SENDS CLEAR BEARISH SIGNALS|SHORT
NZD/JPY SIGNAL
Trade Direction: short
Entry Level: 86.714
Target Level: 86.288
Stop Loss: 86.998
RISK PROFILE
Risk level: medium
Suggested risk: 1%
Timeframe: 2h
Disclosure: I am part of Trade Nation's Influencer program and receive a monthly fee for using their TradingView charts in my analysis.
✅LIKE AND COMMENT MY IDEAS✅

CAD/JPY BEARS ARE GAINING STRENGTH|SHORT
Hello, Friends!
CAD/JPY pair is in the downtrend because previous week’s candle is red, while the price is obviously rising on the 4H timeframe. And after the retest of the resistance line above I believe we will see a move down towards the target below at 106.478 because the pair is overbought due to its proximity to the upper BB band and a bearish correction is likely.
Disclosure: I am part of Trade Nation's Influencer program and receive a monthly fee for using their TradingView charts in my analysis.
✅LIKE AND COMMENT MY IDEAS✅

XAUUSD – Bearish Scenario ActivatedXAUUSD – Bearish Scenario Activated: watch for sell retest at 4,303–4,305, deep buy at 4,208–4,210 🟡
Gold just hit a historical peak of 4,381, but the subsequent sharp drop opens up the risk of a short-term correction. On H1, the price is blocked by a descending trendline and the sell zone cluster at 4,30x; below are liquidity zones and the bottom trendline waiting to be retested.
Quick chart insights
Structure shifts to a descending triangle pullback after breaking the upward momentum.
Sell zone 4,303–4,305 coincides with the descending trendline + heavy volume (VP).
Below 4,26x is Liquidity Buy; deeper lies the 4,208–4,210 mark near FE 4.236 and the trendline base — the final “shakeout” zone before recovery.
Trading Plan (if–then)
Sell retest (priority in weak rebound)
Entry: 4,305–4,303
SL: 4,310
TP: 4,287 → 4,260 → 4,242 → 4,220
Condition: rebound to 4,30x and the appearance of a rejection/engulfing candle on H1 below the descending trendline.
Deep buy (liquidity sweep + rebound)
Entry: 4,210–4,208
SL: 4,204
TP: 4,225 → 4,242 → 4,270 → 4,298
Condition: deep shakeout to 4,21x, appearance of pin bar/absorbing volume at the bottom trendline.
Invalidation
Sell scenario invalidated if H1 closes above 4,310.
Buy scenario invalidated if H1 closes below 4,204 (risk of deeper trendline range).
Key Levels to Watch (easy on mobile)
Resistance: 4,303–4,305 • 4,320–4,325 (descending trendline)
Support: 4,260–4,255 • 4,242 • 4,210–4,208 • 4,200
Expected move: rebound to 4,30x → sell down to 4,26x/4,24x; sweep 4,21x → rebound to 4,27x–4,29x.
Quick Context (macro)
Expectations of Fed rate cuts + geopolitical risks keep the major trend upward, but after ATH, there’s often a short-term sell-off to rebalance positions.
Monitor USD/yield fluctuations: a strong USD will support the sell retest scenario; a cooling USD creates opportunities for a rebound from buy zones.

AUD/JPY SELLERS WILL DOMINATE THE MARKET|SHORT
Hello, Friends!
AUD/JPY pair is trading in a local downtrend which know by looking at the previous 1W candle which is red. On the 1H timeframe the pair is going up. The pair is overbought because the price is close to the upper band of the BB indicator. So we are looking to sell the pair with the upper BB line acting as resistance. The next target is 97.676 area.
Disclosure: I am part of Trade Nation's Influencer program and receive a monthly fee for using their TradingView charts in my analysis.
✅LIKE AND COMMENT MY IDEAS✅

GOLD|When the market loses balance, dominance leaves a footprint🔍 Market Context
After establishing a short-term peak in the 4,385 – 4,372 USD range, gold has entered a phase of strong technical correction , with consecutive red candles breaking the short-term upward structure.
The sellers temporarily dominate, pushing the price through the H1 upward trendline. However, the support zone below (Liquidity Zone + Order Block Bullish) is beginning to show absorption force, indicating the possibility that buyers might return at discounted price levels.
💎 Technical Analysis
Previous Bullish BoS: confirms the main trend is still long-term bullish .
FVG Down Zone: 4,285 – 4,260 USD → an unfilled price balance area during the decline, potentially a place for price to retrace to “fill the gap” before choosing a direction.
Liquidity Zone $$$: 4,222 – 4,218 USD → a short-term support area where new buying liquidity appears.
Order Block Bullish: 4,203 – 4,185 USD → a confluence area between OB and Fibo 0.786, where large capital might return.
Deep Bullish OB: 4,142 – 4,128 USD → the final defense zone for the main upward trend.
Order Block Bearish: 4,372 – 4,385 USD → a critical resistance area, likely to react if the price retraces.
The current structure shows gold is in a retracement – liquidity rebalancing phase, lacking sufficient signals to reverse the trend.
📈 Trading Scenarios
1️⃣ Main Scenario – Buy reaction at Liquidity Zone 4,222 – 4,203 USD
Entry: 4,222 – 4,203
SL: 4,185
TP: 4,260 → 4,318 → 4,372
✅ Condition: Strong rejection candles (rejection / engulfing bullish) appear at the support zone or small reversal BoS.
➡️ This is a “buy the dip” setup following the main trend, leveraging the liquidity zone and confluence OB.
2️⃣ Secondary Scenario – Sell reaction at FVG Down 4,285 – 4,260 USD
Entry: 4,260 – 4,285
SL: 4,300
TP: 4,222 → 4,203
✅ Condition: Strong bearish candles or rejection signals appear at the FVG zone.
➡️ This setup is for scalping traders or short-term shorts in the unfilled price balance area.
⚠️ Risk Management
Do not FOMO buy when the price has not confirmed the 4,222 zone.
If the price breaks below 4,185 → wait for a re-test to continue selling towards the 4,128 zone.
Maintain moderate volume, as the market is in a rebalancing phase – liquidity is still noisy.
💬 Conclusion
Gold is in a transitional phase after a strong decline .
The 4,222 – 4,203 USD zone will be key to determining whether the medium-term upward trend continues.
If this zone holds, gold is likely to retest the 4,318 – 4,372 USD range.
👉 Reasonable Strategy:
Buy reaction at 4,222 – 4,203 USD when confirmed.
Sell technically at FVG 4,260 – 4,285 USD if clear rejection appears.
🔥 “When the market loses balance, the strongest side will leave a trace – and this time the trace lies around the 4,220 USD zone.”

USDJPY D1 TRADE IDEA FRAMEWORK, FOR 20TH OCT, 2025.The UJ market is overall on an uptrend and currently in and out of range, which seems the price is trying to retrace downwards a bit to fill the Gap Area indicated below.
Now let's talk a little bit about Market Gaps...
One of the regular behaviour of the markets that happens is that usually after a sessional jump(GAPS) most times which is created after the weekend of a past trading week, the markets usually most times make a Gap because of the lack of trading activity over the weekend that create a void in prices, so in other for the market to create a balance before the market continues in its determined direction? It usually, as always, comes back to fill the Gaps of inactivity before it resumes on a balanced trajectory.
This is why, in most cases, holding trades over the weekend isn't advisable to avoid overnight fees, swaps, and drawdowns in capital or profits when holding a position, especially when under-capitalized, because these kinds of Gaps or Jumps in price happen due to fresh information that comes into the market before a new session begins.

GBP/JPY BEARS ARE STRONG HERE|SHORT
Hello, Friends!
We are targeting the 200.306 level area with our short trade on GBP/JPY which is based on the fact that the pair is overbought on the BB band scale and is also approaching a resistance line above thus going us a good entry option.
Disclosure: I am part of Trade Nation's Influencer program and receive a monthly fee for using their TradingView charts in my analysis.
✅LIKE AND COMMENT MY IDEAS✅

LiamTrading - XAUUSD: Mid-Term Correction Begins ...LiamTrading - XAUUSD: Mid-Term Correction Begins - Watch for Selling at Key Resistance Zone
Hello traders community,
After a surge due to geopolitical tensions, XAUUSD (Gold) is starting to show signs of a mid-term correction. The upward momentum has stalled, and prices are showing weakness from the peak region.
The market is currently in a state of tug-of-war, influenced by various macro factors, creating clear two-way trading opportunities.
📰 Macro Analysis: Interwoven Market
Gold prices are currently caught between three main streams of information:
Support (Bullish): The Israel–Hamas conflict and escalating geopolitical risks remain the main "safe haven" factor, keeping Gold prices anchored at high levels.
Pressure (Bearish): Signs of "cooling down" in US-China trade tensions reduce the demand for safe haven assets and restrain Gold's upward momentum.
Long Term (Bullish): Expectations that the Fed will soon cut interest rates continue to support Gold in the long term, although it does not have a strong short-term impact.
This contradiction makes it difficult for the market to break further, instead necessitating a technical correction.
📊 Technical Analysis
The M30/H1 chart clearly shows the correction structure forming:
Declining Structure: Prices have formed a distinct peak and dropped sharply, breaking short-term upward structures. The current uptrend is merely a technical recovery wave.
Dominant Sell Zone: The $4306 zone is an extremely important confluence area. This is:
The 0.382 Fibonacci Retracement level, a common retracement ratio.
An old support zone that has been broken, now becoming strong resistance ("Sell fibonacci and support" on the chart).
A large previous liquidity area, where sellers will strongly defend this region.
Price Decline Target: The main target for this decline is the VAL (Value Area Low) zone of the Volume Profile indicator, around $4180. This is a high-volume trading area, where buyers are likely to return.
🎯 Detailed Trading Strategy
The main priority is to watch for selling at Fibonacci resistance zones.
Scenario 1: Sell Correction (Sell) 📉
Entry: $4306
Stop Loss (SL): $4312 (A tight, safe SL above the resistance zone)
Take Profit (TP): $4288 - $4265 - $4233 - $4210 - $4190 (Final target is the VAL zone)
Scenario 2: Buy at Strong Support Zone (Buy) 📈
Entry: Watch for buying when prices correct deeply to the VAL $4178 zone.
Stop Loss (SL): $4170
Take Profit (TP): $4198 - $4225 - $4246 - $4270
Summary
Although long-term macro factors continue to support Gold, technically, a mid-term correction has begun. The optimal strategy is to watch for selling (Sell) when prices recover to the confluence resistance zone $4306 and take profits at the targets below, especially the VAL $4180 zone.
Always manage your capital tightly. Wishing traders a successful week!
Note: This article is for reference only and is not investment advice.

GBP/CHF SENDS CLEAR BULLISH SIGNALS|LONG
Hello, Friends!
Bullish trend on GBP/CHF, defined by the green colour of the last week candle combined with the fact the pair is oversold based on the BB lower band proximity, makes me expect a bullish rebound from the support line below and a retest of the local target above at 1.076.
Disclosure: I am part of Trade Nation's Influencer program and receive a monthly fee for using their TradingView charts in my analysis.
✅LIKE AND COMMENT MY IDEAS✅

BITCOIN SHORT FROM RESISTANCE
BITCOIN SIGNAL
Trade Direction: short
Entry Level: 111,579.80
Target Level: 109,830.73
Stop Loss: 112,744.35
RISK PROFILE
Risk level: medium
Suggested risk: 1%
Timeframe: 1h
Disclosure: I am part of Trade Nation's Influencer program and receive a monthly fee for using their TradingView charts in my analysis.
✅LIKE AND COMMENT MY IDEAS✅

EUR/AUD BEST PLACE TO SELL FROM|SHORT
Hello, Friends!
EUR/AUD pair is in the downtrend because previous week’s candle is red, while the price is clearly rising on the 2H timeframe. And after the retest of the resistance line above I believe we will see a move down towards the target below at 1.794 because the pair is overbought due to its proximity to the upper BB band and a bearish correction is likely.
Disclosure: I am part of Trade Nation's Influencer program and receive a monthly fee for using their TradingView charts in my analysis.
✅LIKE AND COMMENT MY IDEAS✅

GOLD SELLERS WILL DOMINATE THE MARKET|SHORT
GOLD SIGNAL
Trade Direction: short
Entry Level: 4,341.28
Target Level: 4,245.41
Stop Loss: 4,404.72
RISK PROFILE
Risk level: medium
Suggested risk: 1%
Timeframe: 2h
Disclosure: I am part of Trade Nation's Influencer program and receive a monthly fee for using their TradingView charts in my analysis.
✅LIKE AND COMMENT MY IDEAS✅

EUR/NZD BEARISH BIAS RIGHT NOW| SHORT
EUR/NZD SIGNAL
Trade Direction: short
Entry Level: 2.042
Target Level: 2.007
Stop Loss: 2.066
RISK PROFILE
Risk level: medium
Suggested risk: 1%
Timeframe: 1D
Disclosure: I am part of Trade Nation's Influencer program and receive a monthly fee for using their TradingView charts in my analysis.
✅LIKE AND COMMENT MY IDEAS✅

EURUSD — Decline from Supply ZoneEURUSD pair, after testing the 1.1780–1.1820 supply zone, shows a clear sellers’ reaction and forms a descending channel. Volume profile confirms bearish pressure, indicating a potential continuation of the downward move. Key downside targets are located at 1.1610, 1.1557, and 1.1200. As long as the price remains below 1.1720, the short bias remains valid.
From the fundamental side, euro weakness is driven by dovish ECB comments and strong U.S. data, while the dollar index holds near local highs. This supports the continuation of the bearish scenario in the coming weeks.
Conclusion: bearish setup remains valid below 1.1720–1.1780, with targets 1.1550–1.1200.

Diamond Vault Setup: 5 Fundamental + 7 Technical Stacks in Full OANDA:USDCHF USDCHF — Diamond Vault Setup: 5 Fundamental + 7 Technical Stacks in Full Alignment
The USDCHF setup stands out as a Diamond Vault trade — where both Fundamental and Technical confluence align with precision.
We are stacked with the Big 5 Fundamentals: softening US inflation, dovish Fed commentary, firm Swiss GDP resilience, stabilizing risk sentiment, and ongoing safe-haven flows into the Franc.
On the Technical side, all 7 stacks are in play — price trading below every EMA, RSI under 45, a clearly negative MACD, and an ADX above 25 with strong −DI dominance, confirming sustained bearish pressure.
This alignment represents a rare high-probability setup where macro and momentum are synchronized.
A break below 0.79 could open the door toward 0.7750 with confirmation from continued divergence across momentum oscillators.
⚠️ Reminder: Even with full confluence, proper money management is key.
Position sizing should respect your ATR-based risk model — Stop Loss = 1.52×ATR, Take Profit = 2.6×Risk minimum.
Protect capital first, profits second.
Bias: 🔻 Extremely Bearish
Classification: 🟩 Diamond Vault (5 Fundamentals + 7 Technicals)
ADX: 17.39 (rising) | −DI dominance: confirmed
suggest SL 0.8033 TP 0.7748

EUR/JPY BEARS WILL DOMINATE THE MARKET|SHORT
EUR/JPY SIGNAL
Trade Direction: short
Entry Level: 176.253
Target Level: 174.219
Stop Loss: 177.596
RISK PROFILE
Risk level: medium
Suggested risk: 1%
Timeframe: 1D
Disclosure: I am part of Trade Nation's Influencer program and receive a monthly fee for using their TradingView charts in my analysis.
✅LIKE AND COMMENT MY IDEAS✅

USNAS100 – Overview | Bearish Pressure Below 24,855USNAS100 – Overview | Bearish Momentum Below 24,855
The index shows bearish momentum today as long as price trades below 24,855, after testing the resistance zone twice.
Failure to break higher keeps the pressure on the downside, with potential to drop toward 24,510 in the near term.
A 1H close above 24,855 would invalidate the bearish setup and trigger a strong bullish continuation toward the all-time-high (ATH) region near 25,035 → 25,200.
Pivot: 24,855
Support: 24,660 – 24,520 – 24,350
Resistance: 25,035 – 25,200 – 25,400

Gold Plan | Where will gold drop today?🔍 Market Context
Gold continues to maintain a short-term upward trend following a series of Break of Structure (BoS) , confirming active buying from lower zones.
Currently, the price is approaching the ATH GOLD zone and heading towards the Liquidity Sell Zone 4,281 USD – a densely liquid area where short-term sell reactions from major players may occur.
After a hot rise, technical correction risks are starting to increase. Lower zones like 4,186 – 4,152 – 4,130 USD will be potential “accumulation zones” for institutional buyers in the upcoming pullback.
💎 Technical Analysis
ATH GOLD: 4,275 – 4,280 USD
Liquidity Sell Zone: 4,281 – 4,285 USD → high liquidity resistance area, may trigger short-term reversal reactions.
Liquidity Zone $$$: 4,186 – 4,152 USD → crucial support area in the uptrend, where technical reactions are expected.
FVG – BoS Zone: 4,152 – 4,148 USD → “price balance” zone yet to be filled, likely to be retested.
OB Deep Zone: 4,130 – 4,120 USD → deep demand zone converging with Fibo 0.786 – ideal area for large capital to re-accumulate.
Overall structure remains bullish , but in the premium zone – an area where institutions typically distribute orders to gain liquidity before adjusting.
📈 Trading Scenarios
1️⃣ Main Scenario – Sell reaction at Liquidity Zone 4,281 USD
When the price hits the 4,275 – 4,281 USD zone and clear reversal signals appear (rejection candles, bearish engulfing, or minor structure break),
→ open short-term sell orders (scalp/intraday).
Target: 4,186 → 4,152 USD.
Stop Loss: above 4,285 USD.
➡️ This is a typical “liquidity sweep – technical reaction” scenario, capitalising on short-term sell-offs at high liquidity peaks.
2️⃣ Secondary Scenario – Buy back following the main trend after correction
When the price corrects to the 4,186 – 4,152 USD zone or deeper to OB Deep 4,130 USD ,
and clear upward confirmation signals appear (strong rejection or minor BoS increasing again),
→ open buy orders in line with the main trend.
Target: 4,230 → 4,275 USD.
Stop Loss: below 4,120 USD.
➡️ Trend-following scenario – waiting for price correction to discount zones to accumulate in line with the larger trend.
⚠️ Risk Management
Do not FOMO buy when the price is hitting the 4,275 – 4,281 USD zone.
Prioritise short-term sells with clear confirmations or buys at lower OB zones.
Keep light volume when trading against the main trend.
Observe reactions at the 4,186 zone – this is the key level of the day.
💬 Conclusion
Gold is at the peak of the current rise , short-term profit-taking pressure may appear around the 4,281 USD zone.
If strong reactions occur, a correction to the 4,186 – 4,152 USD zone is reasonable for market rebalancing.
The larger trend remains upward , so lower OB zones will be reasonable buy opportunities for the next wave.
👉 Reasonable Strategy:
Sell reaction at 4,281 USD when reversal signals appear.
Buy back at 4,186 – 4,152 – 4,130 USD when confirmation signals appear.

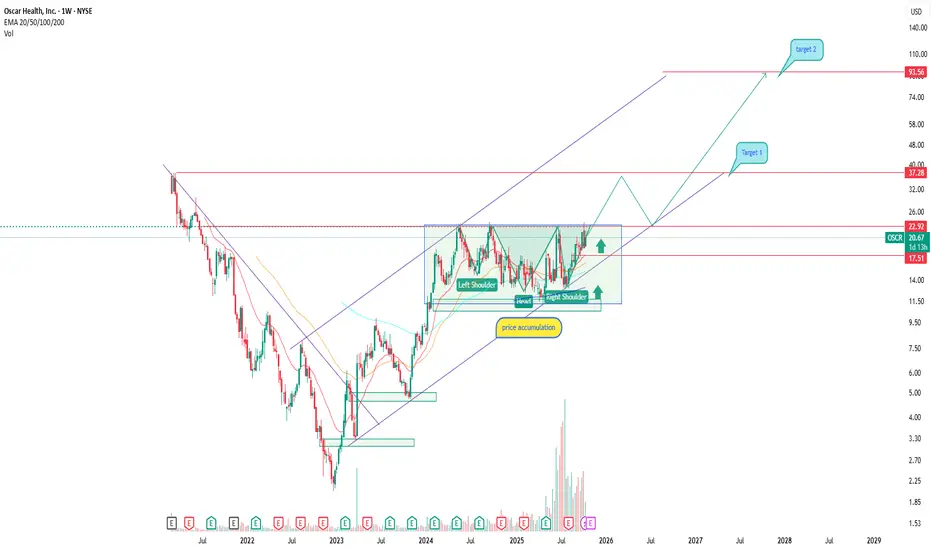
OSCR breakout from accumulation and start of a new trendOscar Health (NYSE: OSCR) is emerging as one of the more interesting names in the U.S. healthcare insurance sector. After an extended accumulation phase, the stock has broken out and is now trading above its major EMAs (50/100/200), confirming a structural shift toward a bullish trend.
The pattern resembles an inverse head and shoulders, with the 17.50–20.00 area acting as strong base support. A confirmed breakout above this zone sets the stage for a move toward 37.78 (Target 1) and potentially 93.55 (Target 2) — the upper boundary of the mid-term ascending channel.
Fundamentally, The company continues to grow its customer base and improve margins after strategic restructuring. Its shift toward tech-driven insurance solutions and partnerships with major healthcare providers strengthen its position. Recent earnings reports show narrowing losses and revenue stabilization — a sign of operational progress.
This looks like the early stage of a longer recovery cycle: the market is moving out of accumulation, but confirmation above 20.00–25.00 is crucial. As always — stay disciplined and trade by structure, not emotion.
XAUUSD: Profit-Taking Pressure Emerges XAUUSD: Profit-Taking Pressure Emerges - Trading Strategy as Gold Adjusts
Hello traders community,
Today's trading session witnessed a strong "Price Rejection" of XAUUSD at a new peak, triggering a nearly $20 decline. Although the long-term bullish structure remains intact, the profit-taking signals from buyers are clear. This article will delve into key price zones and outline a detailed trading strategy amidst the adjusting market.
📊 Technical Analysis
The H1 chart provides an overview of current liquidity zones and price structure:
Fibonacci Resistance Zone: The price reacted strongly at the confluence of the 2.618 Fibonacci Extension levels, around the $4240 area. A strong bearish candle appeared right after the price touched this zone, confirming it as an extremely potential "Sell zone." Sellers have officially entered the fray.
Point of Control (POC) and Liquidity: The Volume Profile (VPVR) indicator shows the largest trading volume concentration (POC) at $4196. This is the "magnet" zone attracting price in the short term. If the price recovers, this will be the decisive tug-of-war zone.
Key Support Zones:
$4196 (Buy Scalping): The POC zone acts as the first price support point. Scalpers can look for short-term buying opportunities here.
$4158 (Buy Zone): This is a firmer support zone, the bottom of the previous upward move, and also an area with significant trading volume. Buyers are likely to return strongly if the price adjusts here.
📰 Market Sentiment
Profit-Taking Pressure: After a hot growth streak, Gold's sharp nearly $20 decline is a healthy adjustment move. The selling force mainly comes from short-term profit-taking traders.
"Sharks" Still Accumulating: Notably, while the price adjusts, the world's largest gold ETF, SPDR Gold Trust, increased its gold holdings by 1.15 tons. This move shows that large institutions remain optimistic about Gold's long-term prospects and are taking advantage of the dip to accumulate more. This is a signal contrary to short-term price action, traders need to pay special attention.
🎯 Actionable Trading Plan
With the current technical signals and market sentiment, we prioritize the strategy of selling on recovery (Sell the Rally).
Scenario 1: Sell on Downtrend (Sell) 📉
Entry Zone: Wait for the price to recover to the $4228 area. This is the "retest" area of the liquidity zone previously controlled by sellers.
Stop Loss: $4235, above the nearest minor peak.
Take Profit: $4210 - $4188 - $4165 - $4133.
Scenario 2: Buy at Strong Support (Buy) 📈
Entry Zone: If the price continues to decline, look to buy at the "Buy zone" $4158.
Stop Loss: $4150, a safe level below the support zone.
Take Profit: $4173 - $4190 - $4205 - $4230.
Scenario 3: Short-Term Scalping (Scalping Buy) ⚡️
Entry Zone: Quick buy at the POC $4196.
Stop Loss: $4188, a short and tight stop loss.
Take Profit: $4210 - $4228.
Summary
In the short term, sellers temporarily dominate after Gold failed to conquer the $4240 resistance zone. The main strategy is to sell on recovery. However, SPDR's buying action indicates that the medium and long-term uptrend remains very solid. Therefore, buying orders at strong support zones like $4158 are also opportunities not to be missed.
Trade with discipline and manage your capital tightly. Wishing fellow traders an effective trading day!
Note: This analysis is based on personal views and is for reference purposes only, not direct investment advice.
