BTC (4h)- Take note of the Support and Resistance Zones outside the Fair Value Gaps (which serves as price magnets)
- When reaching the Support Area, the Liquidity Zone that were obsorbed could fuel a sharp bounce up towards the Fair Value Gap above before heading to the Resistance Area.
- I think the Resistance Area will be strong enough to form a lower high in the 4H timeframe and head back down creating a lower low.
Techincalanalysis

NZD/USD BULLISH BIAS RIGHT NOW| LONG
NZD/USD SIGNAL
Trade Direction: long
Entry Level: 0.572
Target Level: 0.596
Stop Loss: 0.555
RISK PROFILE
Risk level: medium
Suggested risk: 1%
Timeframe: 1D
Disclosure: I am part of Trade Nation's Influencer program and receive a monthly fee for using their TradingView charts in my analysis.
✅LIKE AND COMMENT MY IDEAS✅

GBP/USD BEST PLACE TO SELL FROM|SHORT
Hello, Friends!
It makes sense for us to go short on GBP/USD right now from the resistance line above with the target of 1.324 because of the confluence of the two strong factors which are the general downtrend on the previous 1W candle and the overbought situation on the lower TF determined by it’s proximity to the upper BB band.
Disclosure: I am part of Trade Nation's Influencer program and receive a monthly fee for using their TradingView charts in my analysis.
✅LIKE AND COMMENT MY IDEAS✅

EUR/USD BEARS ARE STRONG HERE|SHORT
Hello, Friends!
Previous week’s green candle means that for us the EUR/USD pair is in the uptrend. And the current movement leg was also up but the resistance line will be hit soon and upper BB band proximity will signal an overbought condition so we will go for a counter-trend short trade with the target being at 1.157.
Disclosure: I am part of Trade Nation's Influencer program and receive a monthly fee for using their TradingView charts in my analysis.
✅LIKE AND COMMENT MY IDEAS✅

ETH/USD Bearish Retracement from Daily FVG Zonea bearish retracement setup on Ethereum (ETH/USDT) in the daily timeframe. After a strong bearish impulse, the price entered a highlighted Daily Fair Value Gap (FVG) zone — a potential area of supply where sellers may regain control. The projection indicates a likely short-term pullback into the FVG before continuing downward toward Target 1 (≈ $3,601) and Target 2 (≈ $3,399).

USOIL LONG FROM SUPPORT
USOIL SIGNAL
Trade Direction: long
Entry Level: 58.07
Target Level: 63.04
Stop Loss: 54.76
RISK PROFILE
Risk level: medium
Suggested risk: 1%
Timeframe: 9h
Disclosure: I am part of Trade Nation's Influencer program and receive a monthly fee for using their TradingView charts in my analysis.
✅LIKE AND COMMENT MY IDEAS✅

AUD/CHF BULLS WILL DOMINATE THE MARKET|LONG
AUD/CHF SIGNAL
Trade Direction: long
Entry Level: 0.518
Target Level: 0.524
Stop Loss: 0.514
RISK PROFILE
Risk level: medium
Suggested risk: 1%
Timeframe: 4h
Disclosure: I am part of Trade Nation's Influencer program and receive a monthly fee for using their TradingView charts in my analysis.
✅LIKE AND COMMENT MY IDEAS✅

NZD/CHF SENDS CLEAR BULLISH SIGNALS|LONG
Hello, Friends!
NZD/CHF downtrend evident from the last 1W red candle makes longs trades more risky, but the current set-up targeting 0.460 area still presents a good opportunity for us to buy the pair because the support line is nearby and the BB lower band is close which indicates the oversold state of the NZD/CHF pair.
Disclosure: I am part of Trade Nation's Influencer program and receive a monthly fee for using their TradingView charts in my analysis.
✅LIKE AND COMMENT MY IDEAS✅

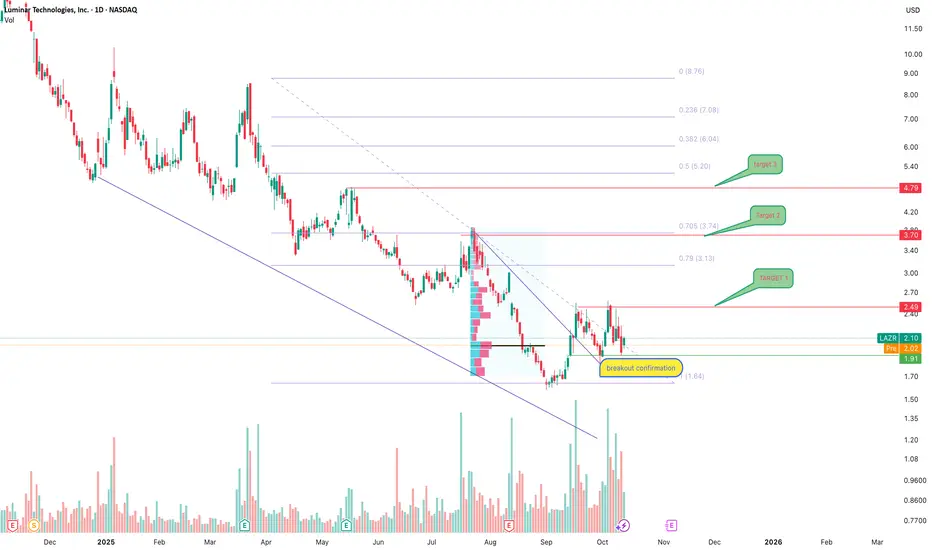
LAZR trend breakout and early recovery phaseLuminar Technologies (NASDAQ: LAZR) is showing the first signs of trend reversal after a prolonged decline. On the daily chart, the price broke the descending trendline and confirmed a breakout around the 1.90–2.00 zone, where accumulation started.
Technically, the 2.00–2.10 area acts as base support.
As long as the price stays above this level, the upside targets are 2.49 (TP1), 3.70 (TP2), and 4.79 (TP3) — all aligned with key Fibonacci levels. Rising volume supports the bullish bias.
From a fundamental perspective, Luminar remains a major player in the lidar industry, with partnerships including Volvo and Mercedes-Benz. Despite short-term pressure from higher rates, operational improvements and scaling could strengthen margins in the medium term.
This setup looks like an early recovery stage — the sentiment shifts slowly, but sustained support above 2.00 is the confirmation needed. Emotions aside — we wait for structure and confirmation.
LLong
XAUUSD – Liquidity Sweep “Dip”XAUUSD – Liquidity Sweep “Dip”; prioritize trading around key zones 🟡
Gold just dropped nearly 90 points during the Asian session—a time usually lacking volume, causing a “flush” that wiped out many leveraged positions. The major trend remains upward, but short-term risks of a deep pullback appear before the European–American markets engage.
The accompanying image shows:
Price peaked and then broke the upper edge of the H1 rising channel → quickly fell to the middle of the channel.
Thick Volume Profile cluster near 4.07x, POC ~4,075; below is VAL ~4,025.
Sell retest zone marked around 4.14x; gray boxes are buy zones 4,075 and 4,056.
Key Levels
Resistance: 4,143–4,150, 4,122, 4,160.
Support: 4,075 (POC), 4,056 (buy scalping), 4,025 (VAL).
Scalping watch: 4,057 – 4,085 – 4,160 – 4,025.
Trading Scenarios
SELL retest (reaction, higher risk)
Entry: 4,143
SL: 4,150
TP: 4,122 → 4,105 → 4,078 → 4,050
Idea: only trigger when there is a clear rejection at 4.14x (long wick/engulfing H1).
BUY around POC
Entry: 4,075
SL: 4,067
TP: 4,089 → 4,100 → 4,122 → 4,155
BUY scalping (shallow pullback)
Entry: 4,056
SL: 4,049–4,050
TP: 4,075 → 4,089
Invalidation: short-term buy bias weakens if H1 closes below ~4,025 (VAL). If this area breaks, prioritize waiting for a failed retest to consider selling along the continued decline.
Practical Notes
The range is very wide; the European session will increase volume, making false breaks likely.
After TP1, move SL to entry to secure the position.
Sell orders are only reactive trades at 4.14x; prioritize buy-the-dip at 4,075/4,056 when confirmation signals appear.

FET post liquidation double bottomAfter a brutal weekend, FET managed to recover and finish the week above the macro long treandline. This means the multi year bullish structure is still intact.
While doing this FET has also formed a double bottom on it's USDT pair, matching the price from the April 2025 low.
Technically this should be a very good sign for future price action. As long as the overall crypto bullmarket holds, FET should see some strong gains from this point on. The amount will depend on further news from the project and continuing interest in the AI-crypto sector.

SILVER SELLERS WILL DOMINATE THE MARKET|SHORT
SILVER SIGNAL
Trade Direction: short
Entry Level: 5,140.8
Target Level: 5,029.5
Stop Loss: 5,214.4
RISK PROFILE
Risk level: medium
Suggested risk: 1%
Timeframe: 1h
Disclosure: I am part of Trade Nation's Influencer program and receive a monthly fee for using their TradingView charts in my analysis.
✅LIKE AND COMMENT MY IDEAS✅

NZD/CAD BEST PLACE TO BUY FROM|LONG
Hello, Friends!
NZD/CAD pair is trading in a local downtrend which we know by looking at the previous 1W candle which is red. On the 12H timeframe the pair is going down too. The pair is oversold because the price is close to the lower band of the BB indicator. So we are looking to buy the pair with the lower BB line acting as support. The next target is 0.813 area.
Disclosure: I am part of Trade Nation's Influencer program and receive a monthly fee for using their TradingView charts in my analysis.
✅LIKE AND COMMENT MY IDEAS✅

AUD/CAD BULLS ARE STRONG HERE|LONG
Hello, Friends!
We are going long on the AUD/CAD with the target of 0.917 level, because the pair is oversold and will soon hit the support line below. We deduced the oversold condition from the price being near to the lower BB band. However, we should use low risk here because the 1W TF is red and gives us a counter-signal.
Disclosure: I am part of Trade Nation's Influencer program and receive a monthly fee for using their TradingView charts in my analysis.
✅LIKE AND COMMENT MY IDEAS✅

EUR/AUD BULLS ARE STRONG HERE|LONG
EUR/AUD SIGNAL
Trade Direction: long
Entry Level: 1.765
Target Level: 1.782
Stop Loss: 1.754
RISK PROFILE
Risk level: medium
Suggested risk: 1%
Timeframe: 9h
Disclosure: I am part of Trade Nation's Influencer program and receive a monthly fee for using their TradingView charts in my analysis.
✅LIKE AND COMMENT MY IDEAS✅

EUR/CHF BEARISH BIAS RIGHT NOW| SHORT
Hello, Friends!
EUR/CHF pair is in the downtrend because previous week’s candle is red, while the price is obviously rising on the 2H timeframe. And after the retest of the resistance line above I believe we will see a move down towards the target below at 0.931 because the pair is overbought due to its proximity to the upper BB band and a bearish correction is likely.
Disclosure: I am part of Trade Nation's Influencer program and receive a monthly fee for using their TradingView charts in my analysis.
✅LIKE AND COMMENT MY IDEAS✅

GBP/CHF SELLERS WILL DOMINATE THE MARKET|SHORT
Hello, Friends!
GBP/CHF is trending down which is evident from the red colour of the previous weekly candle. However, the price has locally surged into the overbought territory. Which can be told from its proximity to the BB upper band. Which presents a beautiful trend following opportunity for a short trade from the resistance line above towards the demand level of 1.069.
Disclosure: I am part of Trade Nation's Influencer program and receive a monthly fee for using their TradingView charts in my analysis.
✅LIKE AND COMMENT MY IDEAS✅

GBP/AUD BULLS ARE GAINING STRENGTH|LONG
GBP/AUD SIGNAL
Trade Direction: long
Entry Level: 2.027
Target Level: 2.033
Stop Loss: 2.022
RISK PROFILE
Risk level: medium
Suggested risk: 1%
Timeframe: 6h
Disclosure: I am part of Trade Nation's Influencer program and receive a monthly fee for using their TradingView charts in my analysis.
✅LIKE AND COMMENT MY IDEAS✅

GBP/JPY BUYERS WILL DOMINATE THE MARKET|LONG
Hello, Friends!
Bullish trend on GBP/JPY, defined by the green colour of the last week candle combined with the fact the pair is oversold based on the BB lower band proximity, makes me expect a bullish rebound from the support line below and a retest of the local target above at 202.880.
Disclosure: I am part of Trade Nation's Influencer program and receive a monthly fee for using their TradingView charts in my analysis.
✅LIKE AND COMMENT MY IDEAS✅

LiamTrading – GOLD: Continuing the trend towards 4,130Gold has broken 4,060 and set a new historical high thanks to US-China trade tensions and expectations of an early Fed rate cut. The main trend remains upward; the next target level according to the channel structure is 4,130.
Technical H4→H1
The upward channel has been maintained for weeks; breaking 4,060 confirms continuation.
Nearest liquidity zone: 4,030–4,032.
Medium-term volume POC: ~3,988.
Target/resistance cluster by rhythm: 4,050 → 4,072 → 4,088 → 4,100 → 4,130.
Trading Plan
Buy 1 (retracement to liquidity zone)
Entry: 4,030–4,032
SL: 4,025
TP: 4,050 → 4,072 → 4,088 → 4,100 → 4,130
Buy 2 (medium-term POC)
Entry: 3,988
SL: 3,980
TP: 4,022 → 4,050 → 4,088 → 4,100 → 4,130
Reactive Sell (higher risk)
Entry: 4,130
SL: 4,140
TP: flexible according to price reaction; prioritize closing at 4,070 if a clear rejection candle appears.
Invalidation: short-term upward structure weakens if H1 closes below 3,980.
Quick Notes
Prioritize “buy-the-dip” at 4,03x and 3,988; sell orders are only reactive trades at 4,130.
When TP1 is reached, move SL to entry to protect the position.
Volatility around US data release time may create false breaks; maintain risk management discipline.
I will provide real-time updates when price paths change, as real-time trading is the best way to be accurate and successful.

Gold |US–China Tensions Ease, Gold Eyes a New Breakout Above ATH🌍 Macro Overview: Cooling US–China Tensions
Geopolitical pressure between the US and China appears to be easing after China’s Ministry of Commerce clarified that export controls on rare earth materials do not mean an export ban — a clear attempt to reopen constructive dialogue with Washington.
Meanwhile, US Vice President JD Vance signaled a softer stance toward Beijing, stating:
“We highly value the friendship between President Trump and President Xi Jinping.”
“President Trump hopes the US won’t need to use leverage against China.”
“President Trump is ready for a fair and reasonable negotiation with Beijing.”
➡️ These remarks suggest a temporary de-escalation in geopolitical risks, improving overall risk sentiment and prompting investors to shift focus back to technical structures and liquidity zones on gold.
💎 Technical Outlook (XAU/USD H1)
After a sharp drop from its All-Time High (ATH), gold found strong support at the 3975–3985 Support Zone, coinciding with a Change of Character (ChoCh) reversal area.
Price has since established an ascending channel, moving back toward the upper liquidity zone (4020–4030) — a critical area where short-term profit-taking may occur before another leg higher.
⚙️ Key Technical Levels
Liquidity Zone $$$ (4020–4030): Short-term resistance; potential pullback zone.
Liquidity Zone $$$ (3990–4005): Key demand area where buy orders are likely stacked.
Breakout Support: 4008 — now acting as near-term structure support.
ATH Zone: 4045–4050 — key upside target; a confirmed breakout could open room toward 4100.
📈 Trade Scenarios
Primary Scenario (Buy on Dip):
Look for price to retest the 3995–4005 liquidity zone for long entries.
Target: 4025 → 4050.
Stop loss: below 3980.
Extended Bullish Scenario:
If price holds above 4050, the next expansion target lies at 4080–4100.
⚠️ Risk Notes
The US–China diplomatic tone remains fragile; sudden rhetoric shifts could trigger volatility.
Wait for a confirmed H1 close above 4025 to validate bullish continuation before scaling in.
🧭 Summary
The easing in US–China tensions has reduced safe-haven demand for gold in the short term, but technical momentum still favors the bulls.
As long as the 4000 psychological level holds firm, XAU/USD is well-positioned to retest and potentially break above the 4050 ATH zone, targeting 4100+ in the coming sessions.

GOLD: Risk of ABC Correction Wave, Short-term Sell at 4028LiamTrading – GOLD: Risk of ABC Correction Wave, Short-term Sell at 4028
Hello traders,
Gold has had an impressive growth week, but as prices hit new highs, the risk of correction always increases. Let's examine this week's Gold scenario based on wave analysis and market liquidity.
📊 Technical Analysis (Chart H4 – XAUUSD)
Based on the H4 chart, Gold (GOLD) seems to have completed the Push Wave 5 (Elliott Wave 5) in the current uptrend cycle, reaching strong resistance around 4050–4060.
Current Structure:
The price is within a sustainable Uptrend Channel.
The 4050–4060 range is a significant resistance where selling pressure may emerge.
An ABC correction wave scenario appears after completing Wave 5.
Key Liquidity Zones:
Potential Resistance Zone (Sell Wave C): Around 4028–4033 (Price area to watch for the reaction of the final Wave C).
Confirmed Drop Support Zone: 3972 (Critical price area confirming if selling pressure is strong enough).
Attractive Buy Zone: 3976 (Temporary liquidity if price corrects, waiting for Breakout confirmation).
Long-term Buy Zone (POC Buy): ~3850 (Price area with a huge Volume Profile, ideal for long-term buy orders).
🎯 New Week Trading Scenario
📉 Short-term Sell
This scenario is based on the expectation of an ABC correction wave starting from the resistance zone.
📍 Entry: 4033
🛑 SL: 4040 (Very tight SL, suitable for short-term Sell strategy at the wave peak)
🎯 TP: 3976 → 3943 → POC (~3850)
📈 Long-term Buy
This setup waits for a correction to lower liquidity zones to enter Buy orders with optimal R:R ratio.
📍 Entry: 3976 (Temporary liquidity buy zone)
🛑 SL: 3970
🎯 TP: 4040 → 4090 → 4150
🛑 Failure Scenario (Wait for Breakout Confirmation)
If the price breaks the 4060 peak and creates a new ATH (All-Time High), the ABC wave scenario will fail.
Action: Continue to prioritize Buying. The best entry is to wait for the price to retest the broken liquidity zone (Breakout Retest) around 3976.
🧭 Fundamental & Long-term Analysis
Macroeconomic Sentiment: The Royal Bank of Canada (RBC) forecasts Gold to rise to $4,500 in the next two years, bolstered by long-term inflation concerns. This confirms the long-term uptrend of Gold remains intact.
US Dollar Impact (USD): The traditional view is that USD rises as investors seek liquidity during market stress. However, Gold's rise alongside USD shows the market prioritizes gold as an inflation hedge rather than just a safe haven.
Long-term Strategy: The buy zone at POC (~3850) according to Volume Profile is extremely suitable. Large liquidity here will help traders enter optimal orders and hold long-term, leveraging the pressure from the Seller's Liquidity to push prices up.
📌 Conclusion
Gold is at a critical crossroads. Although the long-term trend is up, the short-term correction risk (ABC Wave) at the 4028–4033 zone is very high.
Priority: Watch for short-term sells at the resistance zone with a tight SL.
Safe strategy: Wait to Buy at liquidity support zones like 3976 or POC (~3850) to optimize risk/reward (R:R).
I will continue to update Gold scenarios daily with insights from 8 years of trading experience.
👉 Follow me to not miss important updates!

USOIL LONG FROM SUPPORT
USOIL SIGNAL
Trade Direction: long
Entry Level: 58.26
Target Level: 60.45
Stop Loss: 56.80
RISK PROFILE
Risk level: medium
Suggested risk: 1%
Timeframe: 1h
Disclosure: I am part of Trade Nation's Influencer program and receive a monthly fee for using their TradingView charts in my analysis.
✅LIKE AND COMMENT MY IDEAS✅
