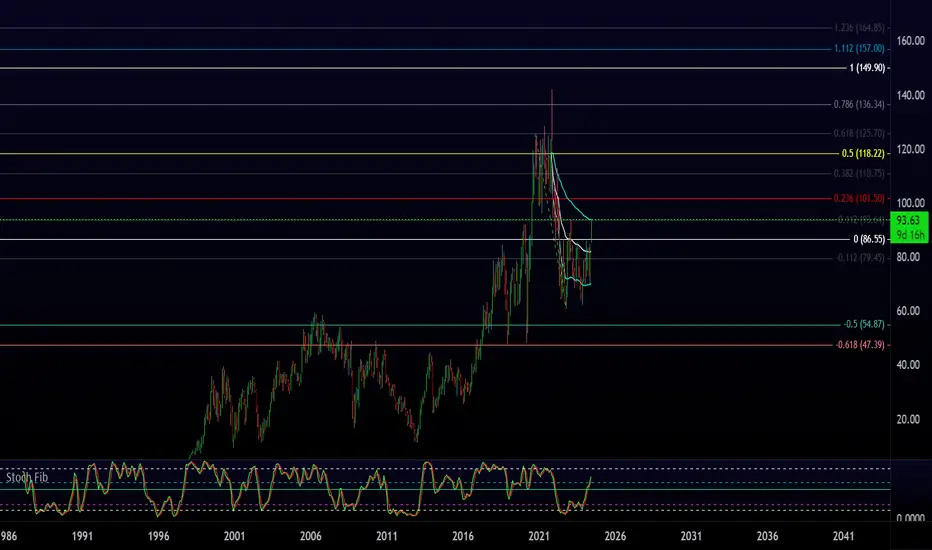
BBY Best Buy= Best ShortShort from pattern.
Short on 85,50
SL 88,26
TP 74 (50%) , 70 (50%)
P/L = 1/4
Not financial recomendation.
Do on your own risk.
Next report date
—
Report period
—
EPS estimate
—
Revenue estimate
—
5.73USD
1.24 BUSD
43.45 BUSD
196.50 M
About Best Buy Co., Inc.
Sector
Industry
CEO
Corie Sue Barry
Website
Headquarters
Richfield
Employees (FY)
85 K
Founded
1966
FIGI
BBG000BCWCG1
Best Buy Co., Inc. engages in the provision of consumer technology products and services. It operates through two business segments: Domestic and International. The Domestic segment includes operations in all states, districts, and territories of the U.S., operating under various brand names, including Best Buy, Best Buy Mobile, Geek Squad, Magnolia Audio Video, Napster, and Pacific Sales. The International segment is made up of all operations outside the U.S. and its territories, including Canada, Europe, China, Mexico, and Turkey. It also markets its products under the brand names: Best Buy, bestbuy.com, Best Buy Direct, Best Buy Express, Best Buy Mobile, Geek Squad, GreatCall, Magnolia and Pacific Kitchen and Home. The company was founded by Richard M. Schulze in 1966 and is headquartered in Richfield, MN.

When to buy BBYBest Buy (BBY) has just broken out of the base it established back in November 2022. The reaction to the most recent earnings is strong and yesterday June 4th 2024, BBY hit the same high from February 2023.
Idea 1: It can blow through this line top line and continue its climb. If this is the case,

best buy potential longyou know ive been seeing chatter about this ticker more than usual. I know best buy is a consolidation nightmare but i see a trade. Break and entry would be 101. The anchored vwap shows a switch of trend and it can be used to ensure momentum is ensuing and the trade is going well. Also eventually th
BBY shortI am bearish for BBY as I see potential bearish pattern here and multiple top. I expect to fall down for BBY

Best Buy Breakout?Best Buy has moved sideways since December, but some traders may expect a breakout soon.
The first pattern on today’s chart is the pair of falling trendlines. One ran along the highs of July and December, which BBY crossed in late February. A second along the March highs was broken this week. That

BBY | Time to Ride Higher | LONGBest Buy Co., Inc. engages in the provision of consumer technology products and services. It operates through two business segments: Domestic and International. The Domestic segment includes operations in all states, districts, and territories of the U.S., operating under various brand names, includ

$BBY Gameplan Dec 4 ! NYSE:BBY Long above 73.49 , Short Below 72.92! - Continuation play Day 2 on Upbeat Retail Sales! Let's See! @everyone
Here's a breakdown of the expectations and my analysis for Best Buy Co Inc ( NYSE:BBY ) for the upcoming trading day on Monday, the 4th:
Opening Price: Expected to open at $72.57.

BBY Best Buy Options Ahead of EarningsIf you haven`t bought BBY here:
Then analyzing the options chain and the chart patterns of RUM Rumble prior to the earnings report this week,
I would consider purchasing the 70usd strike price Calls with
an expiration date of 2024-1-19,
for a premium of approximately $2.72.
If these options prove

BBY daily analysis1.5 year side way range
Support 62
Resistance 86
Break of S means 49
Break of R means 106
Price below POC

BestBuy play the bounceHi traders
Let's have a lookg at BBY
BestBuy looks interesting
The price reached the buy area and we are seeing a reaction.
The stock is still in a downtrend but entering a long position at the key support and playing a bounce towards the downsloping resistance is reasonable idea.
What do you thi

See all ideas
An aggregate view of professional's ratings.
Trade directly on the supercharts through our supported, fully-verified and user-reviewed brokers.


Curated watchlists where BBY is featured.


Frequently Asked Questions
The current price of BBY is 87.35 USD — it hasn't changed in the past 24 hours. Watch Best Buy Co., Inc. stock price performance more closely on the chart.
Depending on the exchange, the stock ticker may vary. For instance, on NYSE exchange Best Buy Co., Inc. stocks are traded under the ticker BBY.
BBY stock has fallen by 1.02% compared to the previous week, the month change is a 1.29% rise, over the last year Best Buy Co., Inc. has showed a 3.19% increase.
We've gathered analysts' opinions on Best Buy Co., Inc. future price: according to them, BBY price has a max estimate of 106.00 USD and a min estimate of 64.00 USD. Watch BBY chart and read a more detailed Best Buy Co., Inc. stock forecast: see what analysts think of Best Buy Co., Inc. and suggest that you do with its stocks.
BBY stock is 2.21% volatile and has beta coefficient of 0.80. Track Best Buy Co., Inc. stock price on the chart and check out the list of the most volatile stocks — is Best Buy Co., Inc. there?
Today Best Buy Co., Inc. has the market capitalization of 18.84 B, it has decreased by 0.24% over the last week.
Yes, you can track Best Buy Co., Inc. financials in yearly and quarterly reports right on TradingView.
Best Buy Co., Inc. is going to release the next earnings report on Aug 27, 2024. Keep track of upcoming events with our Earnings Calendar.
BBY earnings for the last quarter are 1.20 USD per share, whereas the estimation was 1.07 USD resulting in a 11.65% surprise. The estimated earnings for the next quarter are 1.17 USD per share. See more details about Best Buy Co., Inc. earnings.
Best Buy Co., Inc. revenue for the last quarter amounts to 8.85 B USD, despite the estimated figure of 8.96 B USD. In the next quarter, revenue is expected to reach 9.25 B USD.
BBY net income for the last quarter is 246.00 M USD, while the quarter before that showed 460.00 M USD of net income which accounts for −46.52% change. Track more Best Buy Co., Inc. financial stats to get the full picture.
Yes, BBY dividends are paid quarterly. The last dividend per share was 0.94 USD. As of today, Dividend Yield (TTM)% is 4.26%. Tracking Best Buy Co., Inc. dividends might help you take more informed decisions.
Best Buy Co., Inc. dividend yield was 4.86% in 2023, and payout ratio reached 64.79%. The year before the numbers were 4.13% and 55.99% correspondingly. See high-dividend stocks and find more opportunities for your portfolio.
As of Jul 27, 2024, the company has 85.00 K employees. See our rating of the largest employees — is Best Buy Co., Inc. on this list?
EBITDA measures a company's operating performance, its growth signifies an improvement in the efficiency of a company. Best Buy Co., Inc. EBITDA is 2.66 B USD, and current EBITDA margin is 6.07%. See more stats in Best Buy Co., Inc. financial statements.
Like other stocks, BBY shares are traded on stock exchanges, e.g. Nasdaq, Nyse, Euronext, and the easiest way to buy them is through an online stock broker. To do this, you need to open an account and follow a broker's procedures, then start trading. You can trade Best Buy Co., Inc. stock right from TradingView charts — choose your broker and connect to your account.
Investing in stocks requires a comprehensive research: you should carefully study all the available data, e.g. company's financials, related news, and its technical analysis. So Best Buy Co., Inc. technincal analysis shows the buy rating today, and its 1 week rating is buy. Since market conditions are prone to changes, it's worth looking a bit further into the future — according to the 1 month rating Best Buy Co., Inc. stock shows the buy signal. See more of Best Buy Co., Inc. technicals for a more comprehensive analysis.
If you're still not sure, try looking for inspiration in our curated watchlists.
If you're still not sure, try looking for inspiration in our curated watchlists.