USD/CAD BEARS ARE GAINING STRENGTH|SHORT
USD/CAD SIGNAL
Trade Direction: short
Entry Level: 1.376
Target Level: 1.373
Stop Loss: 1.379
RISK PROFILE
Risk level: medium
Suggested risk: 1%
Timeframe: 1h
Disclosure: I am part of Trade Nation's Influencer program and receive a monthly fee for using their TradingView charts in my analysis.
✅LIKE AND COMMENT MY IDEAS✅
Techincalanalysis

Rising Wedge already done! Time to BUY BTC ?The Rising Wedge pattern has reached its target at 80% completion. The decline has actually touched the white shaded area marked as "exp stronger demand area 2," although the decline in this zone was relatively rapid and short-lived. Overall, I believe the downward trend in this Rising Wedge is likely limited. Even if a decline does occur, the swing low might open the opportunity for a double bottom pole position, triggering a stronger rally.
On the other hand, take a look at the RSI I marked! In previous periods, it was clear that every time the price began to saturate or become oversold, the RSI would cross over the moving averages, indicating a gradual price increase. This wasn't just one example, but also several other examples in the past.
Now, check the arrow marked on the current RSI and the current price. The RSI is starting to show signs of an impending crossover with the yellow moving average. Although the crossover hasn't officially occurred, it may be the first sign needed for the gradual start of an upward phase. Of course, the assumption of the white area as an alternative demand area is considered in the 73,624-80,277 zone, or the current area in the yellow shaded zone, around 86,491-92,829. As a safety measure, a stop-loss should be placed below the 69,666 support level, which previously served as resistance for the Cup & Handle pattern.
Caution!
Given that BTC is considered a risky asset, it is important to ensure a conducive environment for risk assets to rise, such as economic stability, expectations of interest rate cuts, or calm geopolitics. Otherwise, the bullish scenario is likely to fail!

XAUUSD (H1) – Inverse Head & Shoulders in play Lana focuses on pullback buys above key liquidity 💛
Quick overview
Timeframe: H1
Pattern: Inverse Head & Shoulders confirmed on the chart
Bias: Bullish continuation while price holds above neckline
Strategy: Buy pullbacks into liquidity zones, avoid chasing highs
Technical view – Inverse Head & Shoulders
On H1, gold has completed a clean Inverse Head & Shoulders structure:
Left shoulder: Formed after the first sharp sell-off
Head: Deeper liquidity sweep, followed by strong rejection
Right shoulder: Higher low, showing weakening selling pressure
Neckline: Around the 4030–4040 resistance zone (now being tested)
The recent breakout and strong follow-through suggest buyers have regained control. As long as price holds above the neckline, the structure favors continuation to the upside.
Key levels Lana is watching
Primary buy zone – Pullback entry
Buy: 4363 – 4367
This area aligns with prior structure support and sits inside a healthy pullback zone. If price revisits and shows acceptance, it offers a good risk-to-reward buy.
Liquidity risk zone – Deeper pullback
Liquidity risk: 4333 – 4349
If volatility increases and price sweeps deeper liquidity, this zone becomes the secondary area to watch for bullish absorption.
Upside targets & resistance
High liquidity area: 4512 – 4517
ATH zone: Above the previous all-time high
These zones are expected to attract profit-taking or short-term reactions, so Lana avoids chasing price near these levels.
Fundamental context (market drivers)
Geopolitics: Rising tension after comments about potential military intervention in Colombia adds background support for gold as a safe haven.
Goldman Sachs: Views Venezuela-related developments as having limited impact on oil, keeping broader commodity sentiment stable.
ISM Manufacturing PMI (US): Any sign of slowing manufacturing can pressure USD and indirectly support gold.
Overall, fundamentals remain supportive for gold, reinforcing the bullish technical structure.
Trading plan (Lana’s approach)
Prefer buying pullbacks into 4363–4367 while structure holds.
Be patient if price dips into 4333–4349 and wait for confirmation before entering.
If price falls back below the neckline and fails to reclaim it, Lana steps aside and reassesses.
This is Lana’s personal market view and not financial advice. Please manage your own risk before trading. 💛

ETH/USD SELLERS WILL DOMINATE THE MARKET|SHORT
ETHUSD SIGNAL
Trade Direction: short
Entry Level: 3,117.28
Target Level: 3,026.44
Stop Loss: 3,177.72
RISK PROFILE
Risk level: medium
Suggested risk: 1%
Timeframe: 1h
Disclosure: I am part of Trade Nation's Influencer program and receive a monthly fee for using their TradingView charts in my analysis.
✅LIKE AND COMMENT MY IDEAS✅

EUR/JPY BEARISH BIAS RIGHT NOW| SHORT
Hello, Friends!
Previous week’s green candle means that for us the EUR/JPY pair is in the uptrend. And the current movement leg was also up but the resistance line will be hit soon and upper BB band proximity will signal an overbought condition so we will go for a counter-trend short trade with the target being at 182.002.
Disclosure: I am part of Trade Nation's Influencer program and receive a monthly fee for using their TradingView charts in my analysis.
✅LIKE AND COMMENT MY IDEAS✅

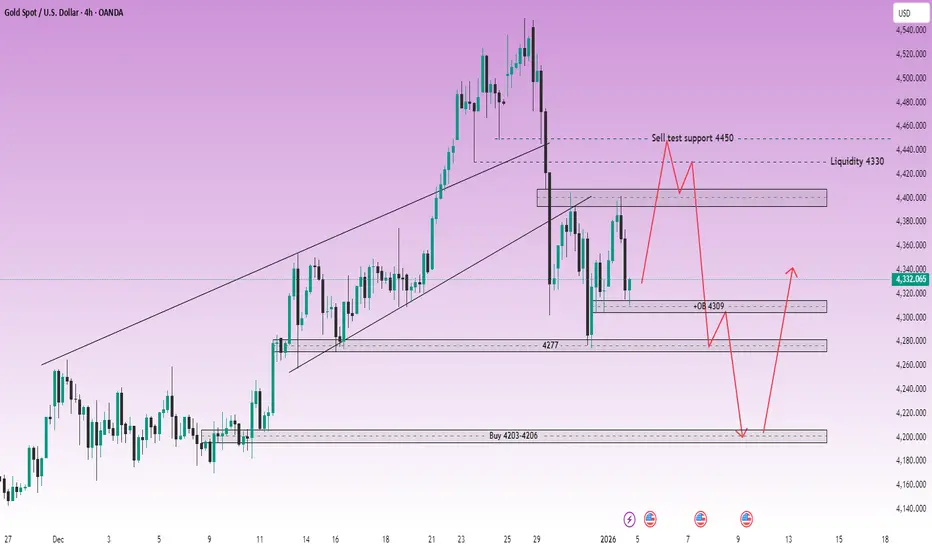
XAUUSD (H4) – Monday SetupGeopolitical shock risk, gold may spike | Trade liquidity and reaction zones only
Quick summary
News around Trump’s claim that Maduro has been detained, plus Venezuela’s response (they don’t know his and his wife’s whereabouts and are demanding proof of life), raises geopolitical uncertainty sharply. For gold, that’s a classic catalyst for a gap/spike at Monday open.
So my rule for Monday: no FOMO, only trade liquidity zones and confirmed reactions on the chart.
1) Macro context: Why gold can surge on Monday
Rising geopolitical tension often drives flows into safe-haven assets like gold.
When facts are unclear and tensions escalate, the market can open with:
✅ sharp spikes, ✅ liquidity sweeps, ✅ wider spreads.
➡️ Best approach: wait for price to hit levels, then trade the reaction — not the headline.
2) Technical view (H4 – based on your chart)
Gold is currently moving inside a larger structure after a heavy move, and your chart highlights the key zones clearly:
Key zones
Sell test support 4450 (pullback area where price may get sold)
Liquidity 4330 (major liquidity magnet)
OB 4309 (order block / short-term reaction zone)
Support 4277 (intermediate support)
Buy zone 4203–4206 (deep support / swing buy area)
3) Monday trading scenarios (Liam style: trade the level)
Scenario A (priority): Spike up → SELL around 4450
✅ If gold pumps on the headline at the open:
Sell around 4450 (sell-test zone)
SL: above the most recent swing high (refine on lower TF)
TP1: 4330
TP2: 4309
TP3: 4277
Logic: Headline-driven opens often spike to sweep buy-side liquidity first, then rotate back into value/liquidity.
Scenario B: Sweep down → BUY at liquidity zones
✅ If price gets pulled down first:
Buy around 4330 (Liquidity)
Buy confirmation at 4309 (OB)
SL (guide): below 4300
TP: 4380 → 4450 (scale out)
Logic: 4330 is a major liquidity magnet and often produces a sharp reaction bounce.
Scenario C (worst-case dump): BUY the deep support 4203–4206
✅ If volatility is extreme and price flushes:
Buy: 4203 – 4206
SL: 4195
TP: 4277 → 4330
Logic: This is a deep swing-buy area if the market does a hard liquidity reset.
4) Key notes for a headline-driven Monday open
Avoid trading the first 5–10 minutes if spreads widen.
Only enter once price hits the level and shows a clear reaction (rejection / engulf / MSS on M15).
Reduce size — geopolitical opens can whip hard.
Do you think Monday’s move sweeps up into 4450 first, or drops straight into 4330 liquidity?
XAUUSD D1 – Liquidity Rotation in a Bullish ChannelLiquidity Rotation Inside a Strong Bullish Channel
Gold remains in a clear long-term uptrend on the daily timeframe, trading inside a well-defined ascending channel. Recent volatility, however, suggests the market is entering a liquidity-driven correction phase rather than a trend reversal.
TECHNICAL STRUCTURE
On D1, price is still respecting the rising channel, with higher highs and higher lows intact.
The rejection from the upper channel highlights profit-taking and sell-side liquidity absorption near premium levels.
Current price action suggests a rotation between upper liquidity (distribution) and lower value zones (accumulation).
KEY LIQUIDITY ZONES TO WATCH
Sell-side liquidity (premium zone):
4480 – 4485
This area represents a strong liquidity cluster near the upper channel and prior expansion highs, where price has shown clear rejection.
Buy-side liquidity (value zones):
4180 – 4185
A psychological level and mid-channel support where buyers may re-enter if price rotates lower.
4000 – 4005
Major long-term liquidity and Fibonacci confluence near the lower channel boundary, acting as a key structural support.
EXPECTED PRICE BEHAVIOUR
Short term: price may continue to fluctuate and rebalance between liquidity pools, with choppy conditions likely.
Medium term: as long as price holds above the lower channel, pullbacks are considered corrective within the broader bullish trend.
A clean rejection from sell liquidity followed by a move into buy liquidity would be a healthy reset for continuation later.
FUNDAMENTAL & GEOPOLITICAL BACKDROP
Geopolitical risk has sharply increased after former President Trump announced a large-scale US operation against Venezuela, including the arrest of President Maduro.
This event adds a new layer of uncertainty to global markets and reinforces safe-haven demand.
Historically, rising geopolitical tensions, combined with a softer US dollar environment, tend to support gold prices, especially on higher timeframes.
BIG PICTURE VIEW
Gold’s long-term bullish narrative remains intact
Current moves are driven by liquidity rotation, not weakness
Geopolitical risk could accelerate upside once the corrective phase completes
Patience remains key. Let price move between liquidity zones before committing to the next directional leg.

BITCOIN BEST PLACE TO SELL FROM|SHORT
BITCOIN SIGNAL
Trade Direction: short
Entry Level: 89,775.17
Target Level: 88,820.23
Stop Loss: 90,412.01
RISK PROFILE
Risk level: medium
Suggested risk: 1%
Timeframe: 1h
Disclosure: I am part of Trade Nation's Influencer program and receive a monthly fee for using their TradingView charts in my analysis.
✅LIKE AND COMMENT MY IDEAS✅

USD/CHF BEARS ARE STRONG HERE|SHORT
Hello, Friends!
USD/CHF is trending down which is clear from the red colour of the previous weekly candle. However, the price has locally surged into the overbought territory. Which can be told from its proximity to the BB upper band. Which presents a classical trend following opportunity for a short trade from the resistance line above towards the demand level of 0.784.
Disclosure: I am part of Trade Nation's Influencer program and receive a monthly fee for using their TradingView charts in my analysis.
✅LIKE AND COMMENT MY IDEAS✅

USD/JPY SHORT FROM RESISTANCE
Hello, Friends!
USD/JPY pair is in the uptrend because previous week’s candle is green, while the price is clearly rising on the 4H timeframe. And after the retest of the resistance line above I believe we will see a move down towards the target below at 155.701 because the pair overbought due to its proximity to the upper BB band and a bearish correction is likely.
Disclosure: I am part of Trade Nation's Influencer program and receive a monthly fee for using their TradingView charts in my analysis.
✅LIKE AND COMMENT MY IDEAS✅

ETH/USD BEARS ARE GAINING STRENGTH|SHORT
ETHUSD SIGNAL
Trade Direction: short
Entry Level: 3,030.23
Target Level: 2,957.15
Stop Loss: 3,078.86
RISK PROFILE
Risk level: medium
Suggested risk: 1%
Timeframe: 1h
Disclosure: I am part of Trade Nation's Influencer program and receive a monthly fee for using their TradingView charts in my analysis.
✅LIKE AND COMMENT MY IDEAS✅

BITCOIN BULLS WILL DOMINATE THE MARKET|LONG
BITCOIN SIGNAL
Trade Direction: long
Entry Level: 87,599.76
Target Level: 90,106.43
Stop Loss: 85,916.50
RISK PROFILE
Risk level: medium
Suggested risk: 1%
Timeframe: 1h
Disclosure: I am part of Trade Nation's Influencer program and receive a monthly fee for using their TradingView charts in my analysis.
✅LIKE AND COMMENT MY IDEAS✅

XAUUSD (D1) – Elliott ABC in play Lana sells the pullback, waits to buy at major liquidity 💛
Quick summary
Timeframe: Daily (D1)
Elliott view: Price is likely developing an ABC corrective structure after a strong rally
Strategy: Sell the B-wave pullback into supply, buy only when price returns to strong liquidity
Context: Precious metals started 2026 strong, but short-term volatility and re-accumulation swings are still expected
Fundamental backdrop (supports the bigger trend)
Gold and silver opened 2026 with strong momentum, extending the best run since the late 1970s. Goldman Sachs remains bullish on precious metals and continues to highlight an aggressive long-term target (around $4,900 for gold).
Lana’s key point: the long-term bull cycle can remain intact, but the market still needs healthy corrections to reset liquidity and build new structure.
Technical view (D1) – Elliott ABC structure
On the Daily chart, after the powerful top, gold dropped sharply, forming a clean Wave A. The current structure suggests:
Wave B: a corrective rebound into resistance/supply
Wave C: a potential move back down into liquidity zones before the next major direction is confirmed
This ABC lens helps avoid getting trapped when the news looks bullish, but price is still in a corrective phase.
Key levels from the chart
1) Sell zone (B-wave supply)
Sell: 4435 – 4440
This zone aligns with marked resistance and a Fibonacci pullback cluster (0.236 / 0.382). If price retraces here and shows rejection, it’s a strong area to look for B-wave selling pressure.
2) Buy zone (major liquidity – potential C-wave completion)
Buy Liquidity: 4196 – 4200
This is the strongest liquidity area on the chart. If Wave C plays out, Lana will look for buying opportunities here with clearer risk control.
3) Deeper accumulation liquidity
Accumulate liquidity: the lower accumulation area highlighted on the chart
If the market sweeps deeper than expected, this is the region where longer-term buyers may step in.
Trading plan (Lana’s approach)
Primary idea: Sell rallies into 4435–4440 if price shows weakness (B-wave rejection).
Primary buy plan: Wait for price to revisit 4196–4200 and confirm support (liquidity absorption).
If price breaks and holds above the sell zone, Lana stops selling and waits for a new structure to form.
Note on early-year behavior
The first weeks of the year often bring “messy” moves as liquidity returns and positioning resets. Lana will only trade at planned zones and avoid entries in the middle of the range.
This is Lana’s personal market view and not financial advice

XRP | FVG Retrace Then Consolidation Before Breakout
Executive Summary
XRP is trading at $2.02 within an ascending triangle on the 4H timeframe. After reclaiming the psychological $2 level, price faces resistance at $2.02-$2.12. Expecting a short-term bearish move into the FVG (Fair Value Gap) at $1.75-$1.80, followed by consolidation, then a breakout either up or down.
BIAS: NEUTRAL - Bearish Short-Term, Then Consolidation, Then Breakout
Current Market Data
Current: $2.0231 (+0.85%)
Day's Range: $2.0059 - $2.0385
52-Week: $1.6106 - $3.6662
Market Cap: $122.74B
ETF Holdings: $1.16B+ (24 consecutive days of inflows)
Performance:
1W: +9.82% | 1M: -7.96% | 3M: -31.88%
6M: -10.94% | YTD: +9.99% | 1Y: -15.73%
Key News
XRP spot ETFs hold $1.16B+ with $1.4B total inflows
Ripple unlocked 1B XRP on Jan 1 (monthly escrow) - supply pressure
JPMorgan GTreasury integration on XRP Ledger
CLARITY Act markup scheduled for January 2026
$2 zone has rejected XRP since 2017 - major resistance
Technical Structure - 4H
Ascending Triangle:
Rising support trendline - higher lows
Horizontal resistance at $2.00-$2.02
Upper resistance at $2.12
FVG filled on left, was resistance, then broken
FVG Zone:
$1.75-$1.80 - Unfilled gap / liquidity sweep zone
Expect retrace here before consolidation
Ideal long entry if bounce confirms
Key Levels:
Resistance:
$2.00 - $2.02 - Horizontal resistance
$2.12 - Upper resistance (breakout level)
$2.20 - $2.50 - Bullish targets
Support:
$1.88 - $1.91 - Immediate support
$1.75 - $1.80 - FVG zone / liquidity sweep
$1.72 - Major support zone (bottom red line)
SCENARIO ANALYSIS
SHORT-TERM: Bearish Into FVG
Price retraces to $1.75-$1.80 FVG zone
Sweeps liquidity below $1.80
Consolidation phase begins
THEN: Breakout Either Direction
BULLISH: Break above $2.12 → Targets $2.20, $2.50
BEARISH: If no FVG bounce → Break below $1.72 → Targets $1.61, $1.45
My Assessment
Ascending triangle at $2 resistance. Short-term bearish into FVG at $1.75-$1.80, then consolidation. Wait for breakout confirmation before committing to direction. The $2 zone has rejected XRP since 2017 - this is a make-or-break level.
Strategy:
Expect short-term drop to $1.75-$1.80 FVG
Watch for consolidation and breakout direction
Long above $2.12 → Target $2.20-$2.50
Short below $1.72 → Target $1.61-$1.45
Comment your thoughts on the XRP 2026 Bull or Bear RALLY!

NVO – Weekly Structure UpdateThesis
NVO is attempting a structural reversal after a deep corrective phase, supported by both long-term trend support and improving fundamental visibility.
Context
- Weekly timeframe
- 70% correction from cycle highs
- Price has respected the long-term trendline originating in 2016
- Recent product developments in weight-loss therapies improve long-term business outlook
What I see
- Price held the long-term rising support after the correction
- Recent advance reclaimed the 50-day moving average
- Price is consolidating above short-term support, suggesting stabilization
- Structure is transitioning from decline to base formation
What matters now
- Holding above the 50-day MA keeps the early reversal structure intact
- Next key test sits at the confluence of the 0.618 Fibonacci retracement and the 200-day moving average near the $60 area
Buy / Accumulation zone
- Pullbacks toward the current base and rising support zone remain the area of interest
Targets
- Initial resistance at the 0.618 Fib / 200-day MA confluence
- A confirmed higher low after that test would define Wave 1–2 structure
- Longer-term reference remains the 200-week moving average overhead
Risk / Invalidation
- Loss of the long-term trendline would invalidate the reversal thesis

XAUUSD (H2) – Liam Plan (Jan 02) Price is compressing in a structure, wait for the trendline break to choose direction 🎯
Quick summary
After the strong bearish BOS, gold is rebounding and compressing inside a diagonal structure (triangle/flag-like). Today the clean approach is confirmation trading:
SELL only after a confirmed break of the trendline (4348–4350) as marked on your chart.
SELL reactions at the upper supply / VAL zones (4460–4463 and 4513–4518).
BUY is secondary — only if price holds the 4400–4405 key support and shows a clear reaction on lower timeframes.
Macro backdrop (CME FedWatch)
Probability Fed holds rates in January: 85.1%
Probability of a 25 bps cut in January: 14.9%
By March: probability of 25 bps cumulative cut: 51.2%, hold 42.8%, 50 bps cut 5.9%
👉 This keeps markets sensitive to USD / yields expectations. Gold can bounce technically, but volatility spikes are likely — so we stick to levels + confirmation.
Key Levels (from your chart)
✅ Sell zone 1: 4513 – 4518
✅ Sell VAL: 4460 – 4463
✅ Reaction / flip zone: 4400 – 4405
✅ Breakdown trigger: 4348 – 4350 (sell upon confirmed trendline breakout)
Trading scenarios (Liam style: trade the level)
1) SELL scenarios (priority)
A. SELL on trendline breakdown confirmation
Trigger: clean break + close below 4348–4350
Entry: sell the retest back into the broken trendline
TP1: 4320–4305
TP2: 4260–4240
TP3: deeper extension (towards the 41xx area) if momentum expands
Logic: This is the clearest “trend confirmation” on your chart. No chasing — let price confirm first.
B. SELL reaction at supply
Sell: 4460–4463 (VAL)
Stronger sell: 4513–4518 (premium supply)
Only sell with visible weakness / rejection on M15–H1.
2) BUY scenario (secondary – reaction only)
Buy zone: 4400–4405
Condition: hold the zone + print higher lows on lower TF
TP: 4460 → 4513 (scale out)
Logic: This is a key support/flip area. If it holds, price can rotate up to test supply above before the next decision.
Key notes
Compression often creates false breaks — don’t trade mid-range.
Two clean plays only: break 4348–4350 to sell with confirmation, or retrace to 4460/4513 to sell the reaction.
What’s your bias today: selling the 4348 breakdown, or waiting for 4460–4463 for a cleaner pullback sell?

XAUUSD (H1) – Early 2026 OutlookShort-term recovery inside a larger bullish cycle 💛
Quick market recap
2025 performance: Gold surged ~64%, the strongest annual gain since 1979
Recent move: Sharp year-end correction driven by profit-taking and margin adjustments, not trend reversal
Big picture: The multi-year bull market in precious metals remains intact
Fundamental context (why the trend still matters)
Despite the late-2025 pullback, the broader precious metals complex remains structurally strong. Gold, silver, platinum, and palladium all benefited from:
Fed rate-cut cycle expectations
Persistent geopolitical tensions
Strong central bank buying
Industrial demand and supply constraints (especially for silver and platinum)
Most analysts agree the recent correction was technical in nature. The long-term outlook still points toward gold potentially testing 5,000 USD/oz and silver approaching 100 USD/oz in 2026, although short-term volatility is expected to remain high.
Technical view (H1) – Based on the chart
After failing to hold above the ATH, gold experienced a sharp bearish displacement, followed by a stabilization phase near a strong support zone. Price is now attempting a recovery, but the structure suggests this is still a corrective move within a broader range.
Key observations:
Strong sell-off broke short-term bullish structure
Price is rebounding from major support, forming a potential higher low
Overhead liquidity and Fibonacci zones remain key reaction areas
Key levels Lana is watching
Buy zone – Strong liquidity support
Buy: 4345 – 4350
This is a strong liquidity zone where price already reacted. If price revisits this area and holds structure, it offers a favorable risk-to-reward buy aligned with the larger bullish cycle.
Sell zone – Short-term resistance (scalping)
Sell scalping: 4332 – 4336
This zone aligns with short-term resistance and Fibonacci reaction levels. If price fails here, a brief pullback toward support is possible.
Important overhead liquidity
Key liquidity: 4404 area
A clean break and hold above this level would signal stronger bullish continuation toward higher targets.
Scenarios to consider
Scenario 1 – Range correction continues
Price reacts at short-term resistance, rotates back into liquidity, and builds a base before the next directional move.
Scenario 2 – Bullish continuation resumes
A break above overhead liquidity opens the path toward higher levels, potentially retesting prior highs as the new year unfolds.
Lana’s approach 🌿
Trade zones, not headlines
Focus on price reaction at liquidity levels
Accept short-term volatility while respecting the long-term bullish structure
This analysis reflects Lana’s personal market view and is not financial advice. Please manage risk carefully and trade responsibly 💛

BTC BUY ALERT
📌 Trade Plan:
🔓 Entry: 89000
❌ Stop Loss: 88500
🎯 Target: 90000
🔥 BTC BUY ALERT – 89,000 Zone
Buyers stepping in strong! Momentum building toward 90,000.
Clean setup, high-probability entry, perfect risk-reward.
⚠️ Trade with discipline. Educational purpose only.

GOLD BUY TODAY | Demand Zone Holding, Upside Targets Open🔓 Entry: 4380 – 4390
❌ Stop Loss: 4365
🎯 Target: 4430 Next Target: 4450
GOLD BUY (XAUUSD) Price is holding above a key demand zone with bullish price action and trend support intact. Looking for upside continuation as buyers remain in control. A sustained move higher can push price toward the next resistance levels. Trade is planned with clear risk management and favorable risk-reward, suitable for intraday to short-term continuation.

XAUUSD H4 Buy Limit | Trend Continuation Setup📊 XAUUSD Technical Analysis (H4)
Price is moving within an ascending structure and continues to respect the bullish trendline.
After a healthy pullback into the demand zone, a continuation to the upside is expected.
🔹 Entry Zone: Buy Limit at 4258 – 4216
❌ Stop Loss: Two H4 candle closes below 4196
✅ Target: 4353
📌 Once the buy limit is activated, partial risk management will be applied.
After price reaches 4290, the position will be secured by moving to break-even (risk-free).
⚠️ Always manage your risk properly.
Wishing you success and victory,🧿❤️✌️
FXG Team Management” 🏅

Bitcoin Is Coiling — The Next Move Won’t Be QuietBITCOIN (BTC/USD) – 4H MARKET ANALYSIS
Market Structure Overview
- Bitcoin is currently trapped in a well-defined range on the H4 timeframe.
- Price is oscillating between a major resistance zone around 90,000–90,500 and a strong support zone around 86,500–87,000.
- Repeated rejections at resistance and consistent reactions from support confirm a classic consolidation / distribution range.
Key Technical Observations
- Each push into the resistance zone is met with strong selling pressure, indicating supply dominance at higher levels.
- Sellers, however, are failing to break decisively below support, suggesting buyers are still absorbing liquidity.
- The repeated zig-zag structure inside the range shows liquidity being built, not trend continuation yet.
- Volume remains relatively muted compared to impulsive legs → typical behavior before a -volatility expansion.
Scenarios to Watch
Bullish Breakout Scenario
A clean breakout and acceptance above 90,500 could trigger a strong upside expansion, opening the path toward 92,000–94,000.
This would confirm accumulation and invalidate the current range.
Bearish Breakdown Scenario
A decisive break below 86,500 would shift the structure into a deeper corrective phase.
In that case, downside momentum could accelerate quickly as range support fails.
Trading Bias & Strategy
Neutral bias while inside the range.
Best strategy: trade reactions at the edges of the range, not the middle.
For swing positioning, patience is key — wait for a confirmed breakout with volume before committing size.
Conclusion
Bitcoin is not trending it is preparing.
The longer the range holds, the stronger the eventual breakout.
Stay disciplined, protect capital, and let the market reveal direction before acting.

XAUUSD (H1) – Liam View: Strong BOS → short-term bearish shift, prefer selling the pullback | Quick reaction buy at 4330–4333
Quick summary
Gold just printed a very aggressive dump with clear BOS (Break of Structure) — a short-term bearish shift is now in play. Price is currently in a technical rebound, so the cleaner plan is:
Don’t chase shorts at the lows
Wait for a pullback into 4458–4462 to sell from a premium supply zone
If price sweeps back down, look for a quick reaction buy at 4330–4333
1) Technical view (based on your chart)
The sell-off looks like a classic liquidity dump: large bearish candles, multiple supports broken → confirms bearish pressure intraday.
After a dump, the market often retraces into supply (re-distribution) before the next leg.
The 4330–4333 area is marked as a support that already “tested liquidity” — it can still provide a bounce, but it’s more of a scalp zone, not a full reversal yet.
2) Key Levels
✅ Sell zone: 4458 – 4462 (supply / pullback short)
✅ Buy zone: 4330 – 4333 (support / quick reaction)
3) Trading scenarios (Liam style: trade the level)
Scenario A (priority): SELL the pullback
✅ Sell: 4458 – 4462
SL guide: 4470 (or above the most recent lower-TF swing high)
TP1: 4400 – 4390
TP2: 4333
TP3: extension lower if structure continues to break down
Logic: After a strong BOS, 4458–4462 is where you get a better short entry — avoid selling late.
Scenario B: BUY reaction at support (scalp only)
✅ Buy: 4330 – 4333
SL guide: 4322–4325
TP: 4370 → 4400 (scale out)
Logic: This zone can spark a technical bounce. Only buy with clear holding signals on lower timeframes (M5–M15) — no catching falling knives.
4) Confirmation rules (avoid noise)
If price reaches 4458–4462 and fails to reclaim above → SELL bias stays strong.
If 4330 breaks and closes below → stop looking for buys and focus on pullback sells.
5) Risk notes
No mid-range entries — only act at 4330–4333 or 4458–4462.
Risk per trade: max 1–2%.
After a dump, spreads and wicks can expand — reduce size.
Which side are you leaning today: selling 4458–4462, or waiting for 4330–4333 to buy the reaction bounce?

DXY - Descending Wedge at 98.13 | -9.58% YTD
Executive Summary
The US Dollar Index (DXY) is trading at 98.130 on December 29, 2025, consolidating within a descending wedge pattern on the 2H timeframe. The Dollar is on track for its worst year since 2017 with -9.58% YTD losses, pressured by Fed rate cut expectations, dovish Fed Chair concerns, and Trump's tariff policies. However, a potential bullish reversal pattern is forming at the bottom of the wedge, with an ascending channel developing. FOMC minutes due Tuesday could be the catalyst for the next directional move.
BIAS: NEUTRAL - Watching for Breakout Direction
The Dollar is at a critical inflection point. The descending wedge suggests potential bullish reversal, but fundamental headwinds remain strong. Wait for confirmation before committing to a direction.
Current Market Context - December 29, 2025
DXY is consolidating near yearly lows:
Current Price: 98.130 (+0.08% on the day)
Day's Range: 97.915 - 98.177
52-Week Range: 96.218 - 110.176
52-Week High: 110.176
52-Week Low: 96.218
Technical Rating: SELL
Performance Metrics - MIXED:
1 Week: -0.54%
1 Month: -1.45%
3 Months: +0.22%
6 Months: +1.54%
YTD: -9.58%
1 Year: -9.21%
The Dollar is having its worst year since 2017, down nearly 10% YTD. Short-term metrics are mixed, but the longer-term trend is clearly bearish.
THE BEAR CASE - Dollar Weakness Continues
1. Fed Rate Cut Expectations
The Dollar continues to see underlying weakness as markets price in further rate cuts:
FOMC expected to cut rates by ~50 bp in 2026
Markets pricing 19% chance of -25 bp cut at January 27-28 meeting
Two rate cuts expected in 2026
Fed officials split on path forward - majority forecast single additional cut
Lower rates = weaker Dollar
2. Dovish Fed Chair Concerns
President Trump to announce new Fed Chair in early 2026
Kevin Hassett (National Economic Council Director) most likely choice
Hassett seen as most dovish candidate by markets
Trump wants next Fed chairman to lower rates
Dovish Fed Chair = bearish for Dollar
3. Fed Liquidity Injection
Fed began purchasing $40 billion/month in T-bills mid-December
Announced December 10 - $40 billion/month liquidity injection
Increased liquidity pressures Dollar lower
Quantitative easing-like effects
4. Interest Rate Differentials
FOMC expected to cut rates ~50 bp in 2026
BOJ expected to raise rates +25 bp in 2026
ECB expected to leave rates unchanged in 2026
Narrowing rate differentials = Dollar weakness
Yen strengthening on BOJ rate hike expectations
5. Trump Tariff Policies
Aggressive tariff policies pressuring Dollar
Threats to Fed independence
Trade tensions creating uncertainty
Dollar down nearly 10% YTD partly due to tariff concerns
6. Technical Rating: SELL
TradingView technicals gauge pointing toward "Sell"
Descending wedge pattern (bearish continuation possible)
Below major moving averages
Momentum indicators bearish
THE BULL CASE - Potential Reversal Forming
1. Descending Wedge Pattern (Bullish Reversal)
Descending wedge is typically a bullish reversal pattern
Price compressing at bottom of wedge
Ascending channel forming within wedge
Potential breakout to upside
Pattern suggests exhaustion of selling pressure
2. US Economic Data Still Solid
Q3 GDP came in at +4.3% - stronger than expected
Nov pending home sales rose +3.3% m/m (vs +0.9% expected)
Jobless claims unexpectedly fell
US businesses see employment growth at 4.32%
Revenue growth expectations at 3.83%
Strong data could limit Dollar weakness
3. Safe-Haven Demand
Stock market weakness boosting liquidity demand for Dollar
Geopolitical tensions (Venezuela blockade, ISIS strikes in Nigeria)
Ukraine-Russia peace deal uncertainty
Risk-off events could boost Dollar
4. Oversold Conditions
Dollar down -9.58% YTD - oversold
Mean reversion possible
Near 52-week low (96.218)
Potential for bounce
5. "US Exceptionalism" Positioning
BNY's Bob Savage: Rise above 98.15 could trigger momentum buying
"US exceptionalism positioning" could resurge
Dollar bulls waiting for catalyst
6. FOMC Minutes Catalyst
Fed minutes due Tuesday (December 30)
Could provide signals on rate cut timing
Hawkish surprise could boost Dollar
Key catalyst for next move
Technical Structure Analysis
Price Action Overview - 2 Hour Timeframe
The chart shows a complex structure with potential reversal forming:
Descending Wedge Pattern (Primary):
Clear descending wedge established from highs
Upper trendline: Falling resistance (connecting lower highs)
Lower trendline: Falling support (connecting lower lows)
Wedge narrowing - compression before breakout
Typically bullish reversal pattern
Price near apex of wedge
Ascending Channel (Secondary - Forming at Bottom):
Small ascending channel forming within wedge
Higher lows being established
Potential early reversal signal
Watch for breakout above wedge resistance
Key Zones Identified:
Upper resistance zone: ~99.25 (major resistance)
Secondary resistance: ~98.80
Current consolidation: 97.90-98.20
Support zone: ~97.85-98.00
Major support: ~97.25
52-Week Low: 96.218
Key Support and Resistance Levels
Resistance Levels:
98.177 - Day's high / immediate resistance
98.15 - BNY trigger level for momentum buying
98.80 - Secondary resistance zone
99.00 - Psychological resistance
99.25 - Major resistance zone
100.00 - MAJOR PSYCHOLOGICAL RESISTANCE
110.176 - 52-WEEK HIGH
Support Levels:
97.959 - Recent low
97.915 - Day's low / immediate support
97.85-98.00 - Support zone
97.50 - Secondary support
97.25 - Major support
96.50 - Deep support
96.218 - 52-WEEK LOW (critical)
Pattern Analysis
Descending Wedge Characteristics:
Pattern duration: Several weeks
Wedge narrowing toward apex
Volume typically decreases in wedge
Breakout direction: Usually bullish (70% of cases)
Target: Measured move = wedge height at breakout
Current position: Near bottom of wedge
Ascending Channel (Within Wedge):
Small ascending channel forming
Higher lows: Bullish sign
Could be early reversal signal
Watch for breakout above 98.80
Moving Average Analysis
Price trading below major moving averages
MAs sloping downward - bearish alignment
Short-term MAs below long-term MAs
Death cross patterns on longer timeframes
MAs providing dynamic resistance on rallies
SCENARIO ANALYSIS
BULLISH SCENARIO - Descending Wedge Breakout
Trigger Conditions:
2H close above 98.80 (wedge resistance)
Break above 99.00 psychological level
Volume confirmation on breakout
FOMC minutes hawkish surprise
Risk-off sentiment boosting Dollar
Price Targets if Bullish:
Target 1: 99.25 - Major resistance zone
Target 2: 100.00 - Psychological level
Target 3: 101.00-102.00 - Measured move target
Extended: 103.00+ (trend reversal)
Bullish Catalysts:
Descending wedge = bullish reversal pattern (70% breakout up)
Ascending channel forming at bottom
US economic data still solid (GDP +4.3%)
Oversold conditions (-9.58% YTD)
Safe-haven demand potential
FOMC minutes could be hawkish
"US exceptionalism" positioning could return
Mean reversion from extreme weakness
BEARISH SCENARIO - Wedge Breakdown / Continuation
Trigger Conditions:
Break below 97.25 major support
Close below 97.00
FOMC minutes dovish
Fed signals more aggressive rate cuts
Dovish Fed Chair announcement
Price Targets if Bearish:
Target 1: 97.25 - Major support
Target 2: 96.50 - Deep support
Target 3: 96.218 - 52-week low
Extended: 95.00-96.00 (new lows)
Bearish Catalysts:
-9.58% YTD - Worst year since 2017
Technical rating: SELL
Fed rate cuts expected (~50 bp in 2026)
Dovish Fed Chair concerns (Hassett)
Fed liquidity injection ($40B/month)
Interest rate differentials narrowing
Trump tariff policy uncertainty
Below major moving averages
NEUTRAL SCENARIO - Consolidation in Range
Most likely short-term outcome:
Price consolidates between 97.50-98.80
Thin holiday trading continues
Wait for FOMC minutes Tuesday
Wait for Fed Chair announcement
Wedge pattern continues to compress
Breakout direction unclear until catalyst
MY ASSESSMENT - NEUTRAL with Slight Bullish Bias
The evidence is mixed, but the technical pattern suggests potential reversal:
Bullish Factors:
Descending wedge = typically bullish reversal
Ascending channel forming at bottom
Oversold conditions (-9.58% YTD)
US economic data solid
Safe-haven demand potential
Near 52-week low (mean reversion)
Bearish Factors:
Technical rating: SELL
Fed rate cuts expected
Dovish Fed Chair concerns
Fed liquidity injection
Interest rate differentials narrowing
Below major moving averages
Worst year since 2017
My Stance: NEUTRAL - Wait for Confirmation
The descending wedge pattern suggests potential bullish reversal, but fundamental headwinds are strong. The Dollar could go either way from here. Wait for FOMC minutes and a clear breakout before committing.
Strategy:
Wait for breakout confirmation
Long above 98.80 with targets 99.25, 100.00
Short below 97.25 with targets 96.50, 96.218
Respect the wedge pattern
FOMC minutes Tuesday = key catalyst
Trade Framework
Scenario 1: Bullish Breakout Trade Above 98.80
Entry Conditions:
2H close above 98.80
Volume confirmation
Break above descending wedge resistance
Trade Parameters:
Entry: 98.85-99.00 on confirmed breakout
Stop Loss: 98.00 below recent support
Target 1: 99.25 (Risk-Reward ~1:0.5)
Target 2: 100.00 (Risk-Reward ~1:1.2)
Target 3: 101.00-102.00 (Measured move)
Scenario 2: Bearish Breakdown Trade Below 97.25
Entry Conditions:
2H close below 97.25
Volume confirmation
Break below major support
Trade Parameters:
Entry: 97.20-97.00 on confirmed breakdown
Stop Loss: 97.80 above recent resistance
Target 1: 96.50 (Risk-Reward ~1:1)
Target 2: 96.218 (52-week low)
Target 3: 95.50-96.00 (Extended)
Scenario 3: Range Trade (Neutral)
Entry Conditions:
Price bounces at 97.50-97.85 support
Bullish rejection candle
No breakout yet
Trade Parameters:
Entry: 97.50-97.85 at support
Stop Loss: 97.00 below major support
Target 1: 98.50 (Risk-Reward ~1:1)
Target 2: 98.80 (Wedge resistance)
Risk Management Guidelines
Position sizing: 1-2% max risk per trade
Wait for breakout confirmation
Thin holiday volumes = wider stops
FOMC minutes Tuesday = key catalyst
Don't anticipate breakout direction
Scale out at targets
Move stop to breakeven after first target
Watch for Fed Chair announcement
Invalidation Levels
Bullish thesis invalidated if:
Price closes below 96.218 (52-week low)
Descending wedge breaks down
Fed signals aggressive rate cuts
Dovish Fed Chair confirmed
Bearish thesis invalidated if:
Price closes above 99.25 (major resistance)
Descending wedge breaks up with volume
Fed signals no more rate cuts
Risk-off surge boosts Dollar
Key Events to Watch
FOMC Minutes - Tuesday, December 30
Fed Chair Announcement - Early 2026
Year-End Positioning - Through January 1
BOJ Policy Signals - January 23 meeting
ECB Policy - February 5 meeting
Conclusion
The US Dollar Index is at a critical inflection point, trading at 98.130 within a descending wedge pattern. The Dollar is on track for its worst year since 2017 with -9.58% YTD losses, but a potential bullish reversal pattern is forming.
The Numbers:
Current Price: 98.130
YTD Performance: -9.58%
1-Year Performance: -9.21%
52-Week High: 110.176
52-Week Low: 96.218
Technical Rating: SELL
Key Levels:
99.25 - Major resistance
98.80 - Wedge resistance / breakout level
98.13 - Current price
97.85-98.00 - Support zone
97.25 - Major support
96.218 - 52-WEEK LOW
The Setup:
Descending wedge pattern with ascending channel forming at bottom. Fundamentals are bearish (Fed rate cuts, dovish Fed Chair concerns), but technicals suggest potential reversal. FOMC minutes Tuesday could be the catalyst.
Strategy:
NEUTRAL stance - wait for confirmation
Long above 98.80, target 99.25, 100.00
Short below 97.25, target 96.50, 96.218
FOMC minutes Tuesday = key catalyst
Respect the pattern
The Dollar is at a crossroads. The descending wedge suggests potential bullish reversal, but fundamental headwinds remain strong. Wait for the breakout.
