EMA Reaction Sparks a Bounce — Correction or the Start of TrendEURUSD is still operating inside a broader bearish structure, with the dominant trend defined by a clear sequence of lower highs and lower lows. However, the most recent price action shows a counter-trend corrective bounce emerging from oversold conditions rather than a confirmed trend reversal. The strong bullish candle from the recent low signals short-term short covering and reaction buying, but this move should be treated as corrective within a downtrend until proven otherwise.
EMA Reaction & Technical Confluence
Price has just reacted precisely from the EMA zone, which has acted as dynamic resistance throughout the downtrend. The current push above the EMA reflects momentum relief rather than structural change.
Importantly:
- The EMA is still sloping downward
- Price remains below major prior supply
- No higher high has been formed yet
This setup often leads to a pullback–continuation sequence, where price retests higher resistance levels before sellers reassert control unless strong acceptance occurs above key levels.
Key Levels
Resistance:
1.1698 – 1.1713 (prior supply / corrective target)
1.1750 – 1.1760 (major structure resistance / trend invalidation)
Support:
1.1650 – 1.1660 (EMA reaction zone)
1.1620 (recent swing low / bearish continuation trigger)
EMA / Dynamic Level:
EMA acting as short-term balance, still bearish in slope
Scenarios
➡️ Primary Scenario (Corrective Bounce):
Price continues the corrective move toward the 1.1698–1.1713 resistance zone. This area is expected to attract selling interest, where the market may form a lower high before resuming the broader downtrend.
⚠️ Risk Scenario (Trend Shift Attempt):
A strong breakout and acceptance above 1.1750 would weaken the bearish structure and signal a potential transition into a broader range or trend shift. Until that level is reclaimed, bullish moves remain corrective.
Technical-analysis

Ethereum at Key Demand — Smart Money Accumulation Price is holding firmly inside a well-defined demand zone around 3,050–3,080, where sell-side liquidity has already been swept and downside momentum is clearly slowing. The current consolidation suggests accumulation rather than continuation lower.
A strong hold above the demand zone favors a bullish recovery toward the 3,150–3,180 liquidity range, which acts as the first upside checkpoint.
If price reclaims and holds above 3,200, bullish momentum could accelerate toward the supply zone at 3,280–3,320, with a potential extension toward 3,350+. As long as price remains above 3,050, the upside scenario remains the primary focus.

Is This a Retest for Continuation or a Liquidity Trap?Gold remains structurally bullish on the H4 timeframe after reclaiming key levels and breaking out of a well-defined consolidation range. Following a prolonged corrective phase, price successfully transitioned from compression into expansion, confirming renewed buyer control as the market pushed above the prior resistance zone and respected the rising channel structure.
After the breakout, price accelerated toward the upper boundary of the ascending channel, where selling pressure emerged near the 4,510–4,520 region. This area aligns with a higher-timeframe supply zone, explaining the sharp reaction and temporary rejection. The inability to immediately hold above this zone suggests the market is now entering a short-term rebalancing phase rather than continuing straight into expansion.
Current price action points toward a potential breakout–retest dynamic. As long as price holds above the former resistance and remains supported within the channel structure, a controlled pullback toward the mid-channel region and the 4,403 support area appears technically healthy. This zone also overlaps with the broader liquidity price range, where the market previously accumulated before the upside push.
If buyers successfully defend this area and reclaim momentum, Gold would be well-positioned for continuation toward the upper supply zone near 4,550. Such a move would reflect a classic trend continuation sequence following liquidity absorption and structural confirmation.
However, failure to hold the 4,403 support would shift focus toward deeper downside liquidity within the lower range. Even in that scenario, the broader bullish bias would remain intact unless price loses the channel structure decisively, suggesting that any deeper pullback would still be corrective rather than a full trend reversal.

Bitcoin Is Building a Base — Accumulation Before the Next Push Price is consolidating above the key support zone around 89,800–90,000, showing clear signs of selling pressure absorption after the recent sell-off. Volume behavior suggests potential accumulation rather than aggressive distribution.
As long as price holds above 89,800, the bullish scenario remains favored. A clean break and acceptance above 91,200–91,500 would confirm upside momentum, opening the path toward 93,000, followed by the major target near 94,700–95,000.
Only a decisive breakdown below 89,800 would invalidate the bullish setup. For now, buyers appear to be positioning for the next expansion leg to the upside.

USD/JPY(20260109)Today's AnalysisMarket News:
On Tuesday, both the Dow Jones Industrial Average and the Dow Jones Transportation Average hit record closing highs, marking the first buy signal from Dow Theory in over a year.
Technical strategists believe this confirms the bull market that began in late 2022 remains firmly established, even as some previously high-performing AI-related stocks have recently faced pressure.
The Dow Jones Industrial Average's last record closing high was on January 5th, while the Dow Jones Transportation Average's record high was even further back. Dow Jones market data shows that the index's last record closing high was on November 25th, 2024.
Technical Analysis:
Today's Buy/Sell Threshold:
156.79
Support and Resistance Levels:
157.40
157.17
157.02
156.55
156.41
156.18
Trading Strategy:
If the price breaks above 157.02, consider buying with a first target price of 157.1.
If the price breaks below 156.79, consider selling with a first target price of 156.55.

EURAUD: Bearish Momentum Returns Into 2026In today's article, we are looking at the EURAUD currency pair, where a clean bearish pattern is developing that could push prices significantly lower in 2026.
EURAUD previously completed a falling leading diagonal, followed by an ABC corrective recovery. This corrective phase now appears complete, reinforcing the view that the broader downtrend is ready to resume.
The pair has formed a lower swing high near 1.8155, followed by a strong sell-off that broke below the rising trend-line support drawn from the November 2024 lows. This move suggests that EURAUD has entered the third leg lower, likely to unfold as a five-wave decline from the October high.
Further downside pressure is expected during the first half of 2026. The bearish structure remains intact as long as price trades below the descending channel resistance near 1.76. Under this scenario, there is room for an extended decline toward the 1.70 handle in the coming months, with any interim bounces likely to be corrective rather than trend-reversing.

H4 US Dollar Index (DXY) – Technical AnalysisThe US Dollar Index (DXY) is trading near 98.70 on the 4H chart, and it’s looking like it’s going to continue its recovery within that rising channel from the low at 97.75. Price has managed to take back the 50% Fib level at 98.24 and is now testing the resistance at 98.74 – which just so happens to be where a prior support level used to be.
The 200-EMA at 99.00 is a big deal as far as upside goes, while the supports sit at 98.12 and 97.9. RSI is sitting at 58, which is a pretty good sign. The trade idea is to pick up a few dollars on the dip near 98.30 and aim for 99.20, but set a stop loss below 97.95.

USD/JPY(20260107)Today's AnalysisMarket News:
① Venezuela and the United States are negotiating on oil exports to the US.
② In the early years of Maduro's rule, Venezuela shipped $5.2 billion worth of gold to Switzerland.
③ Shipping data shows that in the past five days, Venezuela's main oil terminals have not shipped crude oil for export to any destination other than Chevron in the United States.
Technical Analysis:
Today's Buy/Sell Threshold:
156.52
Support and Resistance Levels:
157.15
156.91
156.76
156.28
156.13
155.89
Trading Strategy:
If the price breaks above 156.76, consider buying, with a first target price of 156.91.
If the price breaks below 156.52, consider selling, with a first target price of 156.28.

USD/JPY(20251224)Today's AnalysisMarket News:
The US economy expanded at a rate of 4.3% in the third quarter, the fastest growth in two years, but the US consumer confidence index declined for the fifth consecutive month.
ADP Weekly Employment Report: In the four weeks ending December 6, 2025, private sector employers added an average of 11,500 jobs per week.
Trump: Those who disagree with him will never become Fed Chair. Next Fed candidate Hassett: Predicts monthly job growth may return to 100,000+, and the Fed is far behind the times on interest rate cuts.
Technical Analysis:
Today's Buy/Sell Threshold:
156.30
Support and Resistance Levels:
157.71
157.18
156.84
155.76
155.42
154.90
Trading Strategy:
If it breaks above 156.30, consider buying, with a first target price of 156.84.
If it breaks below 155.76, consider selling, with a first target price of 155.42.

USD/JPY(20251218)Today's AnalysisMarket News:
Ben Waller, one of the final candidates for the next Federal Reserve Chair and current Governor, said on Wednesday that the current job market is "very weak" and job growth is "not optimistic," therefore the Fed still has room to cut interest rates. He supports further rate cuts to restore the central bank's interest rate setting to a neutral level, while stating that policymakers do not need to rush into doing so.
Speaking at the Yale University CEO Summit, Waller noted that the Fed's current interest rate is 50 to 100 basis points higher than the neutral rate, but he emphasized that "aggressive action is not needed" and that rate cuts can continue "at a moderate pace."
Waller stated that "the job market indicates the Fed should continue cutting rates," while also assuring that "we are not seeing a cliff-like drop in the job market."
Technical Analysis:
Today's Buy/Sell Threshold:
155.30
Support and Resistance:
156.52
156.06
155.77
154.83
154.54
154.08
Trading Strategy:
If the price breaks above 155.77, consider buying, with a first target price of 156.06.
If the price breaks below 155.30, consider selling, with a first target price of 154.83.

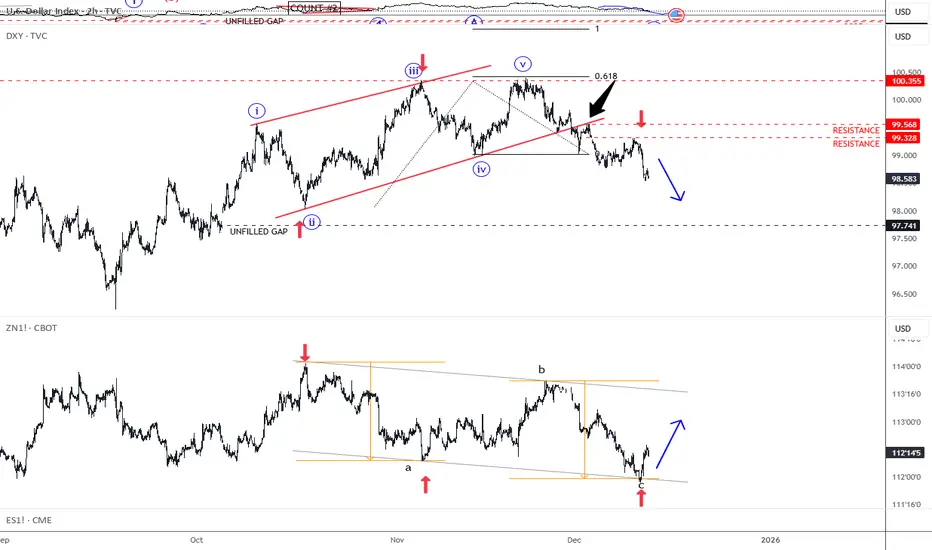
Fed Cuts, Treasuries Bounce, Dollar Slips FurtherGood morning traders! The Fed cut interest rates by 0.25% yesterday, marking the third straight cut. A few members dissented, showing the committee isn’t fully aligned. They proceeded with the cut as the job market continues to cool, even though inflation is still sticking around. The Fed also hinted this could be the last cut for a while and announced plans to start buying short-term Treasuries to keep liquidity stable. The US dollar remains under bearish pressure, while stocks hold steady, keeping the risk-on sentiment intact. This momentum could carry into year-end, we should just be aware of potential short-term pullbacks. USDollar Index - DXY remains nicely bearish, supported by 10Y US Treasury chart, as anticipated. If we consider that 10Y US Notes chart is now turning back to bullish mode, then DXY could easily see more weakness at least towards the open/unfilled GAP at 97.74 area.
SMH Is In Wave 5 Extension as Semiconductors Aim for 400 AreaSMH is the VanEck Semiconductor ETF, giving concentrated exposure to major global semiconductor companies like NVIDIA, TSMC, and Broadcom. It holds about 25 stocks and is known for higher volatility because a few large chipmakers dominate the fund. Investors use SMH to bet on long-term growth in chips, AI, and tech hardware, but it can swing sharply due to the cyclical nature of the semiconductor industry.
VanEck Semiconductor ETF (SMH) is trading within a five-wave bullish impulse from the April lows. Based on Elliott Wave theory, the ETF appears to be in the final Wave 5, which can still extend above the October highs toward the 400 area. Short-term pullbacks are possible, but the broader trend remains bullish. With current risk-on sentiment, semiconductor stocks could continue higher into late 2025 or even early 2026.

How i trade This is how i trade.
Looking at AUDJPY, I want to show you step by step how i trade using volume, momentum and rsi, looking at each timeframe from the monthly to the 5 min.

USD/JPY(20251107)Today's AnalysisMarket News:
Revelo Labs, a US private data provider, reported that US non-farm payrolls decreased by 9,100 in October; Challenger job cuts in the US surged 175% year-over-year in October, and year-to-date layoffs increased by 65%; Chicago Fed data showed the October unemployment rate was approximately 4.36%, a four-year high. Federal Reserve officials remain cautious. Chicago Fed President Goolsby believes a lack of reliable inflation data and remains hesitant about interest rate cuts; Cleveland Fed President Hammarck emphasized inflation risks and opposed further rate cuts; however, Governor Milan continues to expect a Fed rate cut in December; New York Fed President Williams believes the model-based estimate of the US neutral interest rate is around 1%. Governor Barr pointed out that the impact of artificial intelligence may be affecting hiring in some industries.
Technical Analysis:
Today's Buy/Sell Threshold:
153.33
Support and Resistance Levels:
154.63
154.15
153.83
152.83
152.52
152.03
Trading Strategy:
If the price breaks above 153.33, consider buying with a first target price of 153.83.
If the price breaks below 152.83, consider selling with a first target price of 152.52.

USD/JPY(20251105)Today's AnalysisMarket News:
The US government shutdown stalemate continues, and the 35-day record is about to be broken.
Technical Analysis:
Today's Buy/Sell Threshold:
153.81
Support and Resistance Levels:
154.97
154.54
154.26
153.37
153.09
152.66
Trading Strategy:
Consider buying if the price breaks above 153.81, with a first target price of 154.26.
Consider selling if the price breaks below 153.37, with a first target price of 153.09.

USD/JPY(20251029)Today's AnalysisMarket News:
A survey by the London Bullion Market Association (LBMA) predicts gold prices will reach $4,980.3 per ounce and silver prices will reach $59.1 per ounce in one year.
Technical Analysis:
Today's Buy/Sell Threshold:
152.22
Support and Resistance Levels:
153.33
152.91
152.64
151.80
151.53
151.11
Trading Strategy:
If the price breaks above 152.22, consider buying with a first target price of 152.64.
If the price breaks below 151.80, consider selling with a first target price of 151.53.

Chorus (CNU) major resistance test. Price discovery?
CNU being in the Telcom space has seen a steady and consistent upwards trend since near its inception and being listing on the ASX, with over 600% gain since 2013. In the last 5 years or so we've seen a sideways trend, as the price begins to advance towards test its previous major resistance @ around the $8.80 mark.
On the (W) we can see a gap down after a test of this key area and a mean reversion to the 200MA with a close on the 50MA. Some big seller volume moved in to push the price down, but encouragingly price as respected the current trend line, with signs of a bounce this week.
A potential GAP fill is in play, and a potential for a break above major resistance and then into price discovery for this company. A clear BUY signal would be a break or break and hold after a retest of the resistance of the $8.80 mark. Good luck.

USD/JPY(20251023)Today's AnalysisMarket News:
The shutdown continues, and the US Senate has rejected the temporary funding bill for the 12th time.
Technical Analysis:
Today's buy/sell levels:
151.83
Support and resistance levels:
152.38
152.17
152.04
151.61
151.48
151.27
Trading Strategy:
If the stock breaks above 152.04, consider buying, with the first target price being 152.17.
If the stock breaks below 151.83, consider selling, with the first target price being 151.61.

USD/JPY(20251021)Today's AnalysisMarket News:
The US government shutdown entered its 20th day on Monday after senators failed to break the impasse for the tenth time last week. The shutdown has also delayed the release of key economic data, leaving investors and Federal Reserve policymakers with a data vacuum ahead of next week's policy meeting. The US Consumer Price Index (CPI) data, delayed by the shutdown, is scheduled for release this Friday. Meanwhile, traders are pricing in a 99% probability of a Fed rate cut next week, with another cut expected in December. As a non-interest-bearing asset, gold typically performs well in a low-interest rate environment.
Technical Analysis:
Today's Buy/Sell Levels:
150.73
Support and Resistance Levels:
151.65
151.30
151.08
150.37
150.15
149.81
Trading Strategy:
On the upside, consider buying on a break above 151.08, with the first target at 151.30.
On the downside, consider selling on a break below 150.73, with the first target at 150.15.

USD/JPY(20250924)Today's AnalysisMarket Analysis:
Federal Reserve Chairman Powell stated that the policy rate remains somewhat restrictive, but allows the Fed to better respond to potential economic developments; tariffs are expected to have a one-time pass-through effect; and decisions will "never be based on political considerations." Fed spokespersons noted that Powell's comments indicate that he believes interest rates remain tight, potentially opening the door for further rate cuts.
Technical Analysis:
Today's Buy/Sell Levels:
147.66
Support and Resistance Levels:
148.13
147.95
147.84
147.49
147.37
147.20
Trading Strategy:
If the market breaks above 147.84, consider entering a buy position, with the first target price being 148.13.
If the market breaks below 147.66, consider entering a sell position, with the first target price being 147.49.

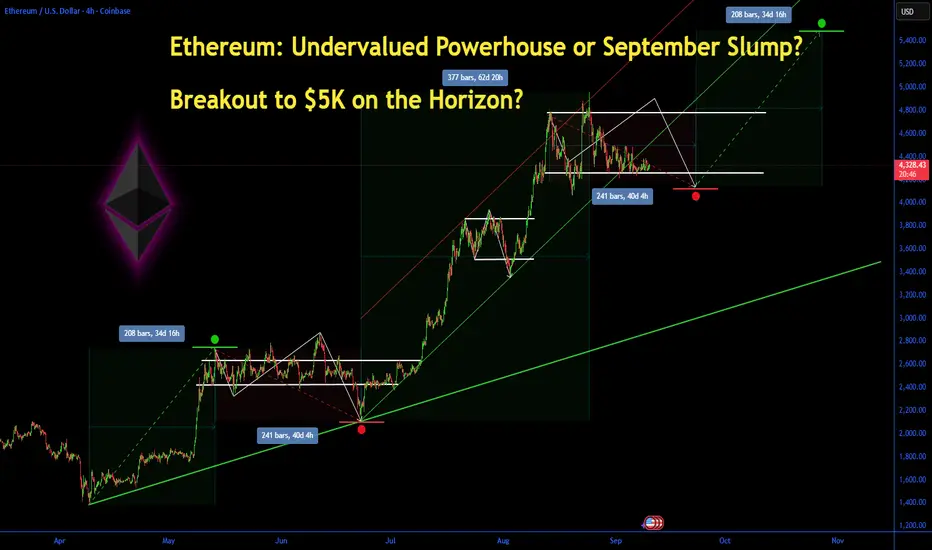
Ethereum: Undervalued Powerhouse or September Slump? Ethereum: Undervalued Powerhouse or September Slump? Breakout to $5K on the Horizon?
Ethereum (ETH) has held steady around $4,300 this month amid a choppy crypto market, down about 15% from its August all-time high but showing resilience with a modest 0.52% gain today to $4,328.5. Early September saw over $500 million in outflows from spot Ethereum ETFs, reversing summer inflows and fueling doubts about institutional appetite.
Yet, with analysts eyeing a potential rally to $9,000–$12,000 by year-end 2025 driven by ETF rotation and broader adoption, is ETH the undervalued blue-chip crypto ready for a rebound, or will seasonal weakness cap its upside? Let's dive into the fundamentals, charts, and key levels to navigate this pivotal moment.
Fundamental Analysis
Ethereum's core drivers remain tied to its ecosystem growth and macroeconomic tailwinds, but recent ETF flows have introduced volatility. As the backbone for DeFi, NFTs, and layer-2 scaling, ETH benefits from rising staking rewards and network upgrades like Dencun, which have boosted efficiency.
Analysts project ETH could hit $5,194 by late September, with long-term forecasts up to $12,000 in 2025 if institutional demand surges via ETFs. However, sticky inflation and Fed policy uncertainty could delay rate cuts, pressuring risk assets like crypto.
- **Positive:**
- Record ETF inflows in July–August signal growing institutional interest; recent positive territory returns hint at rotation back to ETH.
- Staking growth and adoption in DeFi (e.g., Aave, Uniswap) underscore undervaluation, with ETH's market cap at ~$520 billion versus Bitcoin's dominance.
- Broader trends like AI-blockchain integration and regulatory clarity (e.g., potential spot ETFs for challengers like Sui) bolster ETH's utility.
- **Negative:**
- $500M+ ETF outflows in early September reflect profit-taking and risk-off sentiment amid U.S. labor market weakness.
- Seasonal September weakness in crypto, compounded by geopolitical risks, could extend the correction if Bitcoin falters.
Technical Analysis
On the daily chart, ETH is coiling in a tight symmetrical triangle pattern after bouncing from the $4,320–$4,325 support base, with volume picking up on the upside. This consolidation follows a descending channel breakdown, but the hold above key EMAs suggests building momentum for a potential impulse wave higher. Current price: $4,328.5, with VWAP at $4,300 providing intraday support.
Key indicators:
- **RSI (14-day):** Hovering at 48, neutral but nearing oversold territory— a dip below 40 could signal a strong bounce. 📈
- **MACD:** Histogram in negative territory, but the signal line crossover is imminent, hinting at bullish divergence if volume confirms. ⚠️
- **Moving Averages:** Price above the 21-day EMA ($4,280) but testing the 50-day SMA ($4,350)—a sustained hold here avoids short-term bearish pressure.
Support/Resistance: Firm support at $4,320 (recent low and 200-day EMA), with major resistance at $4,500 (August high). Patterns/Momentum: The triangle apex nears; a bullish breakout above $4,500 could target $4,800–$4,952, while failure risks a retest of $4,200. 🟢 Bullish signals: Accumulation on hourly charts. 🔴 Bearish risks: Death cross if 50-day SMA flips below 200-day.
Scenarios and Risk Management
- **Bullish Scenario:** A clean break above $4,500 on ETF inflow news or positive macro data (e.g., softer PCE) targets $4,800 initially, then $5,000–$9,000 by Q4. Buy on pullbacks to $4,320 support for optimal entry.
- **Bearish Scenario:** Drop below $4,320 eyes $4,200 (psychological level); a full death cross could accelerate to $3,800. Avoid longs if Bitcoin slips under $60K.
- **Neutral/Goldilocks:** Range-bound $4,200–$4,500 if data remains mixed, ideal for scalping or options plays.
Risk Tips: Set stops 2–3% below support ($4,200) to cap losses. Risk no more than 1–2% of portfolio per trade. Diversify with BTC or stablecoins to hedge crypto correlations—avoid overexposure in this volatile September.
Conclusion/Outlook
Overall, a bullish bias emerges if ETH reclaims $4,500 and ETF flows reverse, positioning it as an undervalued play with 100%+ upside potential into 2025 amid institutional rotation.
But watch today's crypto volatility and upcoming Fed signals for confirmation—this fits the classic September Effect of weakness before Q4 rallies. What's your take? Bullish on ETH's rebound or sitting out the slump? Share in the comments!
EUR Futures analysis I am looking for to continuing compression at EUR futures (EurUsd) chart
According to Engulf of the lower flag limit; i am waiting for continue drop.
This analysis could mean that US inflation could spike again on Thursday's news.
We'll just have to wait and see.

Waiting for that next spark in Gold For now, TVC:GOLD price remains inside a couple triangle formations. We are waiting for the next big thing that could bring the precious metal out of its "shell" and send it upwards or downwards.
Let's dig in.
MARKETSCOM:GOLD
Let us know what you think in the comments below.
Thank you.
75.2% of retail investor accounts lose money when trading CFDs with this provider. You should consider whether you understand how CFDs work and whether you can afford to take the high risk of losing your money. Past performance is not necessarily indicative of future results. The value of investments may fall as well as rise and the investor may not get back the amount initially invested. This content is not intended for nor applicable to residents of the UK. Cryptocurrency CFDs and spread bets are restricted in the UK for all retail clients.
