I'm still long biased @ $XAUUSD (but deleveraging)Technical View
A potential bullish cup & handle pattern is forming, often seen as a continuation signal.
Price has already broken out of a bearish channel, which suggests that buyers have taken control.
Triangle and wedge formations point to pressure building upward.
The broader macro channel remains intact, so the larger trend has not been broken.
Clear invalidation levels are visible near 3,730 and 3,612, which provides trade structure from a technical perspective.
Overall, the technical picture continues to lean bullish.
Macro View
US CPI remains sticky while jobless claims are softening, hinting at stagflation dynamics.
The Federal Reserve is under pressure to cut rates, with real interest rates already negative.
Historically, when real rates are negative, gold tends to outperform bonds as a store of value.
Global central banks remain net buyers of gold as they diversify away from Treasuries.
This combination is similar to the 1970s stagflation backdrop: falling rates with inflation uncertainty often encouraged capital flows into gold.
Opinion
Technicals suggest upward momentum. Macro factors also support a bullish bias. The main caveat is that positioning in gold is already heavy, which can lead to sharp short-term volatility. Directionally, however, the long bias aligns with both the charts and the macro backdrop.
Disclaimer
This post reflects only my personal market observations and opinions, shared for educational and informational purposes. It should not be considered financial advice, investment recommendation, or a call to action. Trading financial markets involves risk, and you should carefully assess your own situation and risk tolerance before making any trading decisions. Past performance or historical patterns do not guarantee future results. Always do your own research and consult a licensed financial professional if needed.
Technical

#GOLD NewforcastOANDA:XAUUSD continues to climb upward channel.
If price holds above 3747, the breakout projection targets the zone above 3800 resistance.
risks:3747 - 3700
3800 My trigger profit - taking and short -term pullbacks.

USD/JPY(20250924)Today's AnalysisMarket Analysis:
Federal Reserve Chairman Powell stated that the policy rate remains somewhat restrictive, but allows the Fed to better respond to potential economic developments; tariffs are expected to have a one-time pass-through effect; and decisions will "never be based on political considerations." Fed spokespersons noted that Powell's comments indicate that he believes interest rates remain tight, potentially opening the door for further rate cuts.
Technical Analysis:
Today's Buy/Sell Levels:
147.66
Support and Resistance Levels:
148.13
147.95
147.84
147.49
147.37
147.20
Trading Strategy:
If the market breaks above 147.84, consider entering a buy position, with the first target price being 148.13.
If the market breaks below 147.66, consider entering a sell position, with the first target price being 147.49.

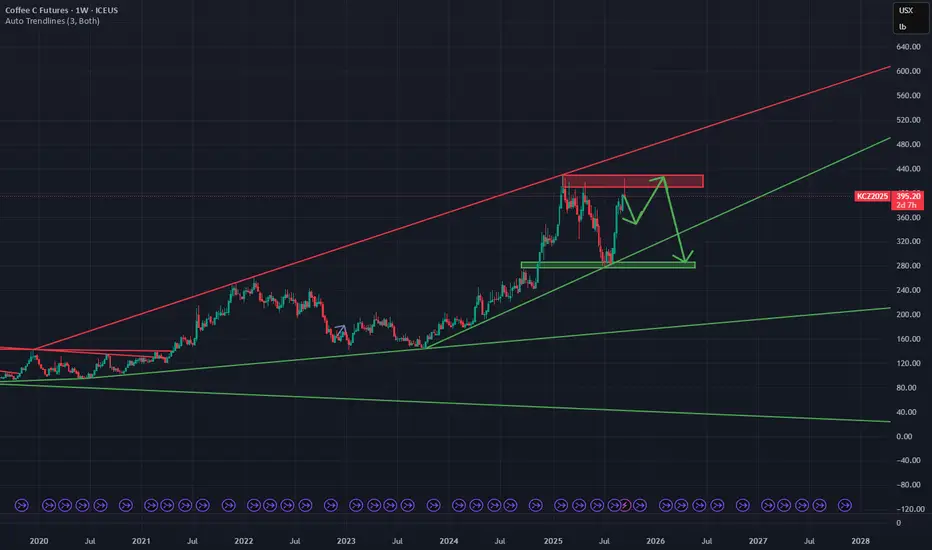
Short Arabica Coffee🔍 Setup
Price is approaching a well‐defined supply/resistance zone (red area on chart). Historically this zone has acted as overhead resistance.
Below, there is a green demand/support zone which should act as target support area.
My target on the short is around 7.8% downside from entry, with stop loss placed just above the resistance zone / recent swing high to limit risk.
📊 Fundamental & Sentiment Background (COT & Others)
According to the latest COT report (as of 9 Sep 2025), commercial hedgers are significantly net short in Coffee C.
tradingster.com
However, speculators / non-commercials are heavily net long. This suggests that bullish momentum is still in force.
tradingster.com
Open interest is rising, showing participation in current levels. This makes the risk of a breakout (to the upside) real, if bulls hold control.
⚠️ Risks to this trade
Momentum from speculators could drive price through resistance, triggering stop losses and a strong short squeeze.
Any unexpected fundamental shock (weather, export disruption, currency devaluation, etc.) could reduce supply or boost demand, pushing prices higher.
If volume doesn’t drop on advance into resistance, the upward move may be stronger than anticipated.
✅ Conditions / Trigger For Entry
I will consider entering the short position once:
Price touches or re-tests the red supply zone.
There's a clear rejection (candlestick reversal pattern + bearish confirmation).
Momentum or RSI / MACD divergence is visible.
Speculator net longs show signs of plateauing or declining in the COT (next report).
🎯 Targets & Risk/Reward
Entry: around current price near supply, or after confirmed rejection.
Stop Loss: just above resistance / recent high.
Target: green demand/support zone (approx. 7-8% downside).
Risk-Reward Estimate: aiming for at least 1.5-2x potential reward vs. risk, ideally better.
🧐 My Edge vs What Could Go Wrong
My trading strategy gives me an average short profit of 7.8%, so this is in line with my risk appetite. The probability for a profitable trade for a short position is 75%. However, on average I will lose 12% on a losing short trade.
But I’m aware shorting commodities is riskier when there's strong bullish positioning (as is the case with speculators now).
I will monitor upcoming COT reports and fundamentals closely — if speculators increase longs again, I might bail earlier or tighten stops.
Conclusion: The COT data does not overwhelmingly confirm a short at this moment. It offers partial support via hedger short positions, but speculator long bias remains strong. If price shows a credible technical rejection in the supply zone and sentiment shows cracks, I believe this short has good risk/reward.
Agape ATP Corporation (NASDAQ: ATPC) | Technical ReviewATPC has stabilised after earlier volatility, consolidating tightly between $1.20 (support) and $1.40 (near-term range ceiling). The chart shows repeated accumulation signals near support, suggesting steady buying interest. Momentum indicators are holding above midline levels, pointing to underlying strength despite the quieter price action.
A breakout above $1.60 (first resistance) could trigger renewed momentum towards $2.00 (major resistance), last tested in April–May. As long as $1.20 holds, the technical bias remains positive.
Investment Note
ATPC is in a constructive base-building phase. The downside appears limited by firm support at $1.20, while the upside potential is significant if it clears $1.60–2.00. With accumulation evident and volatility compressed, the stock offers a favourable risk-reward setup for speculative investors awaiting the next catalyst-driven move.

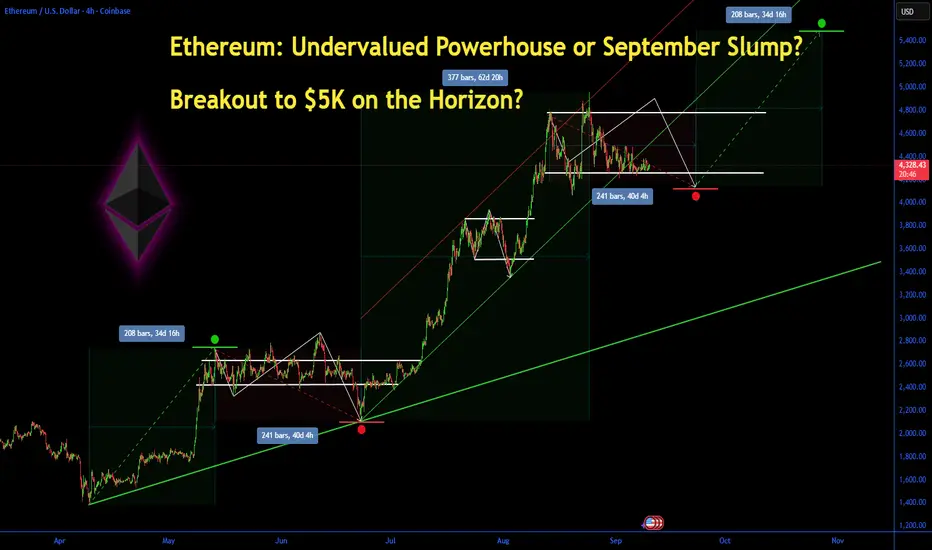
Ethereum: Undervalued Powerhouse or September Slump? Ethereum: Undervalued Powerhouse or September Slump? Breakout to $5K on the Horizon?
Ethereum (ETH) has held steady around $4,300 this month amid a choppy crypto market, down about 15% from its August all-time high but showing resilience with a modest 0.52% gain today to $4,328.5. Early September saw over $500 million in outflows from spot Ethereum ETFs, reversing summer inflows and fueling doubts about institutional appetite.
Yet, with analysts eyeing a potential rally to $9,000–$12,000 by year-end 2025 driven by ETF rotation and broader adoption, is ETH the undervalued blue-chip crypto ready for a rebound, or will seasonal weakness cap its upside? Let's dive into the fundamentals, charts, and key levels to navigate this pivotal moment.
Fundamental Analysis
Ethereum's core drivers remain tied to its ecosystem growth and macroeconomic tailwinds, but recent ETF flows have introduced volatility. As the backbone for DeFi, NFTs, and layer-2 scaling, ETH benefits from rising staking rewards and network upgrades like Dencun, which have boosted efficiency.
Analysts project ETH could hit $5,194 by late September, with long-term forecasts up to $12,000 in 2025 if institutional demand surges via ETFs. However, sticky inflation and Fed policy uncertainty could delay rate cuts, pressuring risk assets like crypto.
- **Positive:**
- Record ETF inflows in July–August signal growing institutional interest; recent positive territory returns hint at rotation back to ETH.
- Staking growth and adoption in DeFi (e.g., Aave, Uniswap) underscore undervaluation, with ETH's market cap at ~$520 billion versus Bitcoin's dominance.
- Broader trends like AI-blockchain integration and regulatory clarity (e.g., potential spot ETFs for challengers like Sui) bolster ETH's utility.
- **Negative:**
- $500M+ ETF outflows in early September reflect profit-taking and risk-off sentiment amid U.S. labor market weakness.
- Seasonal September weakness in crypto, compounded by geopolitical risks, could extend the correction if Bitcoin falters.
Technical Analysis
On the daily chart, ETH is coiling in a tight symmetrical triangle pattern after bouncing from the $4,320–$4,325 support base, with volume picking up on the upside. This consolidation follows a descending channel breakdown, but the hold above key EMAs suggests building momentum for a potential impulse wave higher. Current price: $4,328.5, with VWAP at $4,300 providing intraday support.
Key indicators:
- **RSI (14-day):** Hovering at 48, neutral but nearing oversold territory— a dip below 40 could signal a strong bounce. 📈
- **MACD:** Histogram in negative territory, but the signal line crossover is imminent, hinting at bullish divergence if volume confirms. ⚠️
- **Moving Averages:** Price above the 21-day EMA ($4,280) but testing the 50-day SMA ($4,350)—a sustained hold here avoids short-term bearish pressure.
Support/Resistance: Firm support at $4,320 (recent low and 200-day EMA), with major resistance at $4,500 (August high). Patterns/Momentum: The triangle apex nears; a bullish breakout above $4,500 could target $4,800–$4,952, while failure risks a retest of $4,200. 🟢 Bullish signals: Accumulation on hourly charts. 🔴 Bearish risks: Death cross if 50-day SMA flips below 200-day.
Scenarios and Risk Management
- **Bullish Scenario:** A clean break above $4,500 on ETF inflow news or positive macro data (e.g., softer PCE) targets $4,800 initially, then $5,000–$9,000 by Q4. Buy on pullbacks to $4,320 support for optimal entry.
- **Bearish Scenario:** Drop below $4,320 eyes $4,200 (psychological level); a full death cross could accelerate to $3,800. Avoid longs if Bitcoin slips under $60K.
- **Neutral/Goldilocks:** Range-bound $4,200–$4,500 if data remains mixed, ideal for scalping or options plays.
Risk Tips: Set stops 2–3% below support ($4,200) to cap losses. Risk no more than 1–2% of portfolio per trade. Diversify with BTC or stablecoins to hedge crypto correlations—avoid overexposure in this volatile September.
Conclusion/Outlook
Overall, a bullish bias emerges if ETH reclaims $4,500 and ETF flows reverse, positioning it as an undervalued play with 100%+ upside potential into 2025 amid institutional rotation.
But watch today's crypto volatility and upcoming Fed signals for confirmation—this fits the classic September Effect of weakness before Q4 rallies. What's your take? Bullish on ETH's rebound or sitting out the slump? Share in the comments!
Further rate cuts by the Fed could boost gold prices again.Gold prices fell on profit-taking after hitting a record high in the previous session as markets assessed the US Federal Reserve’s stance on further interest rate cuts.
The Fed on Wednesday made its first rate cut since December and left the door open for further easing, but warned of persistent inflation, raising doubts about the pace of future policy adjustments.
Gold, which typically performs well in low-interest-rate environments and periods of uncertainty, has gained nearly 39% so far this year.
In the short term, gold prices are under pressure to take profits after a series of consecutive increases in recent days and the market has reflected this in the price movements. However, in the long term, the Fed's further interest rate cuts - and the weakening USD - could push gold prices up again.

EUR Futures analysis I am looking for to continuing compression at EUR futures (EurUsd) chart
According to Engulf of the lower flag limit; i am waiting for continue drop.
This analysis could mean that US inflation could spike again on Thursday's news.
We'll just have to wait and see.

likely rebound; breaking below → retest of 3,418 support.1. Overall Trend
Gold has just experienced a very strong rally, creating a peak around 3,674 – 3,675.
After touching the red resistance trendline, price showed signs of reversal and is now in a correction.
The structure looks like an ABC corrective wave (Elliott/Zigzag type).
2. Key Fibonacci Levels
Fibonacci is drawn from the latest swing low to the new high, important levels are:
0.382: 3,418 – overlaps with a strong support zone (purple box).
0.5: 3,468 – psychological midpoint, potential buy zone.
0.618: 3,516 – golden ratio, often a strong reversal point.
0.786: 3,586 – if broken decisively, price may retest the strong support around 3,418.
3. Possible Scenarios
Scenario 1 (main):
Price corrects down to the Fib 0.618–0.786 (3,516 – 3,586) area, then bounces higher. This is a “buy on dip” zone if reversal signals appear.
Scenario 2 (bearish):
If selling pressure is strong, price could break lower and head toward the major support around 3,418 – 3,420 (confluence of Fib 0.382 and prior structure support).
Scenario 3 (less likely):
Price holds above the dotted trendline → retests 3,674. But this scenario has lower probability since a corrective pattern is forming.
4. Short-Term Trading Suggestions
Buy strategy: Wait for price to reach 3,516 – 3,586 and look for bullish reversal signals (pin bar, engulfing). Stop loss below 3,500.
Sell strategy: If price breaks below 3,586 with strong momentum/volume, short-term sell targets are 3,516 – 3,468.
👉 In summary: Gold is in a corrective phase after a sharp rally. The 3,516 – 3,586 zone will decide the short-term direction. Holding above it → likely rebound; breaking below → retest of 3,418 support.

EURCHF | Tech. 4h.Hello "Forexadors". It's Nika.
First thing to say, the current price mark is mostly supporting "the bull's" zone...
With this chart pattern, sure, we may predict the price will go down to check lower level.
But understand that this zone is a bull zone. I mean, it is so strong support levels.
What is your opinion?!
Have a good day!

All eyes on the PCE todayWatching the US dollar reaction carefully today.
TVC:DXY
MARKETSCOM:DOLLARINDEX
Let us know what you think in the comments below.
Thank you.
75.2% of retail investor accounts lose money when trading CFDs with this provider. You should consider whether you understand how CFDs work and whether you can afford to take the high risk of losing your money. Past performance is not necessarily indicative of future results. The value of investments may fall as well as rise and the investor may not get back the amount initially invested. This content is not intended for nor applicable to residents of the UK. Cryptocurrency CFDs and spread bets are restricted in the UK for all retail clients.

DAX is forming an interesting short-term patternLooking at the technical picture of DAX, we can see that the German index seems to be preparing for a breakout. Maybe Powell's speech could be that catalyst? Let's find out.
XETR:DAX
MARKETSCOM:DE30
Let us know what you think in the comments below.
Thank you.
75.2% of retail investor accounts lose money when trading CFDs with this provider. You should consider whether you understand how CFDs work and whether you can afford to take the high risk of losing your money. Past performance is not necessarily indicative of future results. The value of investments may fall as well as rise and the investor may not get back the amount initially invested. This content is not intended for nor applicable to residents of the UK. Cryptocurrency CFDs and spread bets are restricted in the UK for all retail clients.

Waiting for that next spark in Gold For now, TVC:GOLD price remains inside a couple triangle formations. We are waiting for the next big thing that could bring the precious metal out of its "shell" and send it upwards or downwards.
Let's dig in.
MARKETSCOM:GOLD
Let us know what you think in the comments below.
Thank you.
75.2% of retail investor accounts lose money when trading CFDs with this provider. You should consider whether you understand how CFDs work and whether you can afford to take the high risk of losing your money. Past performance is not necessarily indicative of future results. The value of investments may fall as well as rise and the investor may not get back the amount initially invested. This content is not intended for nor applicable to residents of the UK. Cryptocurrency CFDs and spread bets are restricted in the UK for all retail clients.

ETHFI ANALYSIS🔮#ETHFI Analysis 💰💰
#ETHFI is trading in a symmetrical triangle in a weekly time frame and if it breakouts with high volume then we can see a bullish momentum in #ETHFI. Before that we will see little bit bearish movement towards its support zone and that a bullish movement.
🔖 Current Price: 1.218
⏳ Target Price: $1.608
⁉️ What to do?
- We can trade according to the chart and make some profits in #ETHFI. Keep your eyes on the chart, observe trading volume and stay accustom to market moves.💲💲
🏷Remember, the crypto market is dynamic in nature and changes rapidly, so always use stop loss and take proper knowledge before investments.
#ETHFI #Cryptocurrency #Pump #DYOR

NASDAQ Short This is at the all-time high, showing a lot of resistance
There is an AABCD pattern on H1
All timeframes are overbought
There are multiple tops on M15 and M30 with divergence
Stop loss of 150 pips

JPN225 ShortThis trade has massive resistance as it is at the all time high
There is a massive Bat pattern on H4
All timeframes are overbought
There is a head and shoulders present on M30 and H1
Massive divergence
stoloss of 250 pips

USD/JPY(20250807)Today's AnalysisMarket News:
Federal Reserve Chairman Kashkari: A rate cut may be appropriate in the short term, and two rate cuts this year are reasonable. Trump: The new Fed governor will likely be temporary, and the appointment will be announced within 2-3 days.
Technical Analysis:
Today's Buy/Sell Levels:
147.40
Support and Resistance Levels:
148.30
147.96
147.74
147.05
146.83
146.49
Trading Strategy:
If the market breaks above 147.40, consider a buy entry, with the first target price being 147.74. If the market breaks below 147.05, consider a sell entry, with the first target price being 146.83

USD/JPY(20250804)Today's AnalysisMarket News:
① The US non-farm payrolls rose by 73,000 jobs in July, far below the expected 110,000; the previous two months saw a significant downward revision of 258,000 jobs, prompting traders to fully price in two Fed rate cuts before the end of the year.
② The US ISM Manufacturing PMI for July unexpectedly fell to 48, below the expected 49.5 and the lowest level since October 2024.
③ The University of Michigan Consumer Confidence Index for July reached a five-month high.
Technical Analysis:
Today's Buy/Sell Levels:
148.53
Support and Resistance Levels:
152.12
150.78
149.91
147.15
146.28
144.94
Trading Strategy:
If it breaks above 148.53, consider entering a buy position, with the first target price being 149.91. If it breaks below 147.15, consider entering a sell position, with the first target price being 146.28.

SAHARA ANALYSIS🔮 #SAHARA Analysis 💰💰
📊 #SAHARA is making perfect and huge rounding bottom pattern in daily time frame, indicating a potential bullish move. If #SAHARA retests little bit and breakout the pattern with high volume then we will get a bullish move📈
🔖 Current Price: $0.1043
⏳ Target Price: $0.1062 and above
⁉️ What to do?
- We have marked crucial levels in the chart . We can trade according to the chart and make some profits. 🚀💸
#SAHARA #Cryptocurrency #Pump #DYOR

POSSIBLE BEARISH CONTINUATION ON GOLDBased on price action, Gold presents a very bearish sentiment from the daily point of view.
The indicated supply region may be the area of interest for the build up of the sells if indeed Gold is bound for the monthly lows.
Confirmation is needed for an entry.

USD/JPY(20250729)Today's AnalysisMarket news:
After gold prices soared to an all-time high of more than $3,500 an ounce in April, the latest report from the Commodity Futures Trading Commission (CFTC) showed that fund managers have increased their bullish bets to the highest level in 16 weeks.
Technical analysis:
Today's buy and sell boundaries:
148.19
Support and resistance levels:
149.23
148.84
148.59
147.78
147.53
147.14
Trading strategy:
If the price breaks through 148.59, consider buying, the first target price is 148.84
If the price breaks through 148.19, consider selling, the first target price is 147.78

USD/JPY(20250728)Today's AnalysisMarket news:
Trump announced that the US and Europe reached a trade agreement: 15% tariffs on the EU, $600 billion in investment in the US, zero tariffs on the US by EU countries, the EU will purchase US military equipment, and will purchase US energy products worth $750 billion. However, the US and Europe have different opinions on whether the 15% tariff agreement covers medicines and steel and aluminum. Von der Leyen: 15% tariff rate is the best result that the European Commission can achieve.
US Secretary of Commerce: The deadline for tariff increase on August 1 will not be extended. The United States will determine the tariff policy on chips within two weeks.
Technical analysis:
Today's buying and selling boundaries:
147.47
Support and resistance levels:
148.58
148.17
147.90
147.04
146.77
146.35
Trading strategy:
If the price breaks through 147.90, consider buying, the first target price is 148.17
If the price breaks through 147.47, consider selling, the first target price is 147.04

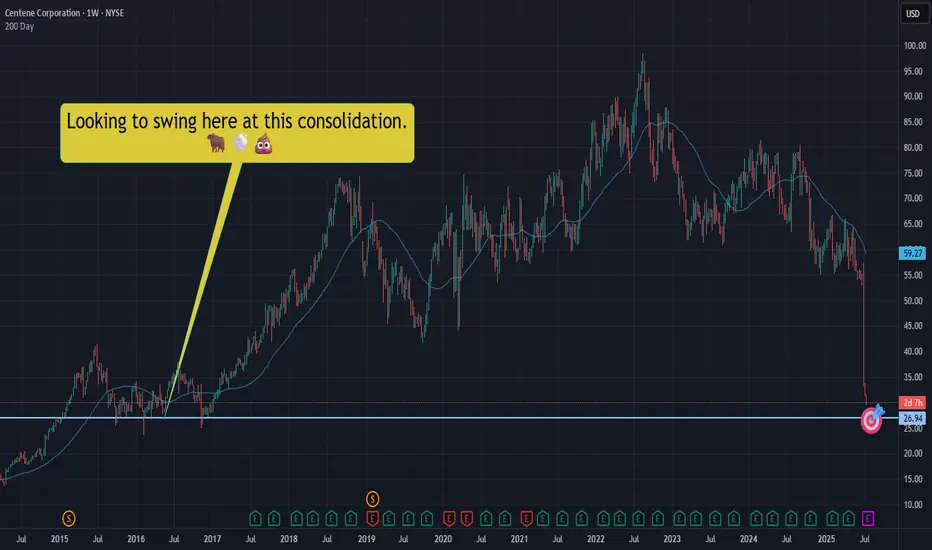
CNC|Let's take a swing at a falling dagger! NYSE:CNC slicing through the void, well.... like a falling dagger through a void.
Not trying to catch this bad boi, but we should expect a bounce at some point. Let's swing for a bounce in that $26.90ish area.
This is NOT a YOLO and I hope it's not an "oh no!" Let's keep our wits about us - starter position only. We can add if we need to, but let's just hope we sell and make some quick Christmas money.
THANK YOU FOR YOUR ATTENTION ON THIS MATTER