Can NASDAQ Hold 24,600 and Push to New Highs?Hey Traders, in tomorrow’s trading session we are monitoring NAS100 for a potential buying opportunity around the 24,600 zone. NASDAQ remains in an uptrend and is currently in a correction phase, with price approaching a key support/resistance level at 24,600.
Structure: The broader trend is bullish, with price moving within an ascending channel.
Key level in focus: 24,600 — a critical support area aligning with the lower boundary of the channel.
Next move: Holding above this level could set the stage for a rebound toward 25,100, which represents the channel’s upper resistance and potential higher high formation.
Trade safe,
Joe.
Technical Analysis

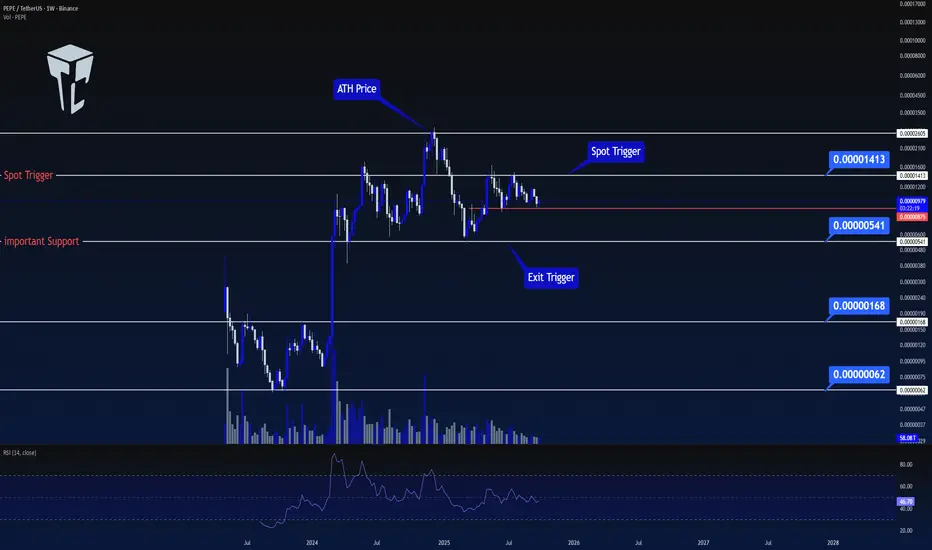
TradeCityPro | PEPEUSDT a trigger ready for buying👋 Welcome to TradeCityPro Channel!
Let’s move on to the analysis of PEPEUSDT a trigger ready for buying.
We’re analyzing the most popular meme coin in the current market PEPE, which lately has been taking steps to increase its value and move beyond being just an online joke.
🌐 Overview of Bitcoin
Before starting the analysis, let me remind you that we moved the Bitcoin analysis section to a separate daily report at your request, so we can discuss Bitcoin’s condition, price action, and dominance in more detail
📊 Weekly Timeframe
After breaking the 0.00000168 level, PEPE experienced a strong upward rally and recorded a new ATH at 0.00002605. Currently, the price is holding around the 0.00000875 support.
If you entered from lower levels, it’s a good time to take profits and secure gains.
If your entry was around the current area, the active stop-loss should be set below 0.00000541
🕐 Next Entry Plan
For re-entry, patience is required. Wait and observe the chart in weekly and daily timeframes we might see a fake breakout around this support.
However, the main trigger for a new entry will be a confirmed breakout above 0.00001413, ideally with strong volume to confirm the move.
📝 Final Thoughts
Stay calm, trade wisely, and let's capture the market's best opportunities!
This analysis reflects our opinions and is not financial advice.
Share your thoughts in the comments, and don’t forget to share this analysis with your friends! ❤️
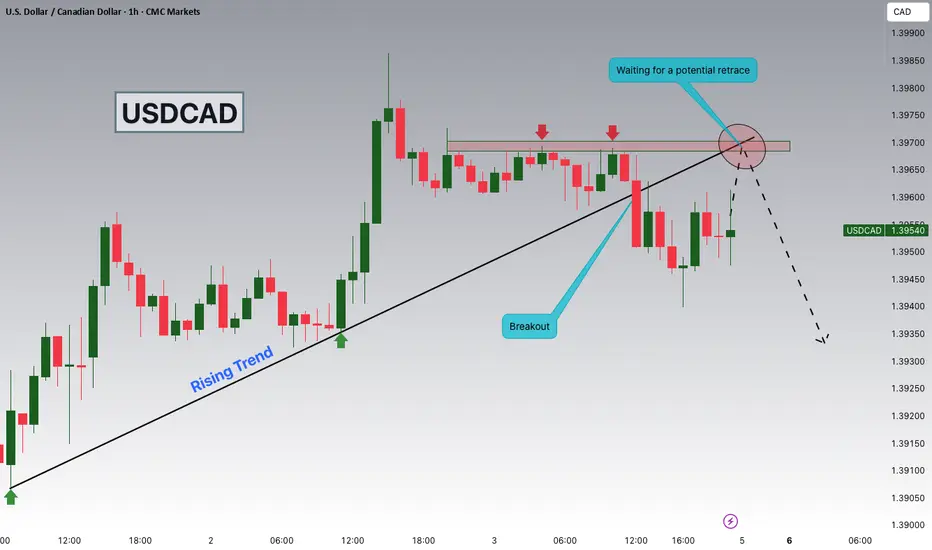
USDCAD Breakout and Potential RetraceHey Traders, in tomorrow's trading session we are monitoring USDCAD for a selling opportunity around 1.39700 zone, USDCAD was trading in an uptrend and successfully managed to break it out. Currently is in a correction phase in which it is approaching the retrace area at 1.39700 support and resistance area.
Trade safe, Joe.
BTC/USDT | BTC Uptober Begins – Massive Rally Loading!By analyzing the Bitcoin chart on the 4-hour timeframe, we can see that the price moved exactly as expected — it hit the $118,000 target and even rallied up to $123,900 . After reaching this key supply zone, which we had marked earlier, BTC faced selling pressure and is now trading around $121,800.
If Bitcoin can hold and stabilize above $120K , we could see a new ATH soon ! “Uptober” has just begun, and it looks like we’re in for a strong bullish month. The next upside targets are $125K, $132K, and $138K.
Please support me with your likes and comments to motivate me to share more analysis with you and share your opinion about the possible trend of this chart with me !
Best Regards , Arman Shaban

EURUSD: Support & Resistance Analysis for Next Week 🇪🇺🇺🇸
Here is my latest structure analysis and important supports & resistances
for EURUSD for next week.
Consider these structures for pullback/breakout trading.
❤️Please, support my work with like, thank you!❤️
I am part of Trade Nation's Influencer program and receive a monthly fee for using their TradingView charts in my analysis.

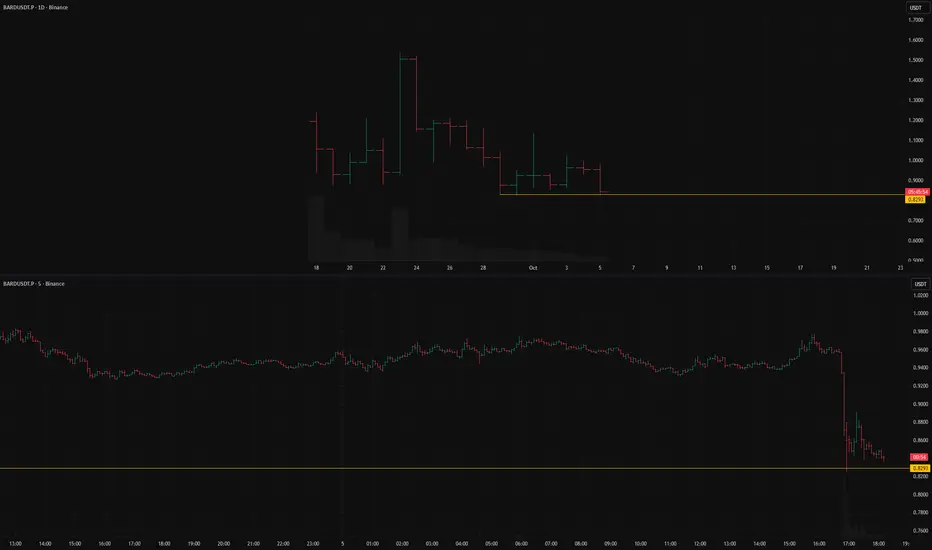
BARDUSDT.P short setup from daily support at 0.8293BINANCE:BARDUSDT.P has cleanly tested the 0.8293 level.
This level is the All-Time Low, which was the stopping point of the drop from the All-Time High.
There is a high probability that we will next see a consolidation followed by a breakdown of this level.
I really like these kinds of setups.
Key factors for this scenario:
Global & local trend alignment
Price void / low liquidity zone beyond level
Volatility contraction on approach
Momentum stall at the level
Immediate retest
No reaction after a false break
Was this analysis helpful? Leave your thoughts in the comments and follow to see more.
AUDUSD Eyes 0.65900 as Gold Nears Record HighHey Traders, in the coming week we are monitoring AUDUSD for a potential buying opportunity around the 0.65900 zone. AUDUSD remains in an uptrend and is currently in a correction phase, with price moving toward this key support/resistance level.
Structure: The broader bias is bullish, with price retracing toward trend support.
Key level in focus: 0.65900 — an important area where buyers may look to re-enter.
Fundamentals: Gold continues to rise and is nearing a fresh ATH, supported by a bearish US Dollar bias. Given the positive correlation between AUDUSD and Gold, further upside on the pair remains likely.
Next move: Monitoring price reaction at 0.65900 to assess whether the trend resumes higher.
Trade safe,
Joe.

NZDUSD: Waiting for a Fall! 🇳🇿🇺🇸
NZDUSD will most likely complete a correctional movement soon.
The price continues retesting a recently broken major structure
and the pair is already close to its upper boundary.
Be ready for a strong bearish movement from that.
Next support - 0.57
❤️Please, support my work with like, thank you!❤️
I am part of Trade Nation's Influencer program and receive a monthly fee for using their TradingView charts in my analysis.

XAUUSD NEXT POSSIBLE MOVE Gold is currently holding near a key support zone.
If price respects this level and maintains strength above the support, we may possibly see a bullish reaction in the coming sessions.
However, if momentum weakens or breaks below this zone, a deeper correction could follow.
Traders should wait for clear confirmation before entering any positions.
Overall sentiment currently leans slightly bullish, as long as price remains stable above the support zone.

TSLA Roadmap: $563 ABCD Compl → Bat Harmonic → $631 Three-DriveTesla (TSLA) appears to be completing its final impulsive wave toward the $563 region, which also aligns with the D point completion of the ABCD harmonic pattern.
Once this move is finished, the expectation is for a corrective phase that forms a Bat harmonic. This retracement would also work to fill in the untested gaps left behind during the recent rally, with a potential bottom around the 78.6% Fibonacci level.
From there, the next bullish leg could initiate, targeting the 127.2% extension at $631. This move would not only confirm the harmonic reversal but also complete a larger Three-Drive pattern that originates from the initial ABCD structure.
Key Levels to Watch:
ABCD Harmonic D point: ~$563
Bat Harmonic completion zone: ~78.6% retracement
Next rally target: $631 (127.2% extension, Three-Drive pattern confirmation)
Invalidation Scenarios:
A clean breakout above $563 without corrective rejection would invalidate the Bat harmonic setup and suggest an extended bullish run.
A failure to hold above ~$367 (channel/structure support) would weaken the harmonic roadmap and risk a deeper bearish continuation instead of a Three-Drive completion.
This roadmap suggests a critical short-term top before a deeper correction sets the stage for a much larger rally.

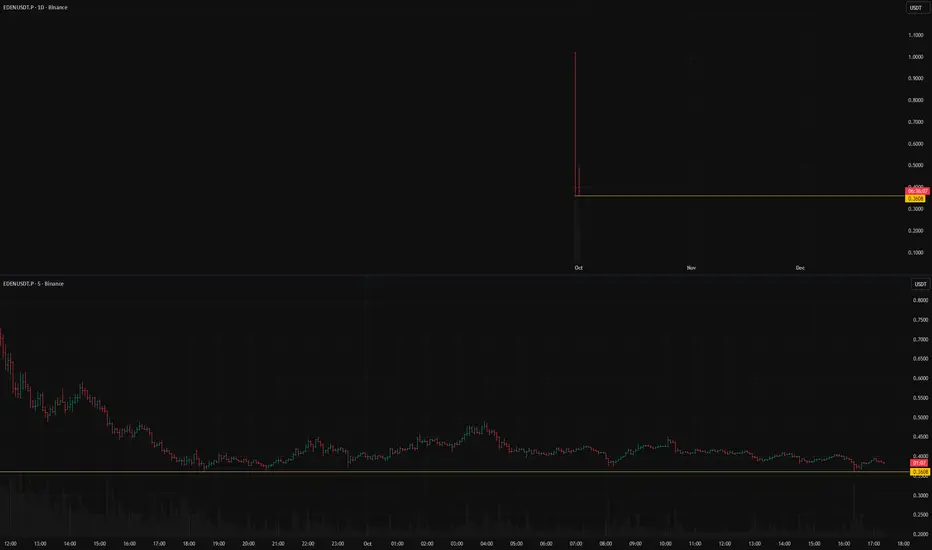
EDENUSDT.P short setup from daily support at 0.3608After its listing, BINANCE:EDENUSDT.P has been moving down and has currently stopped at a level that has already been clearly confirmed.
At the moment, we have a combination of favorable factors for a short: a downtrend, an absence of strong buyers, good volatility, and consolidation.
All that remains is to wait for YOUR OWN entry point according to your trading system.
An important condition is that volatility does not increase as the price approaches the level.
Key factors for this scenario
Global & local trend alignment
Price void / low liquidity zone beyond level
Volatility contraction on approach
Prolonged consolidation
Was this analysis helpful? Leave your thoughts in the comments and follow to see more.
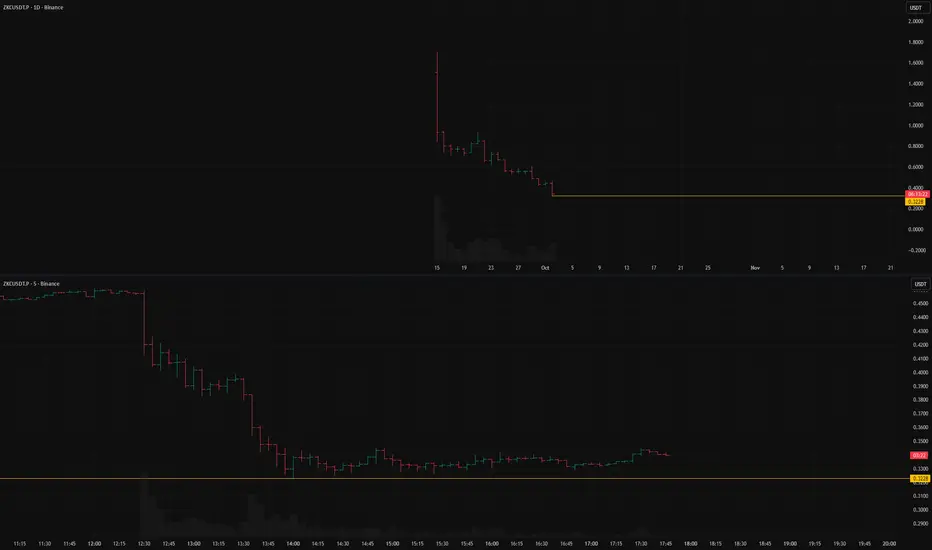
ZKCUSDT: short setup from daily support at 0.3228BINANCE:ZKCUSDT.P has been falling almost continuously since its listing, with short pauses.
Right now, after another downward impulse, I see a pause. This consolidation could last for a day or for several—it's impossible to predict.
However, a clear tendency is visible on the chart: drop → consolidation → drop.
Key factors for this scenario
Global & local trend alignment
Price void / low liquidity zone beyond level
Asset decoupled from the market (relative strength/weakness vs. BTC)
Was this analysis helpful? Leave your thoughts in the comments and follow to see more.
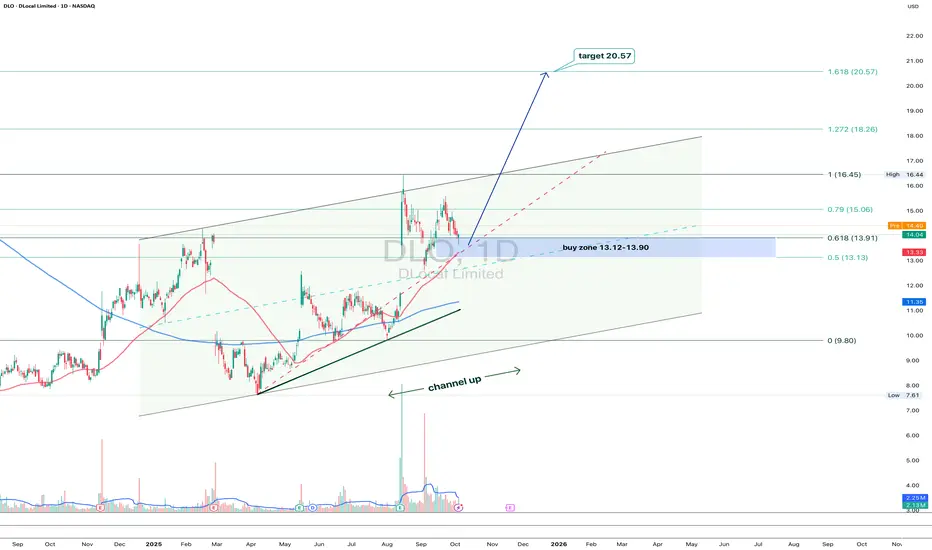
DLO 1D: steady within the channel, eyes on $20+On the daily chart, DLocal keeps trading inside a clean upward channel. After a strong leg up, price is pulling back toward the 13.12–13.90 buy zone - a confluence of the 0.5–0.618 Fibonacci retracement and the channel’s lower boundary.
As long as both MA50 and MA200 stay below price, buyers remain in control. Volume expansion supports the idea of another bullish swing ahead.
First resistance is near $16.45, with the broader target sitting at $20.57 - the 1.618 Fibonacci extension.
From a fundamental standpoint, DLocal keeps strengthening its presence in emerging markets. The fintech theme is still alive, and this setup looks like a calm pullback before another push higher.
In short - wait for confirmation around support, then let the trend do the heavy lifting. Just remember: even the cleanest channels have bumps along the road
Gold Holds 3,900 Support Amid Dollar Slowdown and Global TensionHey Traders, in today’s session we’re closely monitoring XAUUSD for a potential buying opportunity around the 3,900 zone. Gold continues to trade within a strong uptrend, and the current pullback appears to be a healthy correction approaching key trend support.
Structure: The broader trend remains bullish, with price consolidating after its recent highs. The 3,900 level stands out as a technical pivot where buyers could regain control.
Macro context: The US Dollar Index is approaching major daily resistance around 98.300, suggesting potential exhaustion in the current USD rebound. Meanwhile, political and fiscal developments in Japan where a notably dovish administration has just taken power could further support demand for safe-haven assets like Gold.
Market sentiment: A combination of fiscal expansion abroad and rising uncertainty surrounding the ongoing US government shutdown is fueling risk aversion. If these pressures persist, Gold could retest the 4,000 zone sooner than expected.
Key focus: Watching how price reacts around 3,900 for potential bullish continuation in line with the broader trend.
Trade safe,
Joe.

Tesla (TSLA) – Final Wave 5 to Complete Cypher HarmonicTesla is progressing through its final impulsive Wave 5, with upside targets aligning at $563–$564, confluencing with the 1.272–1.618 Fib extensions and the completion of the Cypher harmonic (point D). Once this target is reached, a corrective decline is anticipated, forming the Cypher retracement and potentially filling untested gaps below.
Key levels to watch:
Upside target: $488.5, then $563–$564 zone (Cypher completion).
Downside retracement: possible move back toward the $350–$360 region (0.618–0.786 support).
Invalidation:
A breakout above $565 would invalidate the Cypher completion zone and suggest extended bullish continuation.
A breakdown below $400 before reaching $488 invalidates the Wave 5 structure.
This scenario blends Elliott Wave 5 projections with harmonic Cypher confluence for a potential high-probability setup.

MPWR 1D: shoulders are squared and the battery's still fullMonolithic Power Systems broke out of a long-term descending trendline after completing a clean inverse head and shoulders. Now the price is pulling back into the 705–688 zone — a textbook retest area that combines the neckline, the 0.705–0.79 Fib levels, and a major volume shelf. Add to that a golden cross (EMA50 crossing EMA200 from below) and we have a solid technical foundation for continuation. Volume on the pullback is low, indicating no panic, just rotation. If 688 holds, the next levels to watch are 755.66 and 952.17 — the latter being the 1.618 Fib extension. Tactical setup: look for a reversal signal between 705–688, with a stop just below 661. As long as price holds this zone, the bullish structure remains intact.
Fundamentally, MPWR remains one of the strongest names in the semiconductor space. With over $1.5B in annual revenue and industry-leading margins, the company continues to see strong demand from data center and EV sectors. In its latest report, management highlighted accelerating orders from Tier‑1 manufacturers. The balance sheet is clean, with zero debt, and ongoing buybacks provide downside support. In a sector full of volatility, MPWR stands out with both structural reliability and technical clarity - making it a strong candidate for long-term positioning.
If this textbook pattern plays out, the train’s just leaving the station. The best seat is usually the one taken before the doors close.

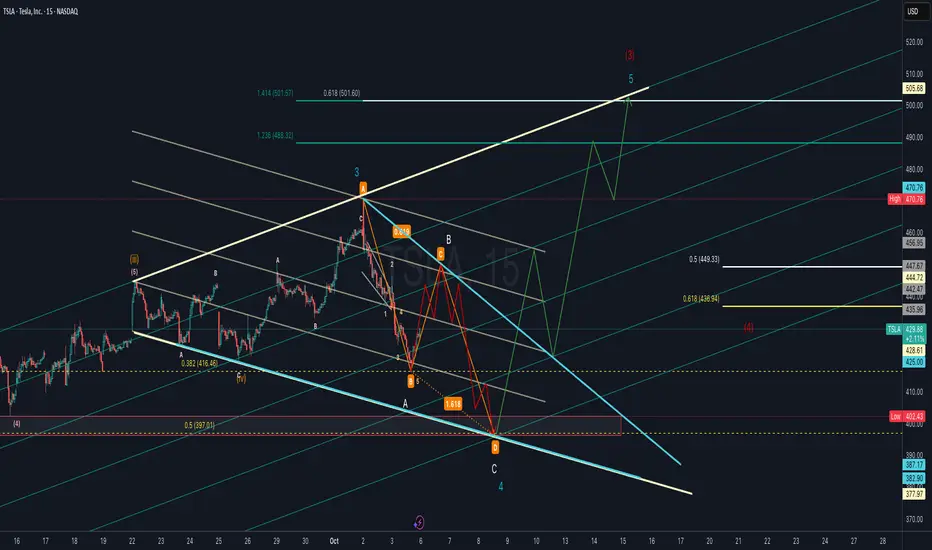
TSLA Elliott Wave Count with ABC Harmonic or Flat Corrective Tesla (TSLA) is forming a potential Wave 4 correction that aligns with an ABC harmonic structure. Price action suggests a possible deeper retracement into the 0.5–0.618 Fibonacci support zone (436–449 area) before resuming its larger uptrend.
If Wave 4 completes near the harmonic “D” zone (highlighted support box), the next leg higher could target the 1.236–1.414 Fibonacci extensions around 488–501, in line with Wave 5 projection.
Key levels to watch:
Support: 436.9 (0.618 retrace), 425 psychological, 397 strong support.
Resistance: 444.7, 470.8 (previous high), 501–505 (Wave 5 target).
Bullish scenario: Wave 4 completes soon, leading to a strong Wave 5 breakout towards 500+.
Bearish scenario: Breakdown below 425–397 support could invalidate the bullish count and extend correction lower.
The other possibility is that it is actually unfolding a flat correction in Wave 4 after completing Wave 3 near the recent high. The structure suggests price may continue to consolidate within the corrective channel before setting up the next impulse leg.
Bullish scenario: Flat correction completes, setting the stage for Wave 5 rally toward 490–505.
Bearish scenario: Breakdown below 397 invalidates the bullish count and signals deeper retracement.
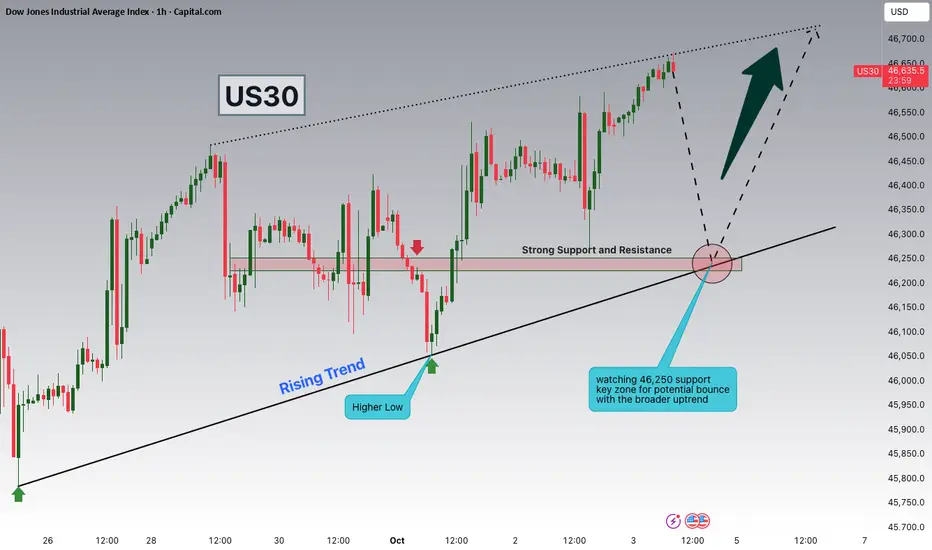
Dow Jones Watching 46,250 Support for Potential ContinuationHey Traders, in today’s trading session we are monitoring US30 for a potential buying opportunity around the 46,250 zone. The Dow Jones is trading in an uptrend and currently in a correction phase, with price moving toward this key support/resistance level.
Structure: The broader trend remains bullish, with pullbacks serving as corrections within the uptrend.
Key level in focus: 46,250 — an important support zone where price could stabilize and attract buyers.
Next move: Holding above 46,250 could open the door for continuation toward higher highs, while a breakdown would suggest a deeper retracement.
Trade safe,
Joe.
Gold (XAU/USD) Bullish Reversal Setup with Short-Term ?✅ Trade Setup Summary:
Trade Type: Long (Buy)
Entry: Around $3,860.17
Stop Loss: $3,850.01
Take Profit Levels:
TP1: $3,870.32 (minor resistance)
TP2: $3,872.93 (next significant resistance)
TP3: $3,875.01 (potential breakout target)
TP4 (Extended): $3,880.01 (final target zone)
🔍 Technical Observations:
Reversal Pattern: After a steep drop, the price is showing signs of a bullish reversal with a series of higher lows.
Support Level: The $3,850.01 area acted as a strong support zone.
Bullish Momentum: Green candles dominating the recent session show buyers regaining control.
Resistance Zones: Blue dotted lines indicate key resistance levels where price may face selling pressure.
Risk-Reward Ratio: The current setup offers a favorable risk-reward, especially if price breaks $3,870.
📌 Conclusion:
This is a bullish short-term trade setup in Gold, targeting a move toward the previous resistance levels after a recovery from the $3,850 support zone. Confirmation of bullish momentum above $3,870 could open the door for further upside.

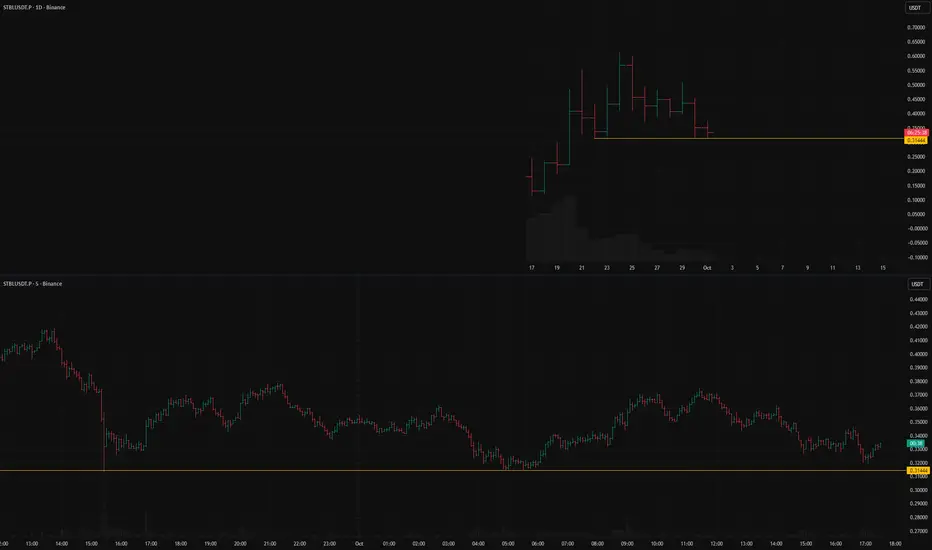
STBLUSDT.P short setup from daily support at 0.31444For the second day in a row, BINANCE:STBLUSDT.P is confirming the strength of the level with clean tests.
Below this level, there are no nearby obstacles that could complicate the asset's fall.
Therefore, it is worth waiting for your own entry point, while carefully monitoring the volatility, as always.
Key factors for this scenario
Price void / low liquidity zone beyond level
Volatility contraction on approach
Immediate retest
Prolonged consolidation
Repeated precise tests of the level
Was this analysis helpful? Leave your thoughts in the comments and follow to see more.
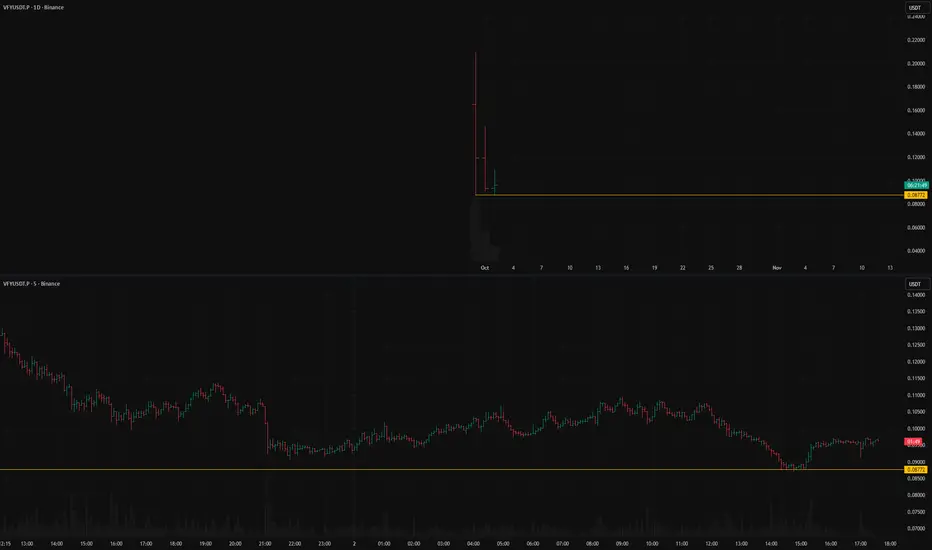
VFYUSDT.P: short setup from daily support at 0.08772BINANCE:VFYUSDT.P has a strong level—its All-Time Low.
Below it, there are no support levels that could slow the decline, so the fall could be very sharp.
Today, there was a good test of the level: the price came right up to it, consolidated on low volatility, confirming it cleanly, and then made a weak pullback.
This weak pullback signals an absence of buyers who might "save" the asset, which is why there could be a good short opportunity here.
Key factors for this scenario
Global & local trend
Price void / low liquidity zone beyond level
Asset decoupled from the market (relative strength/weakness vs. BTC)
Volatility contraction on approach
Immediate retest
Prolonged consolidation
No reaction after a false break Was this analysis helpful? Leave your thoughts in the comments and follow to see more.
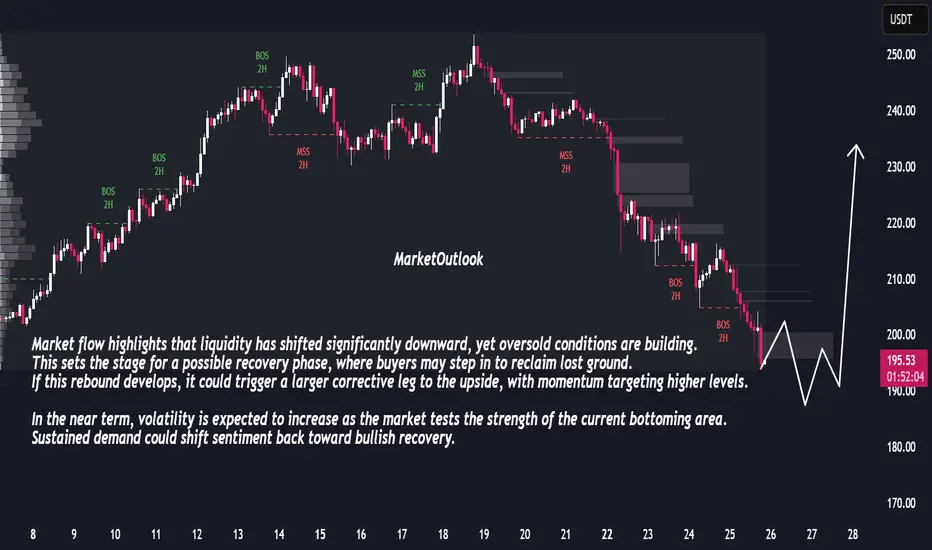
Bullish Reversal Ahead: Market Prepares for Sharp RecoveryThe market has been under consistent selling pressure, with a clear sequence of bearish breaks in structure confirming downside control. Price has now entered a zone where momentum shows signs of slowing, suggesting potential exhaustion in the recent decline. The sharp extension lower indicates that sellers may be reaching a short-term limit, creating conditions for a corrective rebound.
Market flow highlights that liquidity has shifted significantly downward, yet oversold conditions are building. This sets the stage for a possible recovery phase, where buyers may step in to reclaim lost ground. If this rebound develops, it could trigger a larger corrective leg to the upside, with momentum targeting higher levels.
In the near term, volatility is expected to increase as the market tests the strength of the current bottoming area. Sustained demand could shift sentiment back toward bullish recovery.
XAU/USD | Gold Volatility High – Correction or New Rally? (READ)By analyzing the gold chart on the 1-hour timeframe, we can see that after climbing to $3,897 yesterday, the price sharply corrected down to $3,819. From this demand level, gold rebounded and filled the liquidity gap, rallying up to $3,890.5.
Right after touching this key supply zone, heavy selling pressure pushed the price down to $3,866. Currently, gold is trading around $3,878, and we need to see if it can hold below $3,883. If it stabilizes under this level, we can expect a deeper correction. This analysis will be updated soon — don’t forget your support, friends!
Please support me with your likes and comments to motivate me to share more analysis with you and share your opinion about the possible trend of this chart with me !
Best Regards , Arman Shaban
