BTC Is Quiet… That’s When Explosions Begin.BITCOIN (BTC/USD) – 1H MARKET ANALYSIS
1. Current Market Structure
Bitcoin has completed a sharp bearish impulse, followed by a clear range based consolidation inside a defined demand zone. Price is no longer making lower lows aggressively, indicating selling pressure has been absorbed. The market is transitioning from distribution into accumulation on the 1H timeframe.
Key observation:
- Strong impulsive drop → liquidity grab
- Sideways compression → energy building phase
This is not random ranging it is structured consolidation after a sell-off.
2. Key Zones & Liquidity Mapping
Demand / Accumulation Zone: ~85,200 – 86,300
→ Area where buyers are actively defending and absorbing sell orders.
Mid Resistance: ~87,700 – 88,000
→ First reaction zone once price breaks the range.
Major Resistance / Target: ~89,800 – 90,000
→ Prior supply + liquidity resting above equal highs.
As long as price remains above the demand zone, downside risk is limited.
3. Market Psychology
This is the phase where:
- Retail traders lose patience due to slow movement.
- Weak hands exit positions inside the range.
- Smart money accumulates quietly at discounted prices.
The repeated up–down movement inside the green box is liquidity engineering, not indecision.
4. Primary Scenarios
Main Scenario (Preferred):
Continued consolidation inside the demand zone.
Formation of higher lows within the range.
Break above range high → momentum expansion.
Target progression:
TP1: ~87,800
TP2: ~89,000
TP3: ~89,800–90,000
Invalidation Scenario:
Clean 1H close below ~85,200.
Would open downside continuation currently low probability based on structure.
5. Summary & Trading Insight
Bitcoin is behaving exactly as expected after a strong sell-off:
✔ Liquidity taken
✔ Accumulation confirmed
✔ Breakout preparation in progress
This is a patience market. Those who wait for structure confirmation will be positioned ahead of momentum traders.
The market rewards discipline, not urgency. Stay aligned with structure not emotions.
Technical Analysis

SILVER (XAGUSD): Another BoS
Silver did it again.
The price updated the ATH yesterday, breaking and closing above
a major horizontal resistance.
It opens a potential for more growth.
Next resistance will be 68.0
❤️Please, support my work with like, thank you!❤️
I am part of Trade Nation's Influencer program and receive a monthly fee for using their TradingView charts in my analysis.

Gold Stays Bullish — Today Is About Timing, Not DirectionXAU/USD — Market Briefing (H1)
Market State
Gold is holding a bullish continuation structure after completing the ABC correction. Price remains above key moving averages, confirming buyers are still in control. The current price action shows impulsive recovery waves, indicating momentum is rebuilding rather than fading.
Structure Bias
– Trend: Bullish (intraday)
– Price holding above dynamic MA support
– Pullbacks remain corrective, not structural breakdowns
Key Levels
– Resistance / POC: 4,353 – 4,380
– Mid Support (MA): ~4,300
– Demand / Buy Zone: 4,263 – 4,266
Today’s Scenarios
Primary Scenario — Bullish Continuation
– Price continues higher toward the POC / resistance zone
– Short-term pullbacks may occur to absorb supply
– Upside expansion remains the preferred path
Alternative Scenario — Technical Pullback
– Rejection at resistance
– Price pulls back into dynamic MA support
– Structure remains bullish unless MA support fails
Intraday Trading Plan (Dec 17)
Setup 1 — Sell Reaction (Counter-Trend)
– Sell Zone: 4,353 – 4,356
– TP: 4,350 – 4,345
– SL: 4,360
Setup 2 — Buy Continuation
– Buy Zone: 4,263 – 4,266
– TP: 4,269 – 4,274
– SL: 4,259
Gold remains bullish intraday. Focus on buying pullbacks, manage risk carefully near resistance, and avoid chasing price. Structure favors continuation as long as key supports hold.

MSTR. When Bitcoin sneezes, Strategy looks for the floorMSTR is deep in a corrective phase after the rally to 543. The current decline does not signal a structural breakdown but a return to a major demand zone at 100–102, where long term support and prior accumulation align. Selling volume is fading, suggesting seller exhaustion rather than panic. As long as price holds above 100–102, the recovery scenario remains valid. Initial rebound targets sit near 230, followed by 300 if market structure stabilizes.
Fundamentally, Strategy remains the most leveraged public Bitcoin proxy. As of December 2025, the company holds over 214000 BTC, making it the largest public Bitcoin holder globally. The average acquisition price remains well below historical highs, reducing long term downside risk. In Q3 2025, the company reported an increase in digital asset value as crypto markets recovered. The core analytics software business remains stable, while debt servicing shows no liquidity stress. Strategy is no longer just a software company. It is a macro Bitcoin instrument in equity form.
When Bitcoin panics, MSTR falls harder. But it usually stands up first when the cycle turns.

$SPY & $SPX Scenarios — Thursday, Dec 18, 2025🔮 AMEX:SPY & SP:SPX Scenarios — Thursday, Dec 18, 2025 🔮
🌍 Market-Moving Headlines
• 🚨 CPI Day — inflation is back in focus with November CPI and Core CPI printing together. This is the primary macro catalyst for rates, equities, and the dollar.
• 📉 Labor cooling check: Jobless claims add confirmation or pushback to the disinflation narrative.
• 🏭 Regional growth signal: Philly Fed survey gives a real-time read on manufacturing momentum into year-end.
📊 Key Data & Events (ET)
8 30 AM — Major Inflation Print
• Consumer Price Index, CPI (Nov): 0.3 percent
• CPI Year over Year: 3.1 percent
• Core CPI (Nov): 0.3 percent
• Core CPI Year over Year: 3.0 percent
• Initial Jobless Claims (Dec 13): 225,000
• Philadelphia Fed Manufacturing Index (Dec): 3.6
⚠️ Disclaimer: For informational use only — not financial advice.
📌 #SPY #SPX #CPI #inflation #macro #rates #markets #trading #stocks

Is AUDUSD Sliding Lower in Silence?If we look at AUDUSD as a tug of war right now, it is clear that buyers are losing momentum before any meaningful breakout can occur.
From a fundamental perspective , the Australian dollar lacks a strong catalyst to push higher. Even though the USD is weakening on expectations of further Fed easing, the market remains cautious about global growth prospects and overall risk appetite. When capital turns defensive, risk-sensitive currencies like the AUD are often left behind.
On the technical side, price action tells a clear story. AUDUSD is gradually sliding within a descending channel, consistently forming lower highs. The pair remains pressed below the falling trendline and the Ichimoku cloud , signaling that selling pressure is firmly in control . The 0.6620 area has emerged as a key resistance, where every rebound is quickly met with renewed selling. If this structure holds, the next logical target sits around 0.6590.
In summary, this is not the phase to expect a sharp rebound , but rather a period where the market is releasing pressure in the direction of the trend. Until the AUD finds a convincing narrative to regain leadership, following the downside remains the safer short-term approach.

Price Reacting at Major Resistance with Downside TargetsThis 1-hour TSLA chart shows a strong bullish recovery following a clear change of character (CHoCH), with price trending higher inside an ascending channel. The recent move has brought price into a key resistance zone, where rejection is starting to appear.
A Fair Value Gap (FVG) is highlighted near the resistance area, suggesting potential for a short-term retracement. If price confirms weakness, the chart outlines two downside targets, with the first target aligned near prior structure support and the second target at a deeper demand zone.
Overall, the chart reflects a wait-and-react scenario, where rejection from resistance could lead to a corrective move, while holding above structure would keep the bullish trend intact.

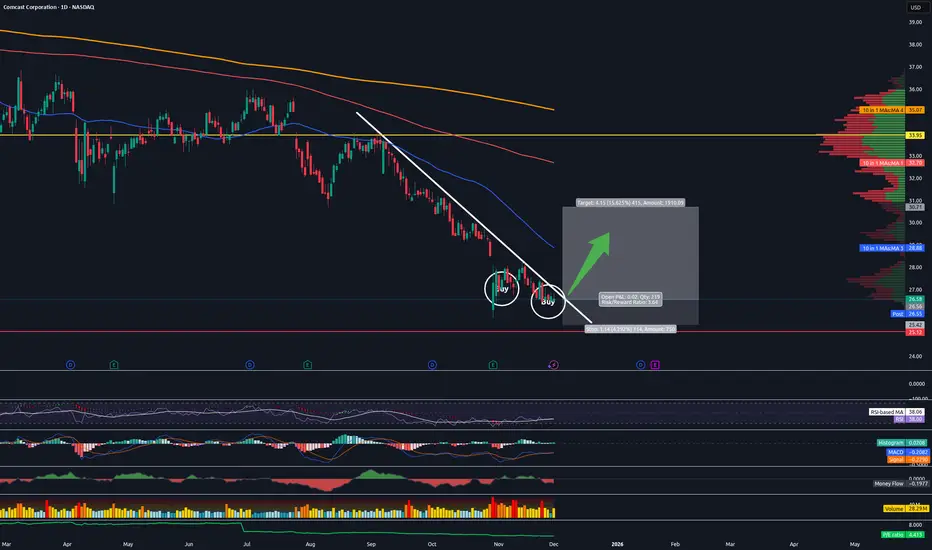
Long Comcast CMCSATrading Fam,
Not getting many long signals from my indicator these days. When I do, I pay attention. In this case, I've received two long signals on the same stock. Though, I am currently only short (and in the profit on both: TSLA and PLTR), I've decided to enter here long on Comcast. My indicator rarely fails me when it signals on these high MC/high vol. stocks. So, I will listen.
On the technical side, I am seeing a nice trendline, which, if my indicator is correct, we will break to the upside on soon. Should at least fill that recent gap down and hit the 50 SMA fairly quickly. It may be worth taking some profit at that point and raising stops to break even. I expect we'll hit our heads on that 50 SMA and draw back for a day or two at least while we wrestle around with it for a little. And then, should we break to the upside, we'll move quick. My final target may even be set too low at this point. I am trading cautiously. But we could tag the underside of that 200 SMA in red before buying subsides to some degree. I'll probably leave a little on the table for this scenario while trailing my stops up as I grab profit.
Conservative target is around $30 with a SL at around $25.50 for a 2:1 rrr. Setting a final target of that 200 SMA would increase your rrr to 5:1 with a potential profit of 23%.
✌️Stew
GBPAUD Currency Pair Is Poised For Further DeclineGBPAUD has been rising since the start of the year, but it appears that the move in 2025 may represent a fifth wave of an impulse, as price broke out of a triangle at the beginning of the year. Despite the strong push higher, it’s important to keep in mind that triangles typically appear as the final part of a higher-degree trend. Therefore, the current bearish reversal on the daily chart is not surprising and ideally could bring prices much lower, into wave C or wave 3, especially if price breaks below the channel support line near the 2.04 area. We see room for a move toward 1.96.
On the intraday basis, GBPAUD turned nicely and sharply lower from the projected resistance after we identified an ABC correction within the downtrend. As a result, further weakness is expected, particularly if price drops below the channel support line and the 2.00 level, which would act as bearish confirmation.

Gold: Bulls taking a breather? Watch for a pullback.This looks like a bull trap. If price can't break through this red box, I'm expecting a pullback to 4,300 to grab some liquidity.
- Resistance: 4,330 - 4,340 (Red Box)
- Support Target: 4,303.74

EURGBP: Overbought Market & Retracement 🇪🇺🇬🇧
EURGBP may retrace from the underlined key daily/intraday resistance.
A double top pattern formation of that indicates an overbought
state of the market.
I expect a bearish movement to 0.877
❤️Please, support my work with like, thank you!❤️
I am part of Trade Nation's Influencer program and receive a monthly fee for using their TradingView charts in my analysis.

XAUUSD at Premium Supply – Patience Before the Next Big MoveXAUUSD (Gold) – 30 Minute Chart Analysis
Market Structure Overview
On the 30-minute timeframe, XAUUSD shows a strong impulsive bullish move followed by a controlled pullback, which is a classic sign of healthy price behavior. The market previously formed a base and then expanded aggressively upward, breaking multiple minor resistances with momentum candles. This confirms that buyers were in control during the impulsive phase.
However, price has now reached a high-probability supply area, marked as Reversal Zone 1 and Reversal Zone 2, where selling pressure has started to appear.
Reversal Zones & Institutional Area
The upper highlighted area represents a premium reversal zone, where price previously reacted sharply. The rejection from this zone is visible through long wicks and strong bearish candles, indicating institutional selling and profit-taking.
This area is critical because:
It aligns with previous highs
It shows imbalance resolution
It is a zone where smart money typically distributes positions
The sharp rejection confirms that buyers are becoming weak at higher prices, increasing the probability of a corrective move.
Current Price Behavior
After rejection from the upper reversal zone, price is now pulling back in a structured manner, not collapsing aggressively. This tells us the move is corrective, not a trend reversal yet.
The dotted line labeled Pattern Must highlights the importance of waiting for confirmation, not chasing price. The market is currently in a decision phase.
Demand Zone & Volume Expectation
Below the current price lies a well-defined Reversal / Demand Zone, supported by:
Previous price consolidation
Strong bullish reaction in the past
Anticipated volume burst area
This zone is highly important because it is where:
Buyers may re-enter the market
Liquidity rests below recent lows
Smart money may accumulate again
If price reaches this area with decreasing bearish momentum, a bullish reaction is highly probable.
Trading Scenarios
Bullish Scenario:
If price taps the lower reversal zone and forms:
Bullish engulfing
Strong rejection wicks
Increased volume
Then this confirms buyer interest, opening the door for continuation toward previous highs.
Bearish Scenario:
If price fails to hold the demand zone and closes strongly below it, this would indicate:
Breakdown of structure
Shift in short-term momentum
Deeper retracement toward lower liquidity zones
Trader’s Mindset (Very Important)
This is not a chase market. Patience is key.
Let price come into your zones and react, not predict.
High-probability trades come when:
Zone + structure + confirmation align
Emotion is removed
Risk is controlled
Remember: zones are areas, not exact prices.
Final Thoughts
XAUUSD is currently transitioning from impulse to correction. The market is offering clean, technical zones where professional traders wait for confirmation instead of guessing. Let price show its hand — the best trades will come from reaction, not anticipation.

USDJPY Premium Analysis : Bearish Bias Setup + Premium SupplyUSDJPY – 1 Hour Technical Analysis
Higher-Timeframe Context
USDJPY previously showed a strong bearish move, breaking structure and pushing price into a discounted zone. After this sell-off, the market entered a consolidation phase, where liquidity was built on both sides. This type of structure often prepares price for a corrective move rather than an immediate trend reversal.
Impulsive Recovery & Liquidity Grab
From the lows, price printed a sharp bullish impulse, indicating aggressive buying and short covering. This move was fast and efficient, suggesting that liquidity below the range was cleared before price expanded upward. Such impulsive moves usually aim toward premium supply areas, which is exactly where price is now reacting.
Reversal Zone & Supply Area
The highlighted Reversal Zone above current price is a key institutional supply area. This zone aligns with:
Previous bearish structure
Unfilled sell-side imbalance
Prior distribution area
As price enters this zone, momentum slows down, and small-bodied candles appear, signaling buyer exhaustion. This behavior strongly suggests that smart money may be distributing positions here rather than allowing further upside.
Volume Burst Expectation
The larger highlighted area above represents a volume burst zone, where volatility is expected to increase. If price pushes deeper into this area, traders should watch closely for:
Strong bearish rejection
Long upper wicks
Bearish engulfing or shift in candle structure
The note “Pattern Must” emphasizes that confirmation is mandatory. No trade should be taken without a clear bearish pattern inside this zone.
Bearish Scenario (Primary Bias)
If price confirms rejection from the reversal zone, the expected move is a pullback toward lower levels, targeting internal liquidity and previous consolidation areas. This would align with:
Overall bearish structure
Correction after impulsive move
Smart money selling at premium prices
Bullish Invalidation
If price accepts and closes strongly above the reversal zone with sustained volume, this bearish idea becomes invalid. In that case, the market may continue higher, driven by breakout traders and momentum buyers.
Trader’s Mindset
This is a wait-and-react setup, not a prediction. Professional traders let price reach key zones and then look for confirmation. Patience here protects capital and improves trade quality.
Remember:
Zones are areas, not exact prices
Confirmation > anticipation
One clean setup is better than ten forced trades
Final Thoughts
USDJPY is currently trading at a high-risk, high-decision area. The reaction from this reversal zone will likely define the next directional move. Until confirmation appears, discipline and patience remain the edge.

BTCUSDT Analysis : Bearish Setup, Bitcoin Faces Strong RejectionBTCUSDT PERPETUAL – 1 Hour Chart Analysis
Market Structure
On the 1-hour timeframe, BTCUSDT shows a strong bearish displacement from the highs, indicating clear dominance by sellers. The aggressive sell-off broke previous structure and pushed price into a short-term accumulation phase. After forming a base, price attempted a corrective move to the upside, but this recovery lacked strong continuation volume.
The overall structure still remains bearish, as price failed to reclaim key resistance zones with strength.
Reversal Zone Reaction
The highlighted Reversal Zone above current price is a critical supply area where sellers previously entered the market aggressively. Price retraced into this zone and immediately showed rejection, confirmed by strong bearish candles and long upper wicks. This reaction suggests that smart money used this area to re-enter short positions rather than allow bullish continuation.
This rejection validates the zone as a high-probability resistance, reinforcing bearish bias unless price can decisively reclaim and hold above it.
Breakdown & Momentum Shift
After rejecting from the reversal zone, BTCUSDT started printing lower highs, signaling weakness in buyers. The current price action shows sellers regaining control, with momentum shifting back to the downside. The absence of bullish follow-through confirms that the move up was corrective rather than impulsive.
This behavior aligns with classic pullback-to-supply mechanics in a bearish trend.
Liquidity & Correction Zone (CZ)
Below current price, the marked Correction Zone (CZ) represents an area where internal liquidity exists. This zone often acts as a temporary pause where price may react briefly before continuation. However, without a strong bullish pattern, this area is more likely to be a minor reaction point, not a trend reversal zone.
Traders should remain cautious here and wait for price behavior confirmation.
Target Zone & Projection
The lower highlighted Target Zone aligns with:
Previous swing lows
High liquidity resting below the range
An area where sell-side stops are likely to be triggered
The projected move indicates a potential liquidity sweep into the target zone, followed by the possibility of a technical bounce. However, the note “Need Positive Pattern” clearly emphasizes that no blind buying should be done. A bullish confirmation pattern is required before considering long positions.
Trading Psychology & Execution Mindset
This setup favors patience and discipline. The market is not offering immediate confirmation for longs. Selling rallies remains the safer approach until price reaches deeper demand and shows a clear change in character.
Professional traders wait for:
Structure shift
Strong rejection or absorption
Clear bullish confirmation at target zones
Not every zone is a trade — confirmation is king.
Final Outlook
BTCUSDT remains bearish on the 1-hour timeframe. The rejection from the reversal zone strengthens the downside bias, with price likely targeting lower liquidity zones. Any bullish opportunity should only be considered after strong confirmation at the lower target area. Until then, the market favors sellers.

NIFTY Technical Analysis (Educational Purpose Only)📌Not a SEBI Registered Research Analyst – For educational/chart discussion only
Nifty Rounding Top chart pattern in hourly timeframe
NIFTY is facing strong resistance near ~26,200, where price has struggled to stay above. Recent price action shows a rounding top-like pattern forming at this key resistance zone.
Support Levels:
• Immediate support is at 25,750 – 25,700 where price has bounced multiple times.
• This zone is important: a clean break below it signals increased downside pressure.
Momentum (RSI & Candles):
• RSI shows weak momentum near highs and is not making strong new highs even as price hits resistance – indicating loss of upside strength.
• Near resistance, bearish/weak candles with upper wicks suggest supply outweighs demand.
Pattern Interpretation:
• A rounding top suggests a slow shift from buyers to sellers near the 26,200 zone.
• If price breaks below 25,750–25,700, this pattern becomes more valid and may lead to further downside.
• Using the pattern measurement rule, the target on breakdown could be around 25,000 area. (Educational projection)
Key Levels:
📍 **Resistance: ~26,200
📍 Support: 25,750–25,700
📍 Pattern Target (if support breaks): ~25,000
What to Watch Next:
✔ Break & close below 25,750–25,700 — increases probability of lower continuation.
✔ Strong hold above 25,700 — keeps the structure undecided and may lead to range or reversal if momentum improves.
📌 Summary (Simple):
NIFTY is forming a rounding top around **26,200 resistance**. Support at **25,750–25,700** is crucial. Due to weak momentum and supply near resistance, breaking below this support may push price toward **~25,000**. This is an **educational technical analysis**, not a buy/sell recommendation.

ETH Is Compressing — The Next Move Won’t Be RandomMARKET BRIEFING – ETH/USD (30M)
Market State:
Ethereum just completed a sharp impulsive sell-off and is now transitioning into a consolidation phase, not continuation. Momentum has cooled, signaling balance between buyers and sellers after liquidation.
Key Levels:
– Resistance Zone: 2,960 – 2,980
– Support Zone: 2,890 – 2,900
– Current Range: Tight compression inside these boundaries
Price Action:
– The strong bearish impulse was followed by range acceptance, a classic sign of post-distribution absorption.
– Price is rotating inside the box, suggesting liquidity building, not trend acceleration.
Next Expected Behavior:
– Short-term: continued range trading between support and resistance.
– Upside scenario: clean acceptance above 2,980 opens room for a corrective push higher.
– Downside scenario: loss of 2,890 exposes deeper continuation toward lower demand.
Bias:
Neutral → reactive.
Trade the edges, not the middle.
ETH is not trending it’s compressing.
Direction will be revealed only after range resolution, not before.

Gold Is Tricking Everyone Right Now-The Real Move Hasn’t StartedGOLD MARKET ANALYSIS – XAUUSD (H1)
1. Market Structure Overview
- Gold is currently in a short-term corrective phase after failing to immediately break above the 4350 Resistance Zone.
- The market has transitioned from impulsive bullish expansion into a controlled pullback, forming a range-bound structure between resistance and support.
- Despite the pullback, the overall structure remains bullish, as price is still holding above the last major breakout base.
This move is corrective, not distributive.
2. Key Support & Resistance Zones
Major Resistance Zone:
🔴 4350 – 4355
→ Previous rejection zone + supply absorption area.
Highest High / Target:
⚫ 4381
→ Liquidity magnet above range highs.
Major Support Zone:
🟢 4255 – 4260
→ Strong demand zone and reaction base.
This range defines the current battlefield between buyers and sellers.
3. Market Scenarios
Primary Scenario – Support Hold → Bullish Continuation (High Probability)
Price continues to pull back into the 4255 support zone.
Sellers lose momentum inside support.
Buyers step in, forming a higher low.
Gold rotates back toward resistance.
🎯 Targets: 4350 – 4355
Extension toward 4381 (Highest High / Liquidity Target)
This matches the classic sequence:
Pullback → Support reaction → Trend continuation
Alternative Scenario – Range Expansion Failure (Low Probability)
Only valid if 4255 breaks with strong momentum.
This would trigger a deeper correction toward 4200 – 4220.
No structural evidence currently supports this scenario.
4. Market Psychology & Liquidity Behavior
- Late buyers are getting shaken out during the pullback.
- Smart money is not selling aggressively volume is decreasing into support.
- Price behavior shows liquidity recycling, not panic selling.
- This is a textbook cooling phase before continuation.
The market is pausing to reset momentum, not reversing.
5. Trading Bias & Execution Insight
Bias: Bullish after correction
No chasing price in the middle of the range.
Best opportunities:
✔ Buy reaction from 4255 – 4260
✔ Buy breakout & hold above 4355
Patience is required the expansion comes after compression.
Gold is respecting its structure perfectly:
Correct → Hold support → Reload → Break higher.

Gold Is Not Stopping — This Is a Breakout Preparation, Not a TopGOLD (XAUUSD) — 4H MARKET ANALYSIS
1. Market Structure Overview
- Gold is maintaining a strong bullish market structure on the H4 timeframe. The sequence of higher lows remains intact, confirming that buyers are firmly in control.
- Price has already completed a strong impulsive leg and is now pausing just below the previous all-time high (ATH) a classic continuation setup rather than exhaustion.
2. Key Technical Zone
- Previous ATH / Resistance: ~4380
- Price is consolidating directly beneath resistance, not rejecting from it.
- The consolidation range is tight and orderly → a sign of strength.
This behavior shows acceptance near highs, which typically precedes breakout continuation.
3. Bullish Consolidation Logic
Inside the highlighted resistance box:
- Higher lows continue to form
- Pullbacks are shallow
- Sellers fail to push price meaningfully lower
This is bullish compression, where supply is absorbed while demand stays active.
In strong trends, the market does not drop it moves sideways before expanding higher.
4. Scenario Outlook
Primary Scenario (High Probability):
- Continued consolidation just below 4380
- Minor intraday pullbacks holding higher lows
- Break and acceptance above previous ATH
- Expansion into price discovery → New ATH
Projected flow:
Consolidation → Breakout → Retest (optional) → Strong continuation
Invalidation:
Only a decisive H4 close back below the consolidation base would weaken this bullish outlook. Currently, there is no such signal.
5. Market Psychology & Conclusion
This phase is designed to:
- Shake out early buyers
- Trap late sellers
- Reward disciplined trend followers
Conclusion:
Gold is structurally strong, technically aligned, and preparing for a new all-time high. Sideways movement here is not weakness it is fuel being built for the next impulsive leg.
When price refuses to fall at resistance, the breakout is already loading.

GOLD (XAUUSD): High Chance for a Rise?!
I see a confirmed bullish change of character on Gold on a 4h
time frame after a release of high impact US news yesterday.
With a high probability, the market will rise more today.
Goal - 4345
❤️Please, support my work with like, thank you!❤️
I am part of Trade Nation's Influencer program and receive a monthly fee for using their TradingView charts in my analysis.

Bitcoin Faces a Major Decision Zone - Relief Rally 🔹 MARKET BRIEFING – BTC/USD (1H)
Market State:
– Bitcoin has completed a sharp corrective move and is now attempting a rebound from the local demand area.
– The current price action shows a technical relief bounce, not a confirmed trend reversal, with price moving back toward a well-defined supply zone.
Key Levels:
– Support / Demand Zone: 88,000 – 88,500
– Current Reaction Area: 89,300 – 89,600
– Strong Resistance Zone: 91,500 – 92,700
This resistance aligns with previous breakdown structure, making it a high-probability reaction area.
🌍 Macro Context – Why This Is Likely a Range-to-Reject Setup
– Fed Policy: The market remains in a data-dependent holding pattern. With no immediate dovish catalyst, liquidity expansion expectations are limited.
– Risk Assets: Equities and crypto are both showing mean-reversion behavior, not impulsive risk on flows.
– Liquidity Conditions: Recent downside move flushed short-term longs, enabling a bounce but macro liquidity does not yet support sustained upside continuation.
Next Move:
– A continued push toward 91,500–92,700 is possible as part of a corrective retracement.
– However, unless price reclaims and holds above the resistance zone, the higher-probability outcome remains rejection and continuation of range-bound or corrective structure.
– Acceptance above 92,700 would invalidate the bearish bias and shift focus to higher liquidity targets.
Bottom Line:
– This move is best viewed as a technical rebound into resistance, not a trend shift.
– Bitcoin is reacting to liquidity mechanics while waiting for a clear macro catalyst to define the next directional leg.

This Pullback Is Not a Reversal — It’s Fuel for the Next Leg UpGOLD (XAUUSD) — 4H MARKET ANALYSIS
1. Market Structure Overview
Gold remains in a clear bullish trend on the H4 timeframe. The market continues to respect a well-defined ascending trendline, forming consistent higher highs and higher lows.
The recent decline is a technical pullback, not a trend shift. Price is correcting within structure, which is a necessary condition for trend continuation.
2. Pullback Behavior & Trend Logic
Every major impulsive leg has been followed by a controlled pullback, marked on the chart.
These pullbacks consistently respect dynamic support and the rising trendline.
The current retracement shows loss of bearish momentum, indicating sellers are corrective, not dominant.
This confirms a bullish market rhythm:
Impulse → Pullback → Expansion
3. Key Support & Resistance Zones
Primary Support Zone:
The highlighted green support area acts as a demand zone where buyers previously stepped in aggressively.
Trendline Support:
The rising trendline remains intact as long as price holds above it, bullish structure is preserved.
Immediate Resistance:
The prior high zone above the current range. Acceptance above this level opens space for continuation.
4. Forward Scenarios
Primary Scenario — Trend Continuation (High Probability):
- Price holds within the support zone
- Forms a higher low
- Breaks above short-term resistance
- Expands upward following the dominant trend
Projected behavior:
➡ Shallow dip → base formation → impulsive breakout
➡ Continuation toward new highs
Invalidation Scenario:
Only if price breaks and closes below the trendline with momentum would this bullish setup weaken. At present, there is no structural confirmation of that outcome.
5. Market Psychology & Conclusion
This is where impatient traders exit, while smart money accumulates.
Pullbacks inside an uptrend are opportunities, not warnings.
The market is compressing energy inside structure, preparing for the next expansion.
Conclusion:
Gold is not topping it is resetting momentum within an uptrend. As long as the support zone and trendline hold, the path of least resistance remains upward.
Strong trends reward patience — not prediction. Trade the structure, and let the trend do the work.

ETH Isn’t Weak — It’s Setting a Trap Before the Real MoveETHEREUM (ETH/USD) – EXTENDED STRUCTURE ANALYSIS | 4H
ETH is not breaking down impulsively. What you are seeing is a controlled distribution → compression → liquidity preparation phase, not panic selling.
1. Market Structure – What Is Really Happening
- ETH completed a distribution top near the upper green zone.
- Price then shifted into lower highs, confirming a bearish short-term structure.
- The current price is now compressing inside a minor accumulation box, NOT trending aggressively.
- This tells us sellers are slowing down → momentum is being absorbed.
Key insight:
👉 When price slows after a sharp drop, it usually means large players are building positions, not exiting.
2. Liquidity & Smart Money Behavior
The sideways range is engineered to trap late sellers.
Equal highs & lows inside the box = liquidity magnet.
Smart money is waiting for:
- Either a fake breakdown,
- Or a forced sell-off into the major demand below.
This is classic stop-hunt behavior, not trend continuation.
3. High-Probability Scenario (Primary)
ETH continues sideways → fake volatility inside the box.
A final liquidity sweep sends price toward:
- 2,720 – 2,750 (major higher-timeframe demand)
This zone aligns with:
- Previous strong demand
- Structural low
- Long-term buyer interest
⚠️ The move down is likely fast and emotional designed to scare retail.
4. Invalidation / Alternate Scenario (Lower Probability)
If ETH reclaims and holds above the box high with volume:
- The breakdown scenario is invalidated.
- Price may rotate back toward previous consolidation highs.
Until that happens:
👉 All upside moves are corrective, not trend reversal.
5. Trader Psychology – The Trap Phase
This is the most dangerous zone emotionally:
- Bears feel confident → but momentum is fading.
- Bulls feel uncertain → but structure is forming.
- Impatient traders get chopped.
- Disciplined traders wait.
The market is not moving randomly — it’s filtering participants.
ETH is not collapsing.
ETH is resetting structure, cleansing liquidity, and preparing the next real move.
Patience here is not optional it is the edge.

Silence Before the Break — Gold Is Charging for a New ATHGOLD (XAUUSD) — 1H MARKET ANALYSIS
1. Market Structure
Gold remains in a clear bullish structure on the 1H timeframe. After the strong impulsive move up, price has shifted into a horizontal accumulation phase, forming a tight range below the old ATH.
This is not distribution structure still holds higher lows, and no major support has been broken.
2. Accumulation Zone Insight
The highlighted box represents a classic accumulation zone:
- Price is moving sideways after an impulse
- Volatility is contracting
- Sellers fail to push price lower
- Buyers absorb supply quietly
This behavior typically precedes range expansion, not reversal.
3. Key Levels
- Accumulation Support: Lower boundary of the box must hold for bullish bias
- Range High / Trigger Zone: Upper boundary of the box
- Major Target: Old ATH around 4380+
Acceptance above the range high will confirm breakout strength.
4. Expected Scenarios
Primary Scenario (High Probability):
- Price continues compressing inside the range
- Forms a higher low within the accumulation zone
- Breaks out of the range high
- Breaks old ATH → Price discovery mode
Projected flow:
- Range → Breakout → Retest (optional) → Expansion
Invalidation:
- Only if price breaks and holds below the accumulation support does this bullish setup weaken. Currently, there is no structural confirmation of that.
5. Market Psychology & Conclusion
This phase traps impatient traders and rewards disciplined ones.
Sideways price action at highs is a sign of strength, not weakness.
Conclusion:
Gold is consolidating below ATH to build liquidity for the next impulsive leg. Once the range breaks, continuation toward new all-time highs becomes the dominant path.
Strong moves are born in quiet ranges — wait for structure, not emotion.
