ADAUSD(4Hr) : Cardano recovering along with other cryptosMarket in the last 24hrs
ADAUSD saw a consolidated movement with a slight indication of bullish momentum. Trading volume has been high in the last 24 hours and can be seen decreasing with slight increase in price suggesting a bearish momentum in the future.
Today’s Trend analysis
The price is expected to continue the consolidated movement till the price reaches the upper Bollinger band after which the likely scenario is that the price accepts the upper band as a resistance line and move in a downward momentum.
Price volatility was low at approximately 1.4%, with the day's range between $1.14 — $1.21.
Price at the time of publishing: $1.2
ADA’s market cap: $38.34 Billion
However, the Indicator summary is giving a 'BUY' signal on DOGEUSD.
Out of 11 Oscillator indicators, 2 are giving a SELL signal, 7 are neutral and 2 are giving a BUY signal.
Out of 15 Moving average indicators, 4 are giving SELL signal, 1 is giving neutral and 10 are giving a BUY signal.
Trading volume has been high in the last 24 hours. If we don't see a sudden spike in volume then we can expect the above analysis to hold true.
----------------------------------------------------------------------------------------
The analysis is based on signals from 26 technical indicators, out of which 15 are moving averages and the remaining 11 are oscillators. These indicator values are calculated using 4Hr candles.
----------------------------------------------------------------------------------------
Any feedback and suggestions would help in further improving the analysis!
Technicalindicators

XRP(4Hr) : XRP recovering slowlyMarket in the last 24hrs
XRPUSD saw bullish momentum in the last 24 hours but lately, the price can be seen moving in a consolidated manner. Trading volume has been high in the last 24 hours which could be the reason behind the bullish movement.
Today’s Trend analysis
XRPUSD is expected to continue to move in a consolidated movement with a slight indication of bullish momentum. This is expected to continue till the price accepts the upper Bollinger band as a resistance line after which a sideways movement is expected.
Price volatility was high at approximately 7.38%, with the day's range between $0.544 — $0.589.
Price at the time of publishing: $0.583
XRP’s market cap: $27 Billion
However, the Indicator summary is giving a 'BUY' signal on XRPUSD.
Out of 11 Oscillator indicators, 0 are giving a SELL signal, 9 are neutral and 2 are giving a BUY signal.
Out of 15 Moving average indicators, 4 are giving SELL signal, 1 is giving neutral and 10 are giving a BUY signal.
Trading volume has been very high in the last 24 hours. If we don't see a sudden spike in volume then we can expect the above analysis to hold true.
----------------------------------------------------------------------------------------
The analysis is based on signals from 26 technical indicators, out of which 15 are moving averages and the remaining 11 are oscillators. These indicator values are calculated using 4Hr candles.
----------------------------------------------------------------------------------------
Any feedback and suggestions would help in further improving the analysis!

DOGEUSD(4 HR) : DOGE looking to go to the moonMarket in the last 24hrs
Price saw a major upward movement in the last 24 hours. The price moved from the bottom Bollinger band to above the upper Bollinger band. Trading volume has been astronomical in the last 24 hours. The rising volume with rising in price can be an indication of strong bullish momentum.
Today’s Trend analysis
The price is expected to continue to move in upward momentum till the price accepts the upper Bollinger band as a support line, after which we can expect some consolidation with a slight indication of a bullish trend.
Price volatility was very high at approximately 9.86%, with the day's range between $0.168 — $0.214.
Price at the time of publishing: $0.191
DOGE’s market cap: $24.67 Billion
However, the Indicator summary is giving a 'NEUTRAL' signal on DOGEUSD.
Out of 11 Oscillator indicators, 3 are giving a SELL signal, 7 are neutral and 1 is giving a BUY signal.
Out of 15 Moving average indicators, 5 are giving SELL signal, 1 is giving neutral and 9 are giving a BUY signal.
Trading volume has been astronomical in the last 24 hours. If we don't see a sudden spike in volume then we can expect the above analysis to hold true.
----------------------------------------------------------------------------------------
The analysis is based on signals from 26 technical indicators, out of which 15 are moving averages and the remaining 11 are oscillators. These indicator values are calculated using 4Hr candles.
----------------------------------------------------------------------------------------
Any feedback and suggestions would help in further improving the analysis!

ETHUSD(4Hr) : ETH looking to fly highMarket in the last 24hrs
ETHUSD saw a major bullish momentum with price moving from bottom to upper Bollinger band. Trading volume has been high in the last 24 hours. The high volume with an increase in price suggests that the bullish momentum is strong.
Today’s Trend analysis
Price is expected to continue its upward momentum for the next 24 hours. The price is likely to accept the upper Bollinger band as a resistance line and the price may move in a consolidated movement with a slight indication of bullish momentum.
Price volatility was very high at approximately 11.5%, with the day's range between $1759— $2006.
Price at the time of publishing: $1986
ETH's market cap: $231.97 Billion
However, the Indicator summary is giving a 'BUY' signal on ETHUSD.
Out of 11 Oscillator indicators, 1 is giving a SELL signal, 6 are neutral and 3 are giving a BUY signal.
Out of 15 Moving average indicators, 4 are giving a SELL signal, 1 is neutral and 10 are giving a BUY signal.
Trading volume has been high in the last 24 hours.
----------------------------------------------------------------------------------------
The analysis is based on signals from 26 technical indicators, out of which 15 are moving averages and the remaining 11 are oscillators. These indicator values are calculated using 4Hr candles.
Note: Above analysis would hold if we do not encounter a sudden jump in trade volume.
----------------------------------------------------------------------------------------
Any feedback and suggestions would help in further improving the analysis!

XRP(4Hr) : XRP not willing to recoverMarket in the last 24hrs
XRPUSD saw a consolidated movement with a slight indication of bearish momentum. The price moved slightly above the Bottom Bollinger band. Trading volume has been very in the last 24 hours but still, the price is moving in a consolidated manner suggesting unsurety among investors.
Today’s Trend analysis
Price is expected to continue to move in a consolidated movement till it reaches the middle Bollinger band after which if the price accepts it as a resistance line the consolidated movement will continue or else we may see some bullish momentum.
Price volatility was extremely moderate at approximately 4.93%, with the day's range between $0.518 — $0.568.
Price at the time of publishing: $0.532
XRP’s market cap: $24.6 Billion
However, the Indicator summary is giving a 'SELL' signal on XRPUSD.
Out of 11 Oscillator indicators, 1 is giving a SELL signal, 7 are neutral and 2 are giving a BUY signal.
Out of 15 Moving average indicators, 13 are giving SELL signal, 1 is giving neutral and 1 is giving a BUY signal.
Trading volume has been very high in the last 24 hours. If we don't see a sudden spike in volume then we can expect the above analysis to hold true.
----------------------------------------------------------------------------------------
The analysis is based on signals from 26 technical indicators, out of which 15 are moving averages and the remaining 11 are oscillators. These indicator values are calculated using 4Hr candles.
----------------------------------------------------------------------------------------
Any feedback and suggestions would help in further improving the analysis!

DOGEUSD(4Hr) : DOGE digging deep in the groundMarket in the last 24hrs
The price saw a downward movement in the last 24 hours as it moved from the middle to the bottom Bollinger band. Trading volume has been low in the last 24 hours but had high volatility.
Today’s Trend analysis
DOGEUSD is expected to see some consolidation in the next 24 hours. The price is expected to oscillate between the bottom and the middle Bollinger bands.
Price volatility was very high at approximately 8.95%, with the day's range between $0.161 — $0.178.
Price at the time of publishing: $0.162
DOGE’s market cap: $21.15 Billion
However, the Indicator summary is giving a 'STRONG SELL' signal on DOGEUSD.
Out of 11 Oscillator indicators, 2 are giving a SELL signal, 9 are neutral and 0 are giving a BUY signal.
Out of 15 Moving average indicators, 14 are giving SELL signal, 1 is giving neutral and 0 are giving a BUY signal.
Trading volume has been low in the last 24 hours. If we don't see a sudden spike in volume then we can expect the above analysis to hold true.
----------------------------------------------------------------------------------------
The analysis is based on signals from 26 technical indicators, out of which 15 are moving averages and the remaining 11 are oscillators. These indicator values are calculated using 4Hr candles.
----------------------------------------------------------------------------------------
Any feedback and suggestions would help in further improving the analysis!

BITCOIN (BTCUSD) long position technical analysisTrade position: long
Entry I: $ 28547.39, entry II: $24916.06
Target I: $ 35810.04, target II: $ 40997.64, target III: 49816.58
RSI: 37.12 close to <30
The downtrend is represented by the red trendline on the chart. The analysis shows the price reached the lower boundary of the Keltner channel, but not its upper boundary. Recently, MACD indicates a bearish confirmation, following the signal line exceeded the MACD line. Moreover, the RSI value is close to 30, meaning the price is approaching an oversold level. All these indicators suggest a good entry point for the long position.

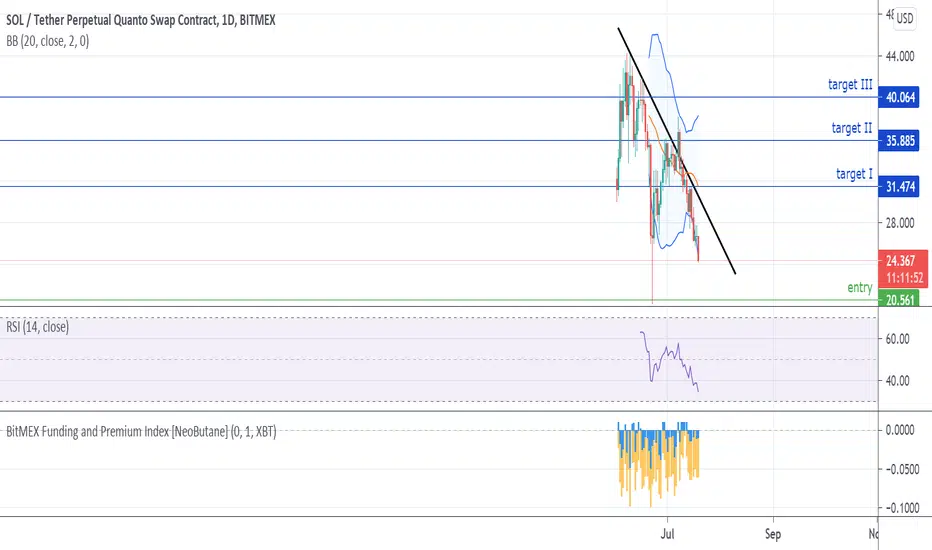
SOLANA (SOLUSDT) LONG POSITION TECHNICAL ANALYSISTrade position: LONG
Entry price: $20.561
Target I: $31.474, target II: $35.885, target III: $40.064
RSI: close to <30
In the last days, the price dropped below the lower band of the Keltner channel, but did not hit the upper boundary of the Keltner channel. There are a series of negative funding rates since mid-May 2021, and similarly to the other coins always when we have built a solid base we had impulsive move to the upside. Moreover, the RSI value is close to 30, meaning that the cryptocurrency is approaching oversold level which could be a good moment to enter the long position.
XRP(4Hr) : XRP falls below a major support lineMarket in the last 24hrs
XRPUSD moved in a consolidated manner in the last 24 hours. The price moved below the triangle suggesting a possible bearish momentum in the future. Trading volume has been low for the past 24 hours.
Today’s Trend analysis
The price moved below the triangle suggesting a bearish momentum. The price is expected to see the said bearish momentum till it reaches the bottom Bollinger band after which we can expect a consolidated bearish momentum if the price accepts the bottom Bollinger band as a support line.
Price volatility was extremely low at approximately 1.14%, with the day's range between $0.573 — $0.591.
Price at the time of publishing: $0.581
XRP’s market cap: $26.84 Billion
However, the Indicator summary is giving a 'SELL' signal on XRPUSD.
Out of 11 Oscillator indicators, 1 is giving a SELL signal, 9 are neutral and 1 is giving a BUY signal.
Out of 15 Moving average indicators, 14 are giving SELL signal, 1 is giving neutral and 0 are giving a BUY signal.
Trading volume has been low in the last 24 hours. If we don't see a sudden spike in volume then we can expect the above analysis to hold true.
----------------------------------------------------------------------------------------
The analysis is based on signals from 26 technical indicators, out of which 15 are moving averages and the remaining 11 are oscillators. These indicator values are calculated using 4Hr candles.
----------------------------------------------------------------------------------------
Any feedback and suggestions would help in further improving the analysis!

ETHUSD(4Hr) : ETH bouncing between 2 major trend lines with low Market in the last 24hrs
ETHUSD saw a consolidated movement with a slight indication of bearish momentum in the last 24 hours. The price has been moving in between the middle and bottom Bollinger bands. Trading volume has been moderate and the volume can be seen increasing with a decrease in price suggesting a bearish momentum of the price getting stronger.
Today’s Trend analysis
Price touched the bottom Bollinger band which usually acts as a strong support line. The price is likely to continue to oscillate between the bottom and the middle Bollinger band until it rejects either the middle band as a resistance line or the bottom band as a support line.
Price volatility was low at approximately 1.75%, with the day's range between $1854— $1960.
Price at the time of publishing: $1865
ETH's market cap: $219.22 Billion
However, the Indicator summary is giving a 'SELL' signal on ETHUSD.
Out of 11 Oscillator indicators, 2 are giving a SELL signal, 7 are neutral and 2 are giving a BUY signal.
Out of 15 Moving average indicators, 14 are giving a SELL signal, 1 is neutral and 0 are giving a BUY signal.
Trading volume has been moderate and the volume can be seen increasing with a decrease in price suggesting a bearish momentum of the price getting stronger.
----------------------------------------------------------------------------------------
The analysis is based on signals from 26 technical indicators, out of which 15 are moving averages and the remaining 11 are oscillators. These indicator values are calculated using 4Hr candles.
Note: Above analysis would hold if we do not encounter a sudden jump in trade volume.
----------------------------------------------------------------------------------------
Any feedback and suggestions would help in further improving the analysis!

XRP(4Hr) : XRP looking to continue a bearish momentumMarket in the last 24hrs
XRPUSD can be seen oscillating between the bottom and bottom Bollinger band in the last 24 hours. Trading volume has been low in the last 24 hours. The volume can be seen decreasing with an increase in price suggesting a bearish momentum soon.
Today’s Trend analysis
XRP is expected to continue to oscillate inside the triangle until it exits on either side. The likely scenario is that the price will exit below the triangle and continue its bearish momentum. There is a chance that the price exits above the triangle and starts moving in a consolidated manner with a slight indication of bullish momentum.
Price volatility was extremely low at approximately 1.3%, with the day's range between $0.589 — $0.617.
Price at the time of publishing: $0.606
XRP’s market cap: $28.49 Billion
However, the Indicator summary is giving a 'STRONG SELL' signal on XRPUSD.
Out of 11 Oscillator indicators, 3 are giving a SELL signal, 8 are neutral and 0 are giving a BUY signal.
Out of 15 Moving average indicators, 13 are giving SELL signal, 1 is giving neutral and 1 is giving a BUY signal.
Trading volume has been low in the last 24 hours. The volume can be seen decreasing with an increase in price suggesting a bearish momentum soon. If we don't see a sudden spike in volume then we can expect the above analysis to hold true.
----------------------------------------------------------------------------------------
The analysis is based on signals from 26 technical indicators, out of which 15 are moving averages and the remaining 11 are oscillators. These indicator values are calculated using 4Hr candles.
----------------------------------------------------------------------------------------
Any feedback and suggestions would help in further improving the analysis!

MATICUSD(4Hr): MATIC sees a new low after 2 monthsMarket in the last 24hrs
MATICUSD saw a continuous downward trend with prices moving from middle to bottom Bollinger band. Trading volume has been high in the last 24 hours. We can see the volume increasing with a decrease in price suggesting the setting of the bearish trend.
Today’s Trend analysis
MATICUSD is expected to continue the current bearish trend for the next 24 hours. We can expect to see some consolidation once the price accepts the bottom Bollinger band as a support line.
Price volatility was high at approximately 9.01%, with the day's range between $0.858 — $0.959.
Price at the time of publishing: $0.862
MATIC’s market cap: $5.49 Billion
However, the Indicator summary is giving a 'SELL' signal on MATICUSD.
Out of 11 Oscillator indicators, 1 is giving a SELL signal, 9 are neutral and 1 is giving a BUY signal.
Out of 15 Moving average indicators, 14 are giving SELL signal, 1 is giving neutral and 0 are giving a BUY signal.
Trading volume has been low in the last 24 hours. If we don't see a sudden spike in volume then we can expect the above analysis to hold true.
----------------------------------------------------------------------------------------
The analysis is based on signals from 26 technical indicators, out of which 15 are moving averages and the remaining 11 are oscillators. These indicator values are calculated using 4Hr candles.
----------------------------------------------------------------------------------------
Any feedback and suggestions would help in further improving the analysis!

DOGEUSD(4Hr) : DOGE doesn't know where to goMarket in the last 24hrs
DOGEUSD saw a consolidated momentum with price accepting the middle Bollinger band as a resistance line. Trading volume has been low in the last 24 hours.
Today’s Trend analysis
Price is expected to continue its consolidated momentum and oscillate between the middle and bottom Bollinger band. We can expect this to continue till either the price rejects the bottom Bollinger band as a support line or the middle Bollinger as a resistance line.
Price volatility was moderate at approximately 3.5%, with the day's range between $0.189 — $0.205.
Price at the time of publishing: $0.19
DOGE’s market cap: $24.83 Billion
However, the Indicator summary is giving a 'STRONG SELL' signal on DOGEUSD.
Out of 11 Oscillator indicators, 2 are giving a SELL signal, 8 are neutral and 1 is giving a BUY signal.
Out of 15 Moving average indicators, 14 are giving SELL signal, 1 is giving neutral and 0 are giving a BUY signal.
Trading volume has been low in the last 24 hours. If we don't see a sudden spike in volume then we can expect the above analysis to hold true.
----------------------------------------------------------------------------------------
The analysis is based on signals from 26 technical indicators, out of which 15 are moving averages and the remaining 11 are oscillators. These indicator values are calculated using 4Hr candles.
----------------------------------------------------------------------------------------
Any feedback and suggestions would help in further improving the analysis!

Total Market Cap At The Crossroads This chart speaks very loud and clear. We are nearing the end of the road before we see very decisive action. No more floating and dragging out the inevitable.
If Crypto is going to rise again it has until the end of the month at most.
All signs point downward and at this point, you should absolutely prepare for the worst. The next move is going to be a strong and rapid one. It will leave many portfolios into a wasteland if its breaks down from here. Denial will no longer be an option and the path will be crystal clear.
The fact there are still so many bullish outlooks even after looking at so many Bearish Trends tells us there is still hope in the market. It has not reached a point of reversal because the sentiment hasn't completely changed.
You have to remember, Cryptocurrencies are a speculative market. Yes, some of them have real on-book value and BTC has an attractive record but at the end of the day, it's all speculation. A hope that one day they will be completely implemented into our day-to-day lives. This day has not come and the vast majority have never once used Bitcoin or any cryptocurrency in a transaction a single time.
Crypto is only as valuable as we make it. There will come a point speculation meets reality and this is when Crypto will truly shine if it is deemed so. Until then, nothing is certain and many will not flock to Crypto as a safe heaven in this environment. Realistically there are many other alternatives and we could be seeing this taking effect now.
It has now been 80+ days since BTC has made a new high; It has never in the history of Bitcoin corrected for this long in a Bull Run and made new all-time highs in the same year. (There is a first for everything)
The S2F model has been one of the main pillars of hope for the bulls but at this point, it is growing more and more away from the movements. It has held very strong value for the past 12 years and just as BTC has never had a Bull Run cut so short in 12 years, we could potentially see the same for the S2F.
There are clear deviations from the predicted paths and something is stirring up the markets. If the Bull Run is cut short, there was an underlining reason for this to occur in such a strong fashion.
UST's movements have been very strange over the last few weeks and the beloved Meme stocks have been taking a big hit.
More Alt Coins being created every week/month than you can count. Everyone who came in from the outside this year for Cryptocurrencies is still waiting for this moon shot. Influencers pushing pumps and dumping every chance they get. Crypto trading has become a trend. Greed Greed Greed. The strongest factor in corrections. Until the greedy are liquidated, this market can't truly recover. The question is... Who is more greedy? The Bulls or the Bears?
The coming days/weeks will be the ultimate decider of the path forward.
Good Luck Everyone! Happy Trading!

XRP(4Hr) : XRP moving with low volatilityMarket in the last 24hrs
XRPUSD saw some consolidation as the price accepted the bottom Bollinger band as a support line and can be seen moving towards the middle Bollinger band. Trading volume has been moderate in the last 24 hours.
Today’s Trend analysis
As the price reaches the middle Bollinger band, if it accepts the middle Bollinger band as a support line then we can expect the price to see some consolidation with a slight indication of bearish momentum else it will continue to move in an upward direction.
Price volatility was extremely low at approximately 0.2%, with the day's range between $0.587— $0.628.
Price at the time of publishing: $0.623
XRP’s market cap: $28.76 Billion
However, the Indicator summary is giving a 'SELL' signal on XRPUSD.
Out of 11 Oscillator indicators, 2 are giving a SELL signal, 8 are neutral and 1 is giving a BUY signal.
Out of 15 Moving average indicators, 11 are giving SELL signal, 1 is giving neutral and 3 are giving a BUY signal.
Trading volume has been moderate in the last 24 hours. If we don't see a sudden spike in volume then we can expect the above analysis to hold true.
----------------------------------------------------------------------------------------
The analysis is based on signals from 26 technical indicators, out of which 15 are moving averages and the remaining 11 are oscillators. These indicator values are calculated using 4Hr candles.
----------------------------------------------------------------------------------------
Any feedback and suggestions would help in further improving the analysis!

ADAUSD(4Hr): Cardano to see some bullish momentumMarket in the last 24hrs
ADAUSD saw downward movement and can be seen constantly rejecting the bottom Bollinger band as a support line. Trading volume has been high in the last 24 hours.
Today’s Trend analysis
The latest price movement suggests that ADAUSD has accepted the bottom Bollinger band as a support line, so we can expect the price to see bullish momentum till it reaches the middle Bollinger band. If the price accepts the middle band as a support line then we can expect to see some consolidation else the on rejection we can expect the price to reach the upper Bollinger band
Price volatility was moderate at approximately 3.47%, with the day's range between $1.2 — $1.32.
Price at the time of publishing: $1.25
ADA’s market cap: $40.08 Billion
However, the Indicator summary is giving a 'SELL' signal on DOGEUSD.
Out of 11 Oscillator indicators, 1 is giving a SELL signal, 8 are neutral and 2 are giving a BUY signal.
Out of 15 Moving average indicators, 13 are giving SELL signal, 1 is giving neutral and 1 is giving a BUY signal.
Trading volume has been high in the last 24 hours. If we don't see a sudden spike in volume then we can expect the above analysis to hold true.
----------------------------------------------------------------------------------------
The analysis is based on signals from 26 technical indicators, out of which 15 are moving averages and the remaining 11 are oscillators. These indicator values are calculated using 4Hr candles.
----------------------------------------------------------------------------------------
Any feedback and suggestions would help in further improving the analysis!
