NETFLIX can hit $125, then crash back to $85 before stabilizing.Netflix (NFLX) has been trading within a Channel Up since the 2014 consolidation. Last week's massive price jump that even broke and closed back above its 1W MA100 (green trend-line), reclaiming a very pivotal level, is proof that the stock may decouple from the generally pessimistic outlook of the majority of the stock market.
This isn't the first time that Netflix is doing something like that. We can see almost an identical price action back in 2018, which was a correction to the 1W MA100 and the 0.236 Fibonacci retracement level after a multi-year +840% rally from the first Channel Up Low. That fractal rebounded into early 2019 only to get rejected back to the 0.236 Fib before stabilizing and initiating a new long-term Bullish Leg.
The sequence since the 2022 bottom has been very similar, with a +717% rally leading the price to the top (Higher Highs trend-line) of the Channel Up and the mid 2025 decline finding support and rebounding (last week) on the 0.236 Fib. With identical oversold 1W RSI jumps and 1W MACD Bullish Crosses, if the current sequence continues to repeat 2018-2019, we can expect an upper Target around $125.00 followed by a new sell-off back to $85.00 (Fib 0.236) before the next Bull Cycle sustainably leads the stock to $200.
---
** Please LIKE 👍, FOLLOW ✅, SHARE 🙌 and COMMENT ✍ if you enjoy this idea! Also share your ideas and charts in the comments section below! This is best way to keep it relevant, support us, keep the content here free and allow the idea to reach as many people as possible. **
---
💸💸💸💸💸💸
👇 👇 👇 👇 👇 👇
Technology

Verisk Analytics | VRSK | Long at $168.38 Technical Analysis
The stock price for Verisk Analytics NASDAQ:VRSK entered my "crash" simple moving average zone (green lines). The "major crash" zone (gray lines) extends between $137 - $150 and there is a high possibility the price may dip that low in the near-term (especially to close the last price gap since the pandemic near $149). Long-term, given the potential earnings and revenue growth, it looks undervalued at its current price - especially if it enters the "major" crash zone.
Earnings-Per-Share and Revenue Growth Between 2025 & 2028
Projected Earnings-Per-Share Growth : +37.8% (from $6.94 in 2025 to $9.56 in 2028)
Projected Revenue Growth : +22.1% (from $3.1 billion in 2025 to $3.8 billion in 2028)
Health
Debt-to-Equity: 13 (extremely high)
Altman's Z-Score/Bankruptcy Risk: 6.6 (excellent / low risk)
Quick Ratio/Ability to pay current bills: 1.2 (okay, ideally between 1.5 and 3)
Insiders
Mix of selling and buying: openinsider.com
Action
Data from NASDAQ:VRSK is primarily used by the property and casualty insurance industry for underwriting, claims, and compliance. It is also utilized by financial services, energy companies, and government entities (like NOAA and NASA) for predictive modeling, catastrophe risk assessment, and specialized data analytics. It's a company that is readily adopting AI. So, while there is likely near-term weakness and the price may enter the "major crash" zone, NASDAQ:VRSK is in a personal buy zone at $168.38. If the price drops to close the final open gap since the pandemic at $149, I will likely be adding another position.
Targets in 2028
$190.00 (+12.8%)
$210.00 (+24.7%)

Long on thyssenkrupp nucera AG & CO. KGaA (Ticker NCH2)
XETR:NCH2
Technicals:
- the price has been glued to the 9.23 resistance level and zone for a month
- a breakout above this level opens the path to close the gap from Oct 22
- the month-long accumulation suggests that large-scale capital is building a position within the 8.77 – 9.20 range
- the recent squeeze to the 0.23 fibo is nothing more than a stop-loss hunt targeting late-entry passengers who jumped on the train
- scenario invalidated if 2 bar close below 8.77
Fundamentals:
- alkaline water electrolysis (AWE) is considered one of the most reliable and scalable
- maintains a strong balance sheet (net cash position), allowing it to finance expansion without incurring expensive debt
- a large order backlog provides high visibility for future revenue
- however, profitability remains questionable. Despite being profitable at the gross margin level, operating profit frequently fluctuates near zero or turns negative
- increasing pressure from Chinese companies adds fuel to the fire regarding the asset's future valuation
Conclusion:
- this trade represents an interesting speculative position on a breakout of the monthly resistance zone
- but a wider stop at 8.33 is only justified if the Take Profit (TP) is set at 11.65. While theoretically achievable, this target is not guaranteed and would likely require strong fundamental catalysts
# - - - - -
⚠️ Signal - Buy ⬆️
✅ Entry Point Term - 9.13
# - - - - -
🛑 SL - 8.76
🤑 TP - 10.46
⚙️ Risk/Reward - 1 : 2.85 👌
⌛️ Timeframe - 3 months 🗓
# - - - - -
Good Luck! ☺️
DISCLAIMER: Not financial advice. Everyone must make trading decisions at their own risk, guided only by their own criteria and strategy for opening or not opening a trade.

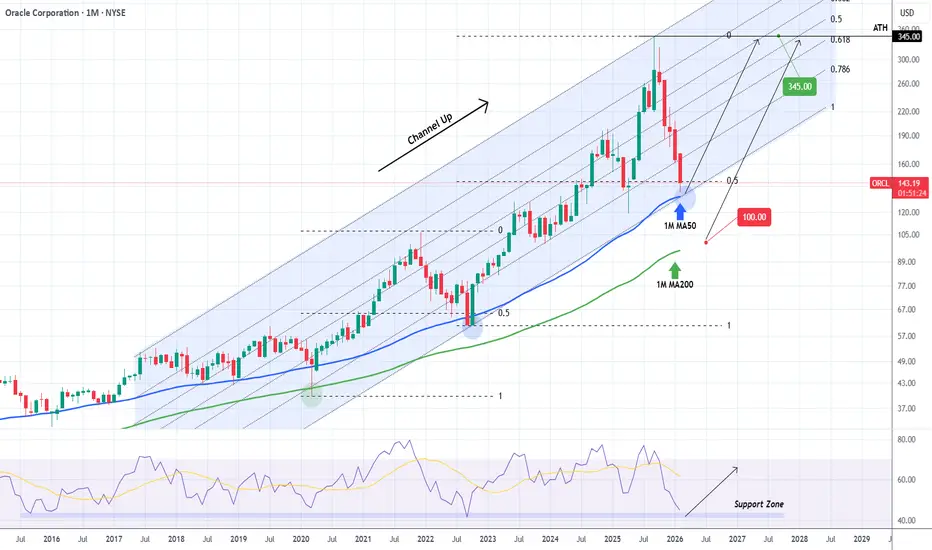
ORACLE on 5 straight red months. Is it finally a buy?Three months ago (November 18 2025, see chart below) we gave a strong Sell Signal on Oracle (ORCL), targeting $170:
Our Target got hit much earlier than expected, with the price currently sitting at just above its 1M MA50 (blue trend-line), which was last tested on October 2022, right at the bottom of the previous (2022) Bear Cycle.
We are obviously within a new Bear Cycle, we stated that clearly on our last analysis but given the fact that the price is this close to both its 1M MA50 and the bottom of the long-term Channel Up, the first Buy Signal is technically emerging. Notice also that at the same time the 1M RSI is only a step away from the 11-year Support Zone.
The most optimal strategy for a long-term investor would be to split the capital that would be otherwise allocated on this stock into two portions. First buy entry would be on the 1M MA50 and second (in which case it would mean that the Channel Up breaks) on the 1M MA100 (green trend-line), which last made contact with in March 2020 (COVID flash-crash).
In both cases the natural Target would be the $345.00 All Time High.
---
** Please LIKE 👍, FOLLOW ✅, SHARE 🙌 and COMMENT ✍ if you enjoy this idea! Also share your ideas and charts in the comments section below! This is best way to keep it relevant, support us, keep the content here free and allow the idea to reach as many people as possible. **
---
💸💸💸💸💸💸
👇 👇 👇 👇 👇 👇
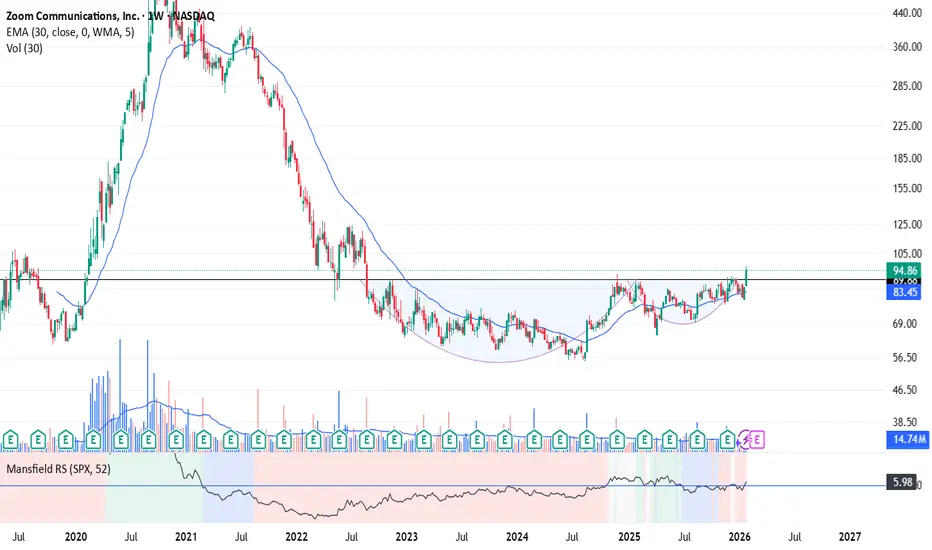
Break out on Zoom? Cup and Handle pattern is seen on this weekly chart but started forming in Aug 2022. Now in early stages of breakout, but not confirmed yet.
Tyler Technologies | TYL | Long at $288.00Technical Analysis
The stock price for Tyler Technologies NYSE:TYL entered the bottom of my "crash" simple moving average zone (green lines). This is often an area of algorithmic share accumulation and can signal a bottom - but not guaranteed. There is a risk of a continued fall into the low $200s in the near-term, but given the potential earnings and revenue growth, there is a high chance of a rebound in the long-term.
Earnings-Per-Share and Revenue Growth Between 2025 & 2028
Projected Earnings-Per-Share Growth : +25.5% (from $12.55 in 2025 to $15.75 in 2028)
Projected Revenue Growth : +43.0% (from $2.0 billion in 2025 to $2.86 billion in 2028)
Health
Debt-to-Equity: 0.2x (healthy)
Altman's Z-Score/Bankruptcy Risk: 8.5 (excellent / low risk)
Quick Ratio/Ability to pay current bills: 1 (okay, ideally between 1.5 and 3)
Insiders
Major selling (**warning**) and no buying
Action
Tyler Technologies NYSE:TYL provides integrated software, technology services, and digital solutions exclusively for the public sector, including federal, state, and local governments, as well as schools. They specialize in automating processes for departments like courts, public safety, property appraisal, and tax collection to improve efficiency and resident services. It's not going anywhere. While there may be some continued near-term weakness, its market niche is strong as demand picks up for data and AI analytics. Thus, at $288.00, NYSE:TYL is in a personal buy zone.
Targets in 2028
$336.00 (+16.7%)
$415.00 (+44.1%)

Morningstar | MORN | Long at $154.15Technical Analysis
Price for Morningstar NASDAQ:MORN has fallen just below my "crash" simple moving average zone (green lines). The "major crash" zone (gray lines) extends down between $136 - $119 and there is a high possibility the price may dip that low in the near-term (especially to close the last price gap since the pandemic at $115). Long-term, given the potential earnings and revenue growth, it looks undervalued at its current price.
Earnings-Per-Share and Revenue Growth Between 2025 & 2028
Projected Earnings-Per-Share Growth : +60.1% (from $9.43 in 2025 to $15.13 in 2028)
Projected Revenue Growth : +29.1% (from $2.4 billion in 2025 to $3.1 billion in 2028)
Health
Debt-to-Equity: 0.7x (good)
Altman's Z-Score/Bankruptcy Risk: 4.8 (excellent / low risk)
Quick Ratio/Ability to pay current bills: 1 (okay, ideally between 1.5 and 3)
Insiders
Major selling (**warning**) and no buying
Action
Due to the good growth potential of NASDAQ:MORN and the technical analysis position, I am personal creating a starter position at $154.15. I am not positive the price will stay in the "crash" zone, though. If it does fall into the "major crash" area and close the $115 gap, a heavier position will be opened at that level.
Targets in 2028
$175.00 (+13.5%)
$197.00 (+27.8%)

AMAZON starting to look a lot like 2022..We posted this long-term Channel Up pattern on Amazon (AMZN) last month for the first time, calling for a potential strong correction due to the similarities so far of 2025 with the 2021 Top formation process.
Early this month, this has been confirmed as following Amazon's pause on its massive rally since the April 2025 Low, the price dropped violently below both its 1W MA50 (blue trend-line) and 1W MA100 (green trend-line). That was because it hit a key Resistance, its 5-year Higher Highs trend-line, technically the top of its long-term Channel Up, that prevented it from making a new All Time High (ATH).
Given the similar 1W RSI Bearish Divergence with 2021, the market is giving us the final signals that the situation is turning up like 2022 again, the year it started a Bear Cycle correction.
Now that the market has closed a 1W candle below the 1W MA100, we expect some consolidation and then a first sell-off towards the 1W MA200 (orange trend-line) with a bearish continuation to at least the 1M MA100 (blue trend-line), which is where the previous Bear Cycle bottomed in late December 2022. Based on its current trajectory, we see a potential contact with it at $150.
Note that a full Bear Cycle, similar to 2022 (which is only realistic if the stock closes a month (1M candle) below the 1M MA100, as it has been holding since November 2006), could lead us to a total -57% correction, a little below $115. If that materializes, the market would make contact with its 1M MA150 (black trend-line) for the first time in its history.
---
** Please LIKE 👍, FOLLOW ✅, SHARE 🙌 and COMMENT ✍ if you enjoy this idea! Also share your ideas and charts in the comments section below! This is best way to keep it relevant, support us, keep the content here free and allow the idea to reach as many people as possible. **
---
💸💸💸💸💸💸
👇 👇 👇 👇 👇 👇

Nvidia’s Vera Rubin Era: Scaling the AI PeakNvidia shattered Wall Street expectations in its fiscal Q4 2026 earnings report, posting record revenue driven by insatiable enterprise demand for accelerated computing. CEO Jensen Huang declared the beginning of a new industrial revolution centered on "Sovereign AI," as the company continues to outpace even the most bullish analyst forecasts.
Vera Rubin: The New Technological Frontier
Nvidia’s technological dominance now shifts from the Blackwell architecture to the Vera Rubin platform. This new system delivers exponential gains in computational efficiency and data throughput. It optimizes power consumption while maximizing training speeds for trillion-parameter models.
The company’s patent portfolio acts as a formidable competitive moat. Recent filings reveal a focus on liquid cooling and optical interconnecting. These patents ensure Nvidia remains the sole provider of integrated AI ecosystems. Competitors struggle to bypass this dense web of intellectual property.
Geostrategic Vulnerabilities and the Taiwan Strait
Geopolitics remains the primary source of volatility for Nvidia shareholders. The company relies heavily on TSMC’s advanced fabrication plants in Taiwan. Any regional instability poses a potential $5 trillion risk to the global economy.
Management is actively diversifying its supply chain to mitigate these geographic threats. They are exploring domestic "Silicon Shield" initiatives in the United States and Europe. However, replacing Taiwan’s precision manufacturing capabilities will take years of concerted effort.
Strategic Leadership and Cultural Innovation
Jensen Huang maintains a flat organizational structure to foster rapid internal innovation. This culture prioritizes agility over traditional corporate hierarchy. Employees operate with high autonomy to solve complex engineering bottlenecks.
The business model has evolved from selling chips to providing full-stack AI solutions. Nvidia’s software ecosystem, CUDA, remains its most effective tool for customer retention. Developers rarely leave the platform due to its integrated libraries and tools.
Macroeconomic Tailwinds and Cyber Resilience
High interest rates have not slowed the capital expenditure of major cloud providers. These "hyperscalers" view Nvidia hardware as essential infrastructure for future survival. Consequently, Nvidia remains decoupled from broader macroeconomic stagnation.
Cybersecurity also drives significant revenue growth for the firm. The latest chips feature hardware-level encryption to protect sensitive training data. As AI threats evolve, Nvidia’s security-first approach becomes a critical selling point for governments.
The Science of Accelerated Scaling
Nvidia is transforming the landscape of modern science through high-tech simulation. Their GPUs now accelerate breakthroughs in climate modeling and genomic research. This expansion into scientific domains provides a hedge against potential consumer AI fatigue.
The company’s leadership understands that data is the new oil. By controlling the refining process, Nvidia dictates the pace of global digital transformation. Investors should expect continued volatility as the world adapts to this unprecedented concentration of power.

GoDaddy (Revised) | GDDY | Long at $75.00***This is a revised examination from:
***Full disclosure: I am still a holder at $128.90.
This is reminder for me and others:
Buying at or near the historical simple moving average (white line) is a 50/50 gamble unless the price is extremely low (say <$5). When it comes to safer investing, wait for a technical "crash" (green lines) or "major crash" (gray lines) and then closely examine fundamentals. Building a position in these two areas has a much larger probability of short- and long-term gains than any higher price point. Don't go "all-in" at the "crash" level. Instead, build a starting position. If a "major crash" happens, add an even greater position (buy pay attention to a company's fundamentals, too). If/when there is a bounce from the "major crash" to the "crash" level, trade out of your original "crash" entry and hold the "major crash" levels.
It's simply one word: discipline.
Thus, now that the price for NYSE:GDDY has fallen between the "crash" and "major crash" areas at $75.00, I added another entry. I am planning an "escape" play now that my cost average is near $100. I'm not convince the "major crash" area won't be hit in the next year, so a larger entry is planned there.
Revised Targets into 2029
$100.00 (+33.3%)
$117.00 (+56.0%)

Intuit | INTU | Long at $350.00Intuit NASDAQ:INTU (QuickBooks, TurboTax, Mailchimp, Credit Karma, etc) has officially entered my "crash" simple moving average area (green lines). While the price may hold up in the near-term around this area and eventually move higher, I suspect there could be weakness down into the "major crash" simple moving average area which currently rests between $241 and $283. $202 could even be reached to close out the last remaining open price gap on the daily chart since the pandemic... This is why I *don't* predict true bottoms - the price can always be lower or go to $0, as they say... But I use probability based on historical data to build a position over time in case the price drops.
Earnings and Revenue forecast (currently high growth).
Thus, I've opened a starter position at $350.00 with much larger entries planned if the price reaches the "major crash" area.
Targets into 2029
$425.00 (+21.4%)
$480.00 (+37.1%)

META on the verge of confirming a brutal Bear Cycle.Meta Platforms (META) has been on a Lower Highs decline since its August 2025 All Time High (ATH) but is being supported by its 1W MA100 (black trend-line) so far. This is the last Support standing before a strong correction, most likely a full-on 2026 Bear Cycle similar to 2022 and 2018.
The 1M RSI is already on a Bearish Divergence since July 2025, a formation that was also present on the July 2018 High. On all Bear Cycles, once the 1W MA100 broke (could be seen also as a 1W MA50-100 Zone), the correction hit at least the 1M MA50 (blue trend-line). Interestingly enough, the drops to the 1M MA50 have been very similar (-40% in 2022 and -44% in 2018).
If repeated (the 1M MA50 drop), Meta should hit at least $480 before hitting it. That is also the 0.236 Fibonacci retracement level, which is where the December 2018 bottom was formed.
The 2022 Bear Cycle was much more brutal though, mainly due to the Metaverse transition in capital expenditure and the stock extended the correction to 1M MA100 (green trend-line) and below, reaching as low as the 1.236 Fibonacci extension from the 2018 Low.
As a result, if the potential 2026 Bear Cycle gets more aggressive and is escalated on certain macro-economic catalysts, we see Meta making a potential contact with both the 1M MA100 and the 1.236 Fibonacci extension around $360. That would represent a -55.82% decline, identical to April 2022 when the market hit the 1M MA100 during that Bear Cycle.
---
** Please LIKE 👍, FOLLOW ✅, SHARE 🙌 and COMMENT ✍ if you enjoy this idea! Also share your ideas and charts in the comments section below! This is best way to keep it relevant, support us, keep the content here free and allow the idea to reach as many people as possible. **
---
💸💸💸💸💸💸
👇 👇 👇 👇 👇 👇

MICROSOFT on the brink of collapse to $300 if the 1M MA50 breaksIt was almost a month (January 27, see chart below) when we last gave a Sell Signal on Microsoft (MSFT) with the price trading at $481.26 on a $410 Target:
Our $410 Target got hit almost instantly on the following 1W candle, something we expected to take months. So with this sheer selling aggression at hand, how low can Microsoft drop under these macro conditions?
Well in technical terms that depends upon the 1M MA50 (blue trend-line). That is the natural long-term multi-year Support of the market that got tested and started the Bullish Legs following the November 2022 and April 2025 Lows. In fact it has been holding since December 2011, which was the last time it traded below it.
As a result, if we get a monthly candle close below the 1M MA50, the market has good chances to seek the next level of Support, the 1M MA100 (green trend-line). Given that Microsoft has been trading within a Channel Up since the 2008 U.S. Housing Crisis, a potential 1M MA100 test would be within the 0.618 - 0.786 Fibonacci retracement levels and would be the biggest correction since that crisis.
In our opinion that contact could be made at $300. Observe also how similar in aggression the current 1M RSI trend is to both 2022 and 2008 corrections. In fact it is currently testing the 44.00 Support, which has been intact since June 2010. Below it the next Support level is the RSI's oversold limit at 30.00, undoubtedly a massive generational buy opportunity.
---
** Please LIKE 👍, FOLLOW ✅, SHARE 🙌 and COMMENT ✍ if you enjoy this idea! Also share your ideas and charts in the comments section below! This is best way to keep it relevant, support us, keep the content here free and allow the idea to reach as many people as possible. **
---
💸💸💸💸💸💸
👇 👇 👇 👇 👇 👇

Palantir reversal underway.Here is the #PLTR chart compared to Silver.
We can observe a softness in this ratio.
This has formed a minor head and shoulders pattern, initiating a downward trend.
In the end, I truly believe that the significant inverse head and shoulders breakout is probably going to be tested.
Michael Burry's puts might very well yield substantial returns as a lot of the AI trade experiences a retracement or backing and filling following some massive upward movements.

NVIDIA Has it already started its correction to $100 ??NVIDIA Corporation (NVDA) has been trading within a 12-year Channel Up and this is not the first time we bring forward this pattern. Both on the 1M and 1W time-frames, as a long-term perspective is required now, the signals of a Cycle Top are there.
The massive RSI Bearish Divergence but more importantly the clear rejection it made in late October 2025 on its Lower Highs Zone, brings forward the similarities with the last two Lower Highs Tops of the Channel Up.
Those Bullish Legs (essentially Bull Cycles) peaked on the second Lower High test and got confirmed when the 1M RSI dropped back again below the overbought territory. A cross below its 1W MA50 (blue trend-line) technically kickstarts this correction (Bear Cycle).
Both previous Bear Cycles bottomed once the touched the 1W MA200 (orange trend-line). The most recent one (October 2022 bottom) even broke below its 0.382 Fibonacci retracement level. As a result, a $100 bearish Target for NVIDIA on its 1W MA200 doesn't seem far fetched at all, given that it will be considerably above the 0.382 Fib this time.
Nevertheless, if the 1M RSI hits the 43.00 - 41.00 Zone before that Target is met, the market will turn into a buy opportunity regardless.
---
** Please LIKE 👍, FOLLOW ✅, SHARE 🙌 and COMMENT ✍ if you enjoy this idea! Also share your ideas and charts in the comments section below! This is best way to keep it relevant, support us, keep the content here free and allow the idea to reach as many people as possible. **
---
💸💸💸💸💸💸
👇 👇 👇 👇 👇 👇

Atlassian Corp (Revised) | TEAM | Long at $81.50This is a revised analysis of Atlassian Corp NASDAQ:TEAM located here:
***Full disclosure, I am still a holder at $180.12.
The entire software industry has been disrupted by AI... so they say. Or, like semiconductor stocks in early 2025 (people quickly forgot about the "doom" selloff...), are the institutional investors cutting shares and accumulating new investments at lower prices in anticipation of exceptional earnings/revenue growth in the future due to AI improving bottom lines? Time will tell.
Technical Analysis
I definitely did not expect a high-growth company like NASDAQ:TEAM to drop the way it has in the past 6+ months. But it is currently unprofitable, which inherently makes a very risky investment. Looking at the chart, NASDAQ:TEAM is currently "bottoming" at the simple moving average levels that it did back in 2022 before risking 80%+ into early 2025. A very important note here is that the "crash" simple moving average zone for this company currently sits between $31 and $48. ANY company hiccup or significant tech sell-off means these levels will be hit - especially since the last remaining open price gap (below the current price) is near $38. It is exactly where the "crash" simple moving average zone is and truly the best entry point. I am personally starting a major entry at $81.50 with a final buy set in the "crash" simple moving average area. My average holding now rests near $105. I hope we don't see $30s and $40s reached soon, but such a drop is an ideal entry for a very long-term hold. I put it now at 50/50 to reach that level if there is a dead cat bounce from the $80s followed by another tech selloff.
Whatch out for any major changes in growth projections (currently high growth) or any bullish insider buying - extremely heavy selling right now...
Revised Targets into 2029
$132.00 (+62.0%)
$189.00 (+131.9%)

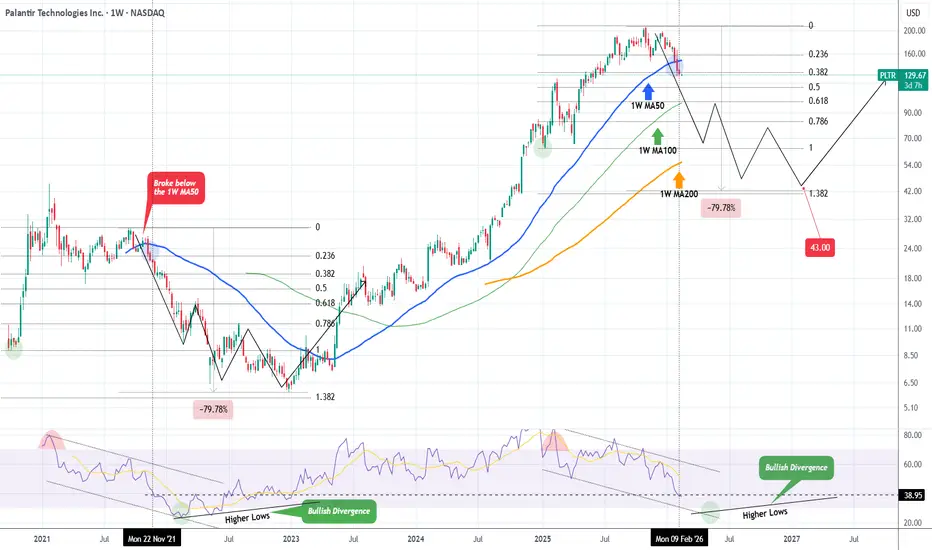
PALANTIR Bear Cycle accelerating. Potential bottom at $43.Palantir (PLTR) was one of the biggest winners of the 2023 - 2025 A.I. driven Bull Cycle but since breaking below its 1W MA50 (blue trend-line) two weeks ago, it has confirmed its new Bear Cycle.
So far this is no different than the previous one in late 2021 - 2022. That Bear Cycle also started when the 1W MA50 broke to the downside, while the 1W RSI was already trending downwards within a Channel Down (as the market has also been doing since 2025 on the current fractal).
Once the 1W MA50 broke, the 2022 Bear Cycle found its first Support when the 1W RSI got oversold (below 30.00), which took place around the 0.786 Fibonacci retracement level. The market eventually bottomed 6 months later after completing a nearly -80% total drop.
The 0.786 Fib on the current fractal is around $82.50 and Palantir may potential make contact with its 1W MA200 (orange trend-line) also by then (RSI possible below 30.00 again). We believe it is possible to go for another -80% total correction, giving a Bear Cycle bottom at $43.00.
---
** Please LIKE 👍, FOLLOW ✅, SHARE 🙌 and COMMENT ✍ if you enjoy this idea! Also share your ideas and charts in the comments section below! This is best way to keep it relevant, support us, keep the content here free and allow the idea to reach as many people as possible. **
---
💸💸💸💸💸💸
👇 👇 👇 👇 👇 👇
Keysight’s Strategic Leap: SOS Enterprise and the AI Data RevoluThe Technological Pivot: Mastering AI Readiness
Keysight Technologies has redefined its market position with the launch of SOS Enterprise. This platform addresses a critical bottleneck in the semiconductor and electronics industries: dirty data. Engineering teams frequently struggle with fragmented files that stall artificial intelligence adoption. SOS Enterprise automates governance and traceability, converting chaotic design files into "AI-ready" assets. This move signals a decisive shift from pure hardware testing to holistic software solutions. Investors must recognize this as a high-margin, recurring revenue play that creates deep ecosystem stickiness.
Geopolitics and Geostrategy: Navigating the Chip Wars
Global trade tensions heavily influence Keysight's operational landscape. The ongoing US-China semiconductor rivalry necessitates strict intellectual property (IP) control. SOS Enterprise directly mitigates geopolitical risk by offering region-specific compliance and geofencing. Companies can now enforce data sovereignty, ensuring sensitive designs remain within authorized borders. This capability becomes a strategic asset for defense and aerospace clients navigating International Traffic in Arms Regulations (ITAR). Keysight effectively monetizes global instability by selling the shield that protects sovereign tech assets.
Industry Trends: The 6G and AI Convergence
The industry is racing toward 6G and autonomous systems, requiring unprecedented simulation complexity. Traditional manual data management fails under this weight. Keysight capitalizes on this trend by integrating design data management with its dominance in radio frequency (RF) testing. The market demands speed; SOS Enterprise accelerates time-to-market by enabling reliable IP reuse. This alignment with the "speed-to-innovation" megatrend ensures Keysight remains indispensable to top-tier chipmakers like NVIDIA and Qualcomm.
Business Models: The Software Transformation
Keysight is aggressively decoupling its growth from hardware cycles. The introduction of SOS Enterprise exemplifies a transition toward Software-as-a-Service (SaaS) dynamics. Hardware sales are cyclical and capital-intensive; software licenses offer predictable, scalable cash flow. This evolution commands a higher valuation multiple from Wall Street. Analysts project that software-driven workflows will stabilize earnings during hardware inventory corrections. The company is successfully building a "moat" where the cost of switching providers becomes prohibitively high.
Management and Leadership: Visionary Execution
CEO Satish Dhanasekaran demonstrates astute leadership by targeting the "soft spots" of engineering workflows. Management understands that hardware excellence is commoditized without superior data orchestration. Their acquisition strategy and internal R&D now prioritize the digital thread connecting design to test. This foresight positions the company ahead of competitors who remain fixated solely on physical measurement. Leadership’s ability to execute this software pivot without alienating its core hardware base is a testament to disciplined operational governance.
Macroeconomics and Economics: Resilience in Volatility
High interest rates typically dampen capital expenditures in R&D-heavy sectors. However, efficiency tools like SOS Enterprise become essential during economic tightening. Companies adopt automation to reduce headcount costs and error rates when budgets are tight. Keysight’s solution offers a deflationary force for its clients, promising lower operational costs. Consequently, the stock shows resilience against macroeconomic headwinds, as the value proposition shifts from "capacity expansion" to "efficiency optimization."
Cyber Security and Patent Analysis: Protecting the Crown Jewels
In the high-tech sector, a company’s valuation relies heavily on its patent portfolio. SOS Enterprise acts as a vault for this intellectual capital. By tracking the lineage of every design file, Keysight provides a forensic audit trail that deters IP theft. This feature is critical for clients facing cyber espionage threats. From a patent perspective, Keysight continues to file aggressively in EDA (Electronic Design Automation) and signal processing. This legal fortification secures their dominance in the test-and-measurement niche against emerging rivals.
Scientific Innovation: The Physics of Data
Keysight’s roots lie in the hard sciences, physics, and electromagnetics. SOS Enterprise bridges the gap between theoretical physics simulations and real-world empirical data. It ensures that the massive datasets generated by oscilloscopes and network analyzers are usable for machine learning training. This scientific integrity differentiates Keysight from generic IT data firms. They understand the physics of the signals, making their data governance tools scientifically superior for engineering applications.

Is big money seeing a bottom to the SaaS collapse?HubSpot moved higher after earnings on more than double its average volume, and the OBV line turned sharply up, confirming that the move was driven by real buying rather than just short‑term noise. With ADX sitting near 50, the trend strength is high, which suggests this could be the start (or resumption) of a powerful move rather than a one‑day spike.
Any thoughts? I have been just watching as I bought CSU to early during the fall, but maybe we are getting to the bottom of the SaaS through.

Is this the distribution phase for Meta before heading south?It looks like Meta has failed again to break above the 750 resistance level.
Do you think it’s entering a distribution phase before potentially moving lower?
It is possible that it could drop toward the 480 support range, or even lower?

H&R Block | HRB | Long at $28.72Technical Analysis
The stock price for H&R Block NYSE:HRB has entered my "crash" simple moving average zone (green lines). A continued decline into the "major crash" zone (gray lines) to close out the last remaining price gap (near $24) is highly likely in the near-term. I believe this decline will be linked to economic declines tied to small- and middle-sized businesses in 2026. However, regardless of bottom and economic predictions, I am creating a starter position at $28.72 using data-informed decisions. I plan to add more if/when the price drops to close the open price gap around $24 - unless the US economy implodes.
Growth
Projected Earnings-Per-Share Growth : +57.7% (from $4.66 in 2025 to $7.35 in 2028)
Projected Revenue Growth : +7.9% (from $3.8 billion in 2025 to $4.1 billion in 2028)
Health
Debt-to-Equity: 22.8x (high debt - risky)
Altman's Z-Score/Bankruptcy Risk: 2.8 (good, minor risk)
Quick Ratio/Ability to pay current bills: 1.2 (okay, but ideally between 1.5 and 3)
Action
I do believe more downside is ahead. There is a high probability of a continued decline into my "major crash" historical moving average area - potentially even below $24. The debt-to-equity is high, but it is a strong company. If this company small- and mid-size business issues in 2026, I believe there could be some upside. Thus, at $28.72, NYSE:HRB is in a personal buy zone with further entries planned at $24 and below.
Targets into 2028
$35.00 (+21.9%)
$47.00 (+39.3%)

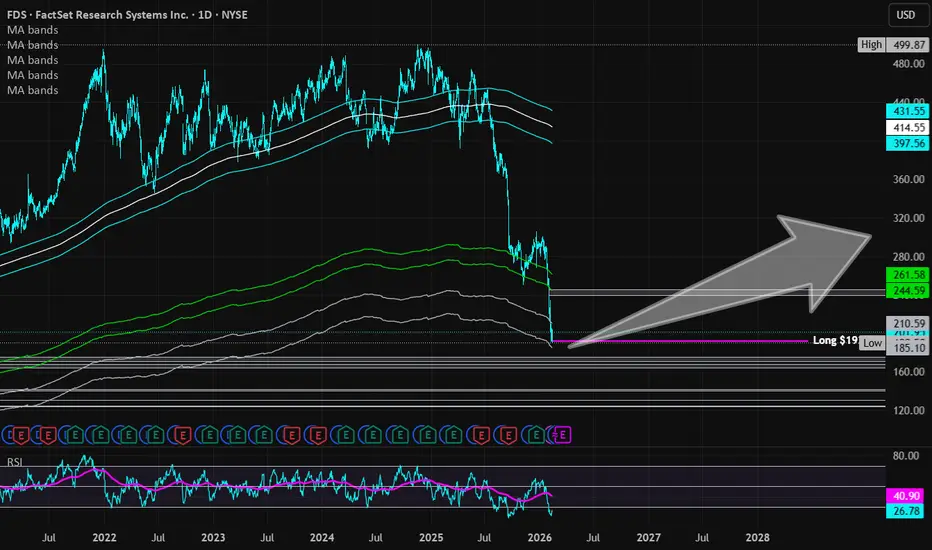
FactSet Research Systems (Revised) | FDS | Long at $192.00This is a revised analysis of FactSet Research Systems NYSE:FDS found here:
***Full disclosure: I am still a holder at $284.10.***
While my general analysis found above hasn't changed (excluding targets), I tripled my position at $192.00 now that the price has entered my "major crash" historical simple moving average zone. My average holding is near $205. I plan to sell the original $284.10 entry when the price rises and keep these "historical" lows until targets are reached.
A personal concern I have is that there are no open price gaps above $245. If $245 is hit, the RSI moves faster than it should, and then the stock starts to plummet, I plan to set a stop at $192.00 and walk away. The algos may destroy this since there are no targets to close above $245, yet there are plenty open below that. Simply staying cautious here.
Fundamentals still look good for NYSE:FDS , but they are not the only factor controlling price.
Revised targets into 2028
$245 (+27.6%)
$300 (+56.3%)
Insperity | NSP | Long at $26.00Technical Analysis
The stock price for Insperity NYSE:NSP has fallen below my "crash" simple moving average zone (green lines). A continued decline into the "major crash" zone (gray lines) is highly likely (currently between $15-$22). These often areas of algorithmic share accumulation and can signal a bottom - but it doesn't mean a trickle down won't happen. I believe recovery will be after 2026, so patience for investors is necessary for this one.
Earnings-Per-Share and Revenue Growth Between 2025 & 2028
Projected Earnings-Per-Share Growth : +280.6% (from $1.03 in 2025 to $3.92 in 2028)
Projected Revenue Growth : +17.6% (from $6.8 billion in 2025 to $9 billion in 2028)
Health
Debt-to-Equity: 9.9x (high debt)
Altman's Z-Score/Bankruptcy Risk: 3.9 (healthy / low risk)
Quick Ratio/Ability to pay current bills: 1.1 (okay, but ideally between 1.5 and 3)
Insiders
Mostly buying: openinsider.com
Action
I do believe more downside is ahead. There is a high probability of a continued decline into my "major crash" historical moving average area - potentially even down to $15 (watch out for dividend cut to trigger said level). The debt-to-equity is high, but it is otherwise a low bankruptcy risk. If this company can weather 2026, I believe there could be significant upside. Thus, at $26.00, NYSE:NSP is in a personal buy zone with further entries planned between $15.00 and $18.00.
Targets into 2028
$34.00 (+30.8%)
$47.00 (+80.8%)
