QQQ --- AI Tech Bubble Keeps GrowingRight now, not much seems to be stopping the bubble in Tech. You can see we broke above resistance on June 11th and have not looked back. I was expecting some form of test of support, like back in July 2020, but instead any pullback has been bought up. Volume is low and that means that everyone is long to go along for the ride. If we get a run up like back in August 2020, we could top out at the $550 range.
We are in the region of extra hard to predict what will happen next. Without a clear reason to sell, this can keep going. I would expect to see some form of profit taking that could make for a bigger pullback, but so far nothing. I think the saying "The Market Can Remain Irrational Longer Than You Can Remain Solvent" comes to mind.
I am curious if we are in for a case of "buy the rumor, sell the news" when it comes to interest rate cuts. Maybe this will keep going up until we actually get a rate cut.
1D
Techsector

$TSLA Contrarian Bounce Against the Market Grain.$TSLA:1D
Price breaks out of downtrend at +3SD (190.79).
Potential ‘gap-fill’ up to 206.
Bullish price to RSI divergence. (yellow lines)
Pearson’s R^2 is extremely high and I don’t believe this level of trend strength can be maintained at these levels of elevation for a very extended period of time.
Significant inverse correlation to relevant index ETF ( NASDAQ:QQQ ) makes NASDAQ:TSLA a theoretically contrarian trade for me assuming I have a bearish sentiment on broader tech sector as represented by $QQQ. Given how beaten up the stock has been I believe it could rise against a falling tech sector, at some point over the next 90 days.
First target is 198 level, second target is filling the gap up to 206 and the third and final ‘reach target’ would be the 0.5 retrace at 222.60. I would be happy with 2/3 of these being completed.
If the trade went against me, I see the worst case, downside, scenario as a further spill to the 1.382 (147.56) with a drop to the mid 160’s as more likely in the event of a downturn. My thesis is long but outlining the downside scenario is an important part of managing risk for me.
Happy trading.

SMCI Has it topped?Super Micro Computer Inc. (SMCI) is about to complete a 10 straight green week streak if the 1W candle closes bullish today. This is a highly impressive feat that not only it hasn't done before but only a few stocks have managed to do historically. On the other hand, this may be a signal that yet again, SMCI is time to take a breather.
Why? First because it has completed a +417.86% price increase since the October 30 2023 Low, which is the exact % rise the stock did during its previous Bullish Leg from January 27 2023 to July 31 2023. At the same time, the 1W RSI is testing the top (Higher Highs trend-line) of the Channel Up that started in June 2018.
If rejected today, we expect the stock to correct by -35.55%, which might be significant, but nothing compared to the rise it has achieved. In fact as you can see on the chart, such % decline has been very common in the past 4 years. Amidst the correction, we expect it to make contact with the 1D MA100 (red trend-line). As long as the 1W MA50 (blue trend-line) holds as a Support, the long-term bullish trend is intact, and every such correction is a long-term buy opportunity.
-------------------------------------------------------------------------------
** Please LIKE 👍, FOLLOW ✅, SHARE 🙌 and COMMENT ✍ if you enjoy this idea! Also share your ideas and charts in the comments section below! This is best way to keep it relevant, support us, keep the content here free and allow the idea to reach as many people as possible. **
-------------------------------------------------------------------------------
💸💸💸💸💸💸
👇 👇 👇 👇 👇 👇


Tech stock Vs Energy stocks. The Competition for Decades This is an education-style publication where the main graph is a comparison (ratio) between two ETFs (funds) managed by State Street Global Advisors Corporation, the creator of the world’s first ETF (well-known in nowadays as AMEX:SPY ) and an indexing pioneer.
The first one ETF is The Technology Select Sector SPDR Fund, AMEX:XLK .
👉 AMEX:XLK seeks to provide investment results that provide an effective representation of the Technology sector of the S&P 500 Index SP:SPX .
👉 AMEX:XLK seeks to provide precise exposure to companies from Technology hardware, storage, and peripherals; software; communications equipment; semiconductors and semiconductor equipment; IT services; and electronic equipment, instruments and components.
👉 AMEX:XLK is a place where securities of American World-known Technology companies like Apple Inc. NASDAQ:AAPL and Microsoft Corp. NASDAQ:MSFT , like Nvidia Corp. NASDAQ:NVDA and American Micro Devices NASDAQ:AMD , like Cisco Systems Inc. NASDAQ:CSCO and Adobe Inc. NASDAQ:ADBE meet together.
👉 In contrast with other Technology-related ETFs like NASDAQ:QQQ (Invesco Nasdaq 100 Index ETF) or NASDAQ:ONEQ (Fidelity Nasdaq Composite Index ETF), stocks allocation in AMEX:XLK depends not only on their market capitalization, but also hugely on Technology industry allocation (like software, technology hardware, storage & peripherals, semiconductors & semiconductor equipment, IT services, communications equipment, electronic equipment instruments & components).
That is why allocation of Top 3 holdings in AMEX:XLK ( Microsoft Corp. NASDAQ:MSFT , Apple Inc. NASDAQ:AAPL and Broadcom Inc. NASDAQ:AVGO ) prevails 50 percent of Funds assets under management.
👉 Typically AMEX:XLK holdings are Growth investing stocks.
The second one ETF is The Energy Select Sector SPDR Fund, AMEX:XLE .
👉 AMEX:XLE seeks to provide investment results that provide an effective representation of the energy sector of the S&P 500 Index SP:SPX .
👉 AMEX:XLE seeks to provide precise exposure to companies in the oil, gas and consumable fuel, energy equipment and services industries.
👉 AMEX:XLE allows investors to take strategic or tactical positions at a more targeted level than traditional style based investing.
👉 AMEX:XLE is a place where stocks of American World-known Oil companies like Exxon Mobil Corp. NYSE:XOM and Chevron Corp. NYSE:CVX , like EOG Resources Corp. NYSE:EOG and ConocoPhillips NYSE:COP , like Valero Energy Corp. NYSE:VLO and Phillips 66 NYSE:PSX meet each other.
👉 Weight of Top 3 holdings in AMEX:XLE (Exxon Mobil Corp. NYSE:XOM , Chevron Corp. NYSE:CVX and EOG Resources Corp. NYSE:EOG ) prevails 45 percent of Funds assets under management.
👉 Typically AMEX:XLE holdings are Value investing stocks.
The main graph represents different stock market stages of work
🔁 Early 2000s, or post Dot-com Bubble stage, that can be characterized as Energy Superiority Era. There were no solid Quantitative Easing and Money printing. U.S. Treasury Bond Interest rates TVC:TNX , TVC:TYX as well as U.S. Federal Funds Rate ECONOMICS:USINTR were huge like nowadays. Crude oil prices TVC:UKOIL , TVC:USOIL jumped as much as $150 per barrel.
The ratio between AMEX:XLK and AMEX:XLE funds collapsed more than in 10 times over this stage.
🔁 Late 2000s to early 2010s, or post Housing Bubble stage, that can be characterized as a Beginning of Quantitative Easing and Money printing. U.S. Treasury Bond Interest rates TVC:TNX , TVC:TYX as well as U.S. Federal Funds Rate ECONOMICS:USINTR turned lower. Bitcoin born.
The ratio between AMEX:XLK and AMEX:XLE funds hit the bottom.
🔁 Late 2010s to early 2020s, or post Brexit stage, that can be characterized as a Continuation of Quantitative Easing and Money printing. U.S. Treasury Bond Interest rates TVC:TNX , TVC:TYX as well as U.S. Federal Funds Rate ECONOMICS:USINTR turned to Zero or so. Crude oil turned to Negative prices in April 2020 while Bitcoin hit almost $70,000 per coin in 2021.
Ben Bernanke (14th Chairman of the Federal Reserve In office since Feb 1, 2006 until Jan 31, 2014) was awarded the 2022 Nobel Memorial Prize in Economic Sciences, jointly with Douglas Diamond and Philip H. Dybvig, "for research on banks and financial crises", "for bank failure research" and more specifically for his analysis of the Great Depression.
The ratio between AMEX:XLK and AMEX:XLE funds becomes great and respectively with monetary stimulus hit the all time high.
🔁 Early 2020s, or post Covid-19 Bubble stage, that specifically repeats early 2000s Energy Superiority Era. There is no again Quantitative Easing and Money printing. U.S. Treasury Bond Interest rates TVC:TNX , TVC:TYX as well as U.S. Federal Funds Rate ECONOMICS:USINTR are huge nowadays like many years ago. Commodities prices like Wheat CBOT:ZW1! , Cocoa ICEUS:CC1! , Coffee ICEUS:KC1! , Crude oil prices TVC:UKOIL , TVC:USOIL jump again to historical highs.
The ratio between AMEX:XLK and AMEX:XLE funds is fading to moderate levels that can be seen as 200-Month simple moving average.
💡 In a conclusion.. I wonder, how the history repeats itself.
This is all because markets are cyclical, and lessons of history always still remain unlearned.
💡 Author thanks PineCoders TradingView Community, especially to @disster PineCoder for its excellent and simple script Quantitative Easing Dates .
Based on this script, Easing Dates are highlighted at the graph.

Bullish on Indian Tech StocksThe top 4 Tech Charts look strong and bullish, InfoSys being the weakest of the bunch and chugging along.
As long as the prices stay above the Green Trap Zone we are Bullish on these 4 symbols.
Boost Ideas If you like and lets Go !

Fiserv: Soon… ☺️Soon, Fiserv should reach the magenta colored zone between $134.09 and $140.81 and complete wave (B) in magenta – there is only little difference in altitude left. Once this top is placed, the share should turn downwards, heading for its next goal: the southern magenta colored zone between $108.96 and $89.26, where wave (C) in magenta and wave 4 in green should end. From there, wave 5 in green should carry Fiserv to the final top of wave I in gray, concluding an overarching upwards movement. There is a 33% chance, though, that the share could leave the next magenta zone on the upper side, developing wave alt.I in gray earlier already and thus cold-shouldering the magenta zone in the south.

Booking Holdings: Reservation confirmed 🏨Booking Holdings has booked a room in our dark green target zone between $2939 and $3096 and should reach this destination via wave b in gray. During its stay, the share should establish the distinctive top of the current movement and then leave its dark green lodging on the southern side, heading for the support at $2456. However, there is a 30% chance that wave alt.b in gray could have already checked out and that Booking Holdings could start its journey below $2456 earlier. In that case, the dark green hotel room would remain vacated.

Snowflake: Gone with the Wind… 🌬(Un-)fortunately, we won’t rehash the story of Scarlett and Rhett, which took director Victor Fleming nearly 4 hours to recount. We will rather talk about Snowflake, which currently seems to be struggling though a snowstorm, fighting on toward the resistance at $203.62. We expect the share to gust above this mark to expand wave x in magenta before a counter movement should take hold. However, there is a 40% chance that wave alt.x in magenta could be finished by now. In that case, Snowflake would waft below the support at $110.27 to develop wave alt.2 in turquoise already, whose low should then be followed by a fresh upwards movement.

Block: In the starting blocks… 👟Block hast just finished wave B in turquoise and is in the starting blocks to take off. Soon, the share should gain enough upwards momentum to make it above the resistance at $89.97 and even further from there. However, there is a 39% chance that Block could break away and slip below the support at $51.16. In that case, the share should develop a new low in the form of wave alt.2 in green first before heading upwards. This new low would then be located in the magenta-colored zone between $40.97 and $19.12.

Broadcom: Slide 🛝Broadcom is amusing itself in the playground consisting of the green zone between $648.08 and $577.41 and has lately been lingering mainly at the 78.60%-retracement at $621.54. However, soon, the share should switch over to the red slide leading below the support at $572.10 and into the lower green zone between $531.78 and $465.02 to finish wave 2 in green. This low should then grant the share new upwards momentum. There is a 37% chance, though, that Broadcom could prefer the jungle gym and thus climb above the resistance at $648.50. In that case, we would expect a new high in the form of wave alt.1 in green in the magenta-colored zone between $673.07 and $774.04 first, before the downwards movement can start again.

Tech sector below Cosmic Gravity supportE-mini technology sector futures price recently broke below Cosmic Gravity "Support Channel"(😎) and failing to break back above this level dropped back down (🧐). A next possible long entry position is now at "S6 Line".

NASDAQ- QQQ ETF day trading idea Hi Traders,
On daily timeframe market has touched 50% Fib level, Jackson Hole Symposium starting Thursday. we might expect some volatility in the market
Future us running in negative - Market might gap down when open

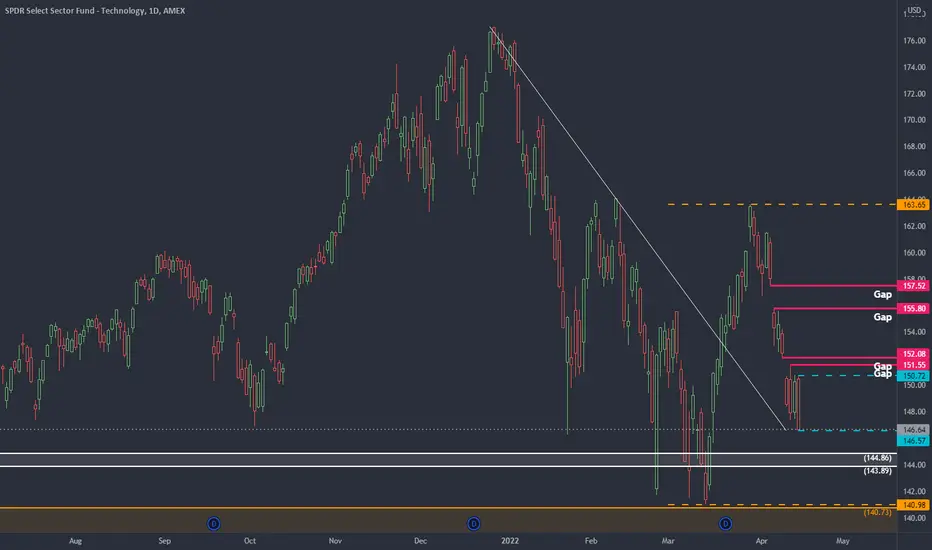
XLK Technology Sector: Signals of DivergenceAs the growth sector #XLK and #NDX makes lower lows there are spots of divergence displaying, which could pose as some upward impulses this week. In that case it could help to normalize a temporary ‘higher low’ in terms of the holistic outlook.
My TradingView charts (found at #bsdvs23) have mostly been bearish across the board with a few ‘potential’ bullish intraday traders here-and-there based on the broader technical structure. But that is neither here nor there since the major outlook of the trends is what is most important.
All that being said, signs of divergence are now signaling that this area of ‘the higher low’ (big picture) could be setting up for the next leg upward impulse movement in an effort of retesting the lower highs. Granted this will take ‘time and price’ to get to that level and coincidentally coincides with the major earnings session upon us.
And I should point out the bearish side of things as well to ensure the audience has the perspective of both sides here. The downside risk is the markets heading for those March lows. Something I have been very focused on the entire month of April in my YouTube videos, Facebook posts, and postings within TradingView.
All-in-all, divergence is poking its head and that should provide caution to the wind for the bears.
We will keep watch and monitor the Futures Markets as well as the sector spiders and other stocks for turning points going into the economic events this week as I will notate those below.
Mon, Apr 18
- 10:00am NAHB Housing Market Index
- Day 1 IMF Meetings
- 4:00pm FOMC Member Bullard Speaks
Tue, Apr 19
- 8:30am Building Permits
- Housing Starts
- Day 2 IMF Meetings
Wed, Apr 20
- 10:00am Existing Home Sales
- Day 3 IMF Meetings
- 10:30am Crude Oil Inventories
- 2:00pm Beige Book
Thu, Apr 21
- 8:30am Philly Fed Manufacturing Index
- Unemployment Claims
- 10:00am CB Leading Index
- Day 4 IMF Meetings
- 10:30am Natural Gas Storage
- 1:00pm Fed Chair Powell Speaks
Fri, Apr 22
- 9:45am Flash Manufacturing PMI
- Flash Services PMI
NASDAQ technical rebound in playAs projected (in previous idea post), the NASDAQ futures spiked down to (almost) 13K and then bounced immediately. This happened on Thursday after the open initiation of the Russia-Ukraine global event. The following day continued the recovery rally.
The Weekly candlestick is now very bullish looking as there formed an intraweek ultra long tail of almost 1K index points. While technicals point to a bearish scenario overall, the NASDAQ was briefly in bear correction territory but recovered. This suggest bullishness.
The Daily candlestick pattern is also rather bullish, with a similar intraday long tail and a near marubozu body engulfing, followed through by another bullish candle that closed the day (and week) at the top. The MACD has a bullish divergence that is just turning upwards in support.
Fractal bullishness here.
The next couple of weeks in March are indicated to be bullish, through to 14.5K, and testing 15.5K. Whether the bullish effort is sustainable through past March remains to be seen.
I am optimistic for the NASDAQ into March, but weary as March wanes into April...

Tech Sector Setting Up for Big Monthly Bearish PullbackWe have a Bearish Engulfing on the Monthly along side with extreme amounts of RSI Bearish Divergence and soon the MACD will be crossing bearishly for the first time since 2018. In the past the monthly bearish crossing has lead to at least a 30% correction back down to the 55 Month SMA.
One last thing to note is that if this Monthly Candle continues down a little further and closes below the open of October 2021, this pattern will be upgraded from just a simple Bearish Engulfing to being a Bullish Three Line Strike visible on the Monthly Timeframe which is a very bearish pattern as One Month would have Erased the gains of the Prior 3 Months and at that point you almost have a Guarantee that the Tech Sector will see a much more Sustained Correction the Downside.

NASDAW Futures Future Sneak PeakThe NQ1! appears to have come to a significant milestone, one that has been repeated 4 times since 2006. And each time, IF you had bought into the NASDAQ / Technology ETF, it would have been significantly wonderful in the next 3-4 years.
It appears that this milestone had just happened again two days ago. Now, what does this mean?
I will leave that to you to decide.
Maybe we can revisit this post next year and go "Wow, the fifth time..."
Btw, the events are coded to present markers when certain combinations of Bollinger Bands are exceeded.
ENJOY!!!
PS. Sneak peak to the projections I do, marking out 19 Jan as a top and the next incoming date is there too... #justsaying

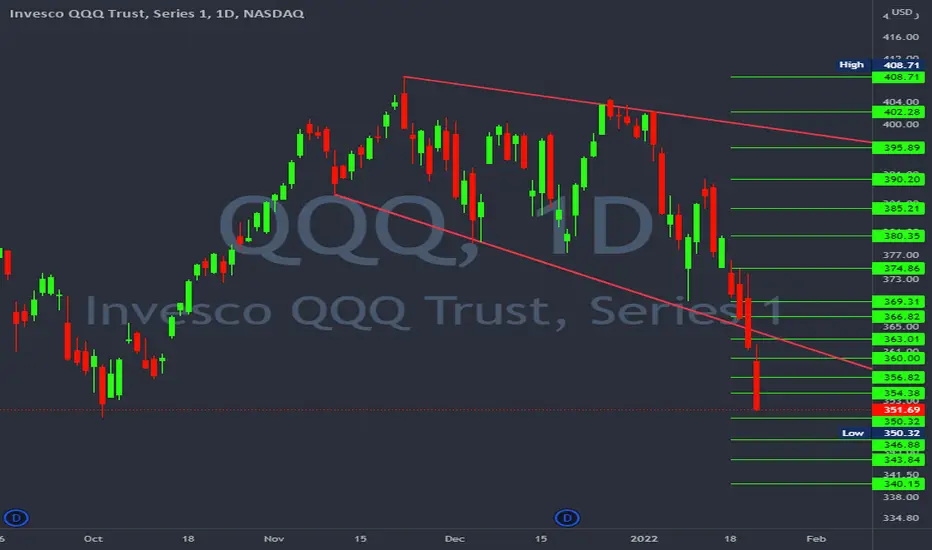
#QQQ - Tech led the way downTech led the way down on the market pullback last weak. Every rip was being shorted. If QQQ can hold 350 this week we can start to see a bottom form. Calls will be easier once we can close above 363. If QQQ fails to hold 350 this week we can see another 10 point drop.
RBLX Strong Growth Potential - Roblox I am Familiar with this company as all my children play or use some game on the
Roblox Network . Upon having to submit my debit card info to the kids to top up on some power they need
in game or to reach a new level I can say that Roblox have captured there market very well .The Kids to Play and the Adults to Pay .
With better than expected results on the last earnings and the current picture on world affairs I can see a strong argument for growth in this sector .
This is a newly listed company and as drawn on the chart we are trading within a Ascending Channel and are currently testing the top of the channel.
We may break out of the channel but I expect to back test support which sits at the point of control and a FIB .618 pull for additional confluence.
This will be a great Buy opportunity when it presents itself , in the meantime set an alert close to this region and be prepared to pull the trigger for a stock that
has Strong growth potential .
Ensure you know your Invalidation and use a SL , any questions then please ask , Drop me a LIKE and FOLLOW for regular Setups.

$MVIS shares soar after Microsoft's $22B HoloLens contractMicrovision shares soar after Microsoft's $22B HoloLens mixed reality headset contract with the U.S. Army contract
Microvision, once rumored to be an acquisition target for Microsoft, is reportedly a supplier for the HoloLens 2 models.
seekingalpha.com

$IVAC shares soar after Microsoft's $22B HoloLens contractIntevac shares soar after Microsoft's $22B HoloLens contract with the U.S. Army
Intevac supplies electro-optical devices and is in Microsoft's supply chain.
seekingalpha.com

US100 - correction over?I see an impulse, an ABC correction to 61.8 fib (market with blue horizontal line) and it should bounce up. Resistance above, though, and we are exposed to further downside.
Either way, long with SL 1% below previous low at the 61.8 fib.

$DLPN Launches Non-Fungible Tokens Creation & Marketing DivisionDolphin Entertainment Launches Non-Fungible Tokens (NFTs) Creation and Marketing Division; Expects First Partnership in Collectibles
New division will make and promote NFTs for Dolphin and for its film, television, music, gaming, epicurean and technology clients.
We expect several upcoming projects and partnerships that will combine our creative and marketing expertise to bring exciting offerings to the NFT marketplace."
finance.yahoo.com
