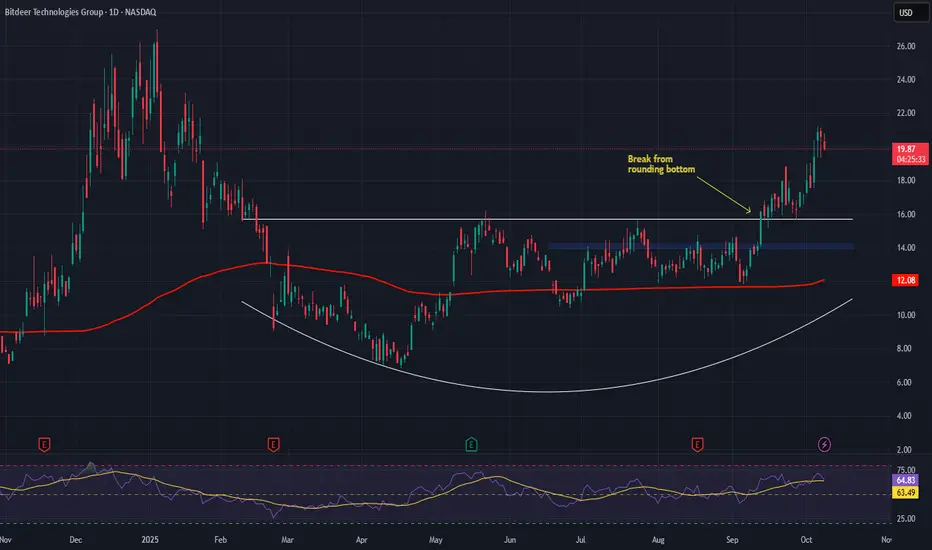
BITDEER – Bullish Outlook as Blockchain Meets AI PowerhouseBitdeer Technologies Group NASDAQ:BTDR is gaining serious traction as a dual-play on blockchain infrastructure and AI-driven compute power. The company operates at the intersection of crypto mining and artificial intelligence cloud services, offering exposure to two of the most dynamic sectors in tech.
🔍 Key Catalysts:
🚀 Revenue Momentum
Q2 2025 revenue surged +56.8% YoY, driven by expanding mining operations and renewed Bitcoin market strength.
📈 Massive Hashrate Growth
Bitdeer targets 40 EH/s of self-mining capacity by October, making it one of the largest global mining operators, well-positioned to ride institutional Bitcoin adoption.
🧠 AI Infrastructure Expansion
Transitioning beyond pure crypto, BTDR is doubling down on high-performance computing (HPC). Its AI Cloud platform, which won the 2025 AI Breakthrough Award, utilizes 1.6 GW of power capacity to run demanding AI workloads—marking a major evolution in the company’s model.
🌍 Global Footprint
A diversified presence across multiple geographies adds scalability and shields against regulatory shifts—a key edge in today’s policy-sensitive environment.
📌 Technical Setup:
We are bullish above the $14.00–$14.25 breakout zone. Sustained price action above this level could pave the way for an upside target of $27.00–$28.00 in the medium term.
Techstocks
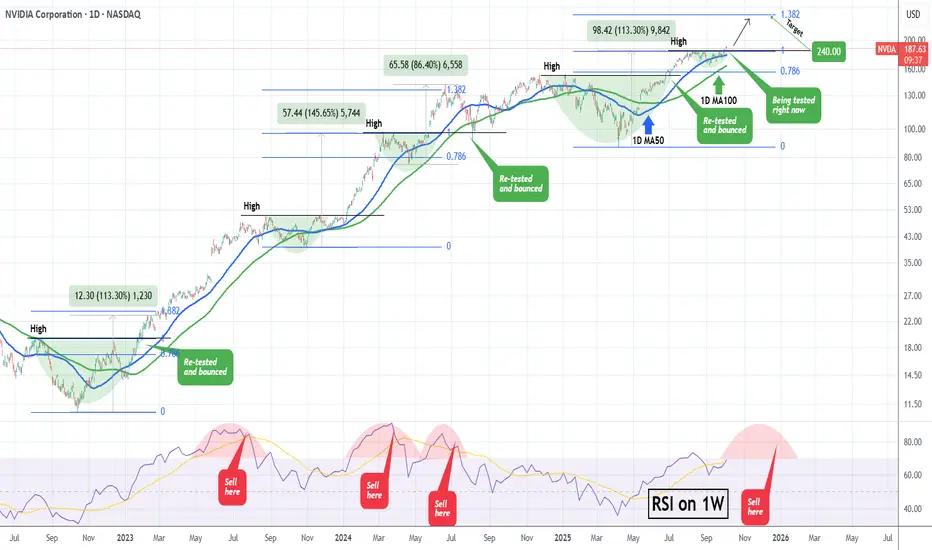
NVIDIA What happens when it retests a Resistance after a break?NVIDIA Corporation (NVDA) has been on a strong rise since the mid-term September 05 Low and this week finally broke above its previous $184 High. During the current Bull Cycle (since the October 2022 bottom), every time the price broke above a previous High and re-tested it as a Support, it started a secondary rally to new Highs.
Technically, as long as the 1D MA100 (green trend-line) holds, we should see at least a 1.382 Fibonacci extension test, similar to the February 2023 and June 2024 Highs. As a result, once the current former High / Resistance level finishes getting re-tested, we expect an end-of-the-year rally to $240.
Additionally, we will keep an eye on the 1W RSI. Typically, once it gets massively overbought above 85.00 and then starts to decline within an Arc peak formation, the time to Sell is after the middle of that Arc.
-------------------------------------------------------------------------------
** Please LIKE 👍, FOLLOW ✅, SHARE 🙌 and COMMENT ✍ if you enjoy this idea! Also share your ideas and charts in the comments section below! This is best way to keep it relevant, support us, keep the content here free and allow the idea to reach as many people as possible. **
-------------------------------------------------------------------------------
💸💸💸💸💸💸
👇 👇 👇 👇 👇 👇
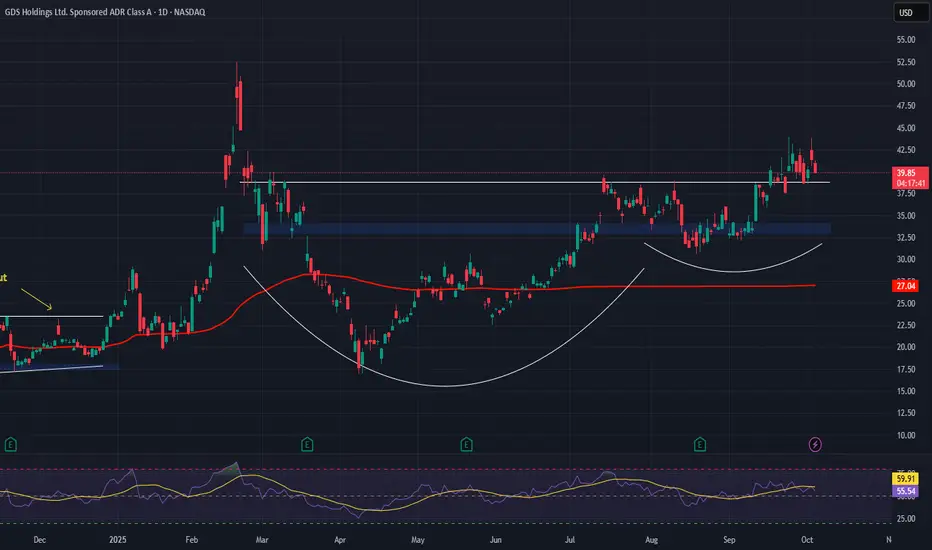
GDS Holdings (GDS) – Bullish Setup in the AI-Data Center BoomGDS Holdings Limited NASDAQ:GDS is emerging as a key player in Asia’s data infrastructure race, positioned to capitalize on explosive demand for AI-ready, high-density data centers.
🔍 Thesis Summary:
$1.2B Series B Equity Raise Completed
Backed by SoftBank Vision Fund & Ken Griffin, funding will enable >1 GW new capacity. A massive expansion push in China & Southeast Asia, where demand for digital infra is accelerating.
AI Wave = Data Center Surge
GDS is well-positioned to benefit from the rise in AI workloads, which require low-latency, high-power density facilities. Their premium sites in top-tier Asian hubs make them a first-choice provider.
Strategic Advantages Noted by Analysts
Raymond James cites rare access to land & power near major Chinese metros — a barrier to entry that protects margins & boosts scalability.
📊 Trade Setup:
Bullish above $33–$34
Upside target: $50–$52
Arm Holdings (ARM): Bullish Outlook on Structural Growth ThemesArm Holdings NASDAQ:ARM is a semiconductor IP powerhouse driving innovation across AI, mobile, data centers, and IoT. With its high-performance, low-power chip architectures, Arm remains foundational to next-gen computing infrastructure.
🔍 Key Fundamentals:
Market Dominance: Arm holds a leading position in semiconductor IP, backed by deep R&D investment and expanding licensing with top global chipmakers.
Revenue Momentum: Recent earnings show strong revenue growth, underpinned by rising global demand for Arm-based designs.
AI & Cloud Pivot: Major cloud providers are rapidly adopting Arm-based server architectures, reflecting Arm’s shift into AI and enterprise computing.
IoT & Automotive Expansion: With increasing compute needs in vehicles and smart devices, Arm’s low-power design edge is unlocking new growth verticals.
📈 Technical Perspective:
We're bullish above the $120.00–$122.00 zone, with an upside target of $270.00–$275.00 based on structural demand growth and strategic diversification.
#ARM #ArmHoldings #Semiconductors #AIStocks #TechStocks #IoT #CloudComputing #ChipStocks #NVIDIA #DataCenter #BullishBreakout

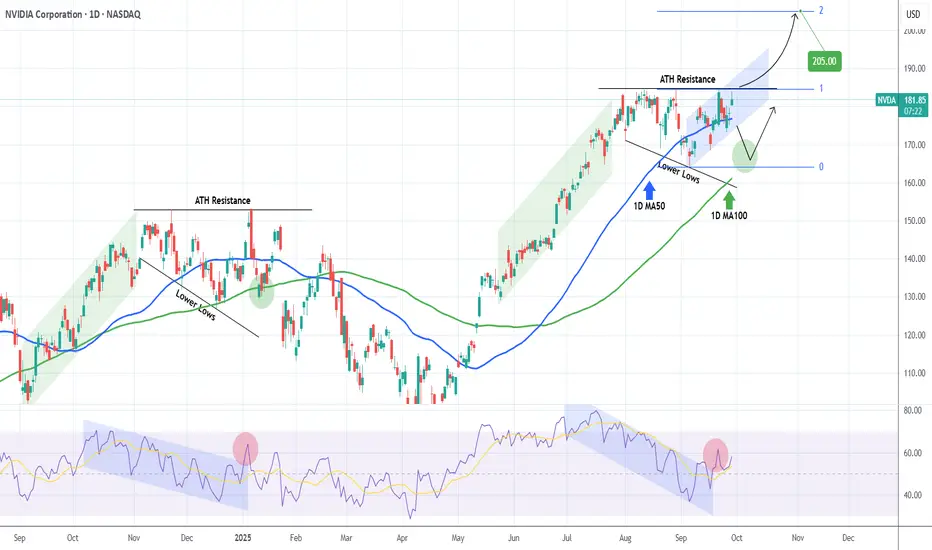
NVIDIA Will it finally make a new ATH?NVIDIA Corporation (NVDA) almost hit today its All Time High (ATH), which is currently its Resistance level. That is technically the top of a Descending Triangle pattern that the stock has been trading in since the start of August.
The last time we saw a similar pattern was during NVDA's previous ATH formation in November 2024 - January 2025. Identical price actions as well as 1D RSI sequences among the two fractals.
Based on that, we should be past a January 07 2025 ATH Resistance rejection, which targeted the 1D MA100 (green trend-line) before the next bounce. As a result, until the current ATH Resistance breaks, we should technically see a pull-back towards $166/67.
This time however, there is a strong case for a ATH break-out as the price is trading within a short-term (blue) Channel Up. As long as this holds, it can keep making Higher Highs, with the next one technically aiming above the ATH Resistance.
In any case, if that level breaks, we expect the price to target the 2.0 Fibonacci extension at just above $200.
-------------------------------------------------------------------------------
** Please LIKE 👍, FOLLOW ✅, SHARE 🙌 and COMMENT ✍ if you enjoy this idea! Also share your ideas and charts in the comments section below! This is best way to keep it relevant, support us, keep the content here free and allow the idea to reach as many people as possible. **
-------------------------------------------------------------------------------
💸💸💸💸💸💸
👇 👇 👇 👇 👇 👇
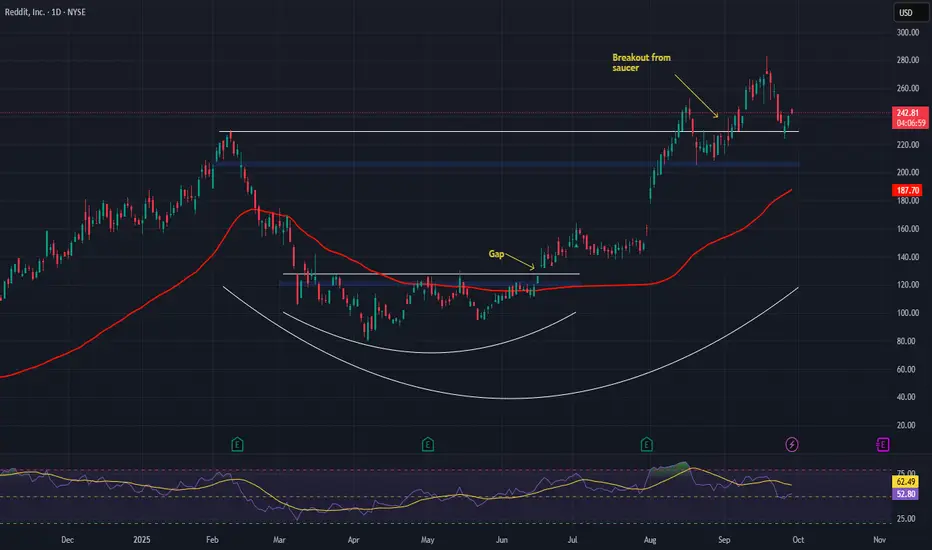
Reddit (RDDT) – Bullish Outlook Backed by Monetization StrengthReddit NYSE:RDDT stands out in the social media space with its community-first model and focus on authentic, user-driven engagement. As digital ad spend accelerates globally, Reddit is positioning itself at the intersection of social networking and data-driven monetization.
🔍 Key Drivers:
💡 AI-Powered Ads: Reddit’s ad platform uses AI to optimize placements, improving ROI for advertisers and strengthening pricing power.
💰 ARPU Beats Expectations: Global ARPU hit $4.53, highlighting strong monetization efficiency and reducing reliance on user growth.
📊 Scalability & Leverage: The AI engine supports operating leverage, setting the stage for robust earnings growth over time.
🚀 Price Momentum: Shares are up over 50% YTD, reflecting investor confidence and post-IPO execution strength.
📌 Technical Setup:
We remain bullish above the $205.00–$207.00 breakout zone. Sustained strength above this range could open the path toward a target zone of $380.00–$390.00.
#RDDT #Reddit #Stocks #StockMarket #TechStocks #AI #SocialMedia #DigitalAdvertising #GrowthStocks #Investing #Bullish #Breakout #EarningsGrowth #ARPU #IPO #AIstocks
Micron Technology - New all time highs!💰Micron Technology ( NASDAQ:MU ) is heading for new highs:
🔎Analysis summary:
More than a decade ago, Micron Technology entered into a significant long term rising channel pattern. Recently, we witnessed an expected rally of about +120%, perfectly rejecting support. But with the current all time high retest, we will also see a bullish breakout in the near future.
📝Levels to watch:
$140
SwingTraderPhil
SwingTrading.Simplified. | Investing.Simplified. | #LONGTERMVISION

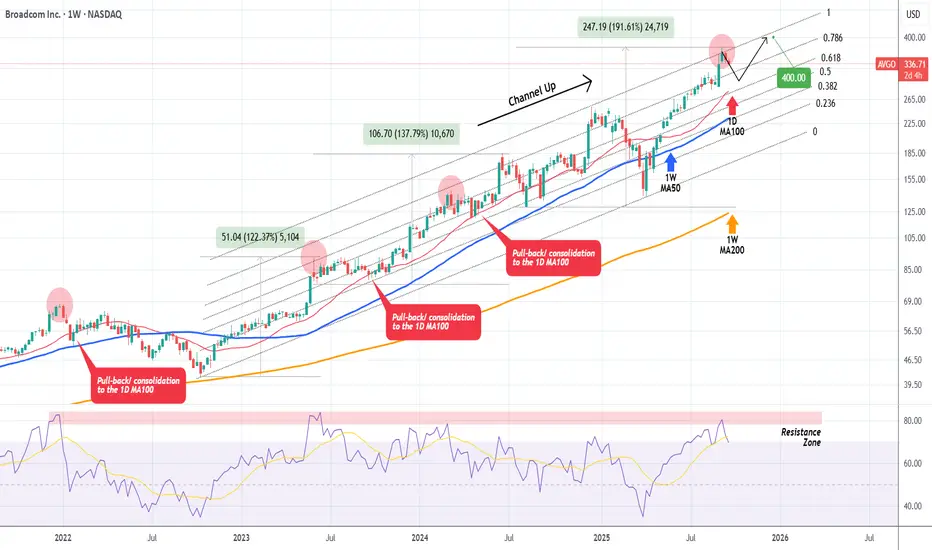
BROADCOM Rejection at the top of 3-year Channel Up possible. Last time we looked at Broadcom Inc. (AVGO) was more than 3 months ago (June 10, see chart below), where we gave a buy signal, targeting $320:
The price is now on the 2nd straight red week after it marginally breached above its 3-year Channel Up, and if it closes in red eventually, we will have a strong technical case for a rejection pull-back.
As you can see, every time the 1W RSI got that overbought and got rejected on its 4-year Resistance Zone, it always corrected back to its 1D MA100 (red trend-line).
Technically that should be the next medium-term buy entry point to finish the year with a $400 Target.
-------------------------------------------------------------------------------
** Please LIKE 👍, FOLLOW ✅, SHARE 🙌 and COMMENT ✍ if you enjoy this idea! Also share your ideas and charts in the comments section below! This is best way to keep it relevant, support us, keep the content here free and allow the idea to reach as many people as possible. **
-------------------------------------------------------------------------------
💸💸💸💸💸💸
👇 👇 👇 👇 👇 👇
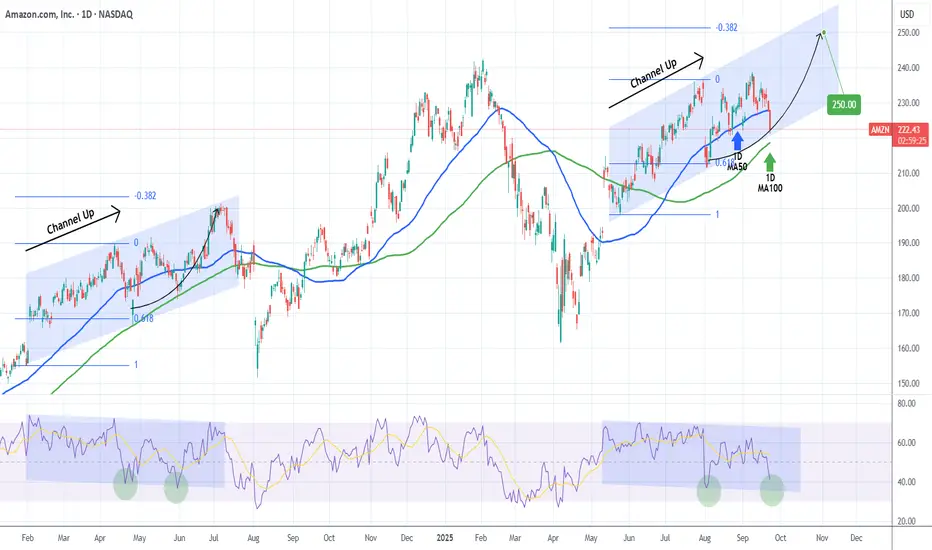
AMAZON Has it found a bottom?Amazon Inc. (AMZN) has been trading within a 4-month Channel Up and is currently pulling back on a Bearish Leg. The 1D MA100 (green trend-line) is just below and last time a similar Channel Up found support on it (May 31 2024), it rebounded for a -0.382 Fibonacci extension top.
As you can see, both patterns are identical, even making their first Higher Lows on their respective 0.618 Fib. Even their 1D RSI fractals are similar and right now we are headed of the 2nd Low (green circle).
As a result, we expect a bullish reversal there, targeting a little under $250 (Fib -0.382 ext).
-------------------------------------------------------------------------------
** Please LIKE 👍, FOLLOW ✅, SHARE 🙌 and COMMENT ✍ if you enjoy this idea! Also share your ideas and charts in the comments section below! This is best way to keep it relevant, support us, keep the content here free and allow the idea to reach as many people as possible. **
-------------------------------------------------------------------------------
💸💸💸💸💸💸
👇 👇 👇 👇 👇 👇
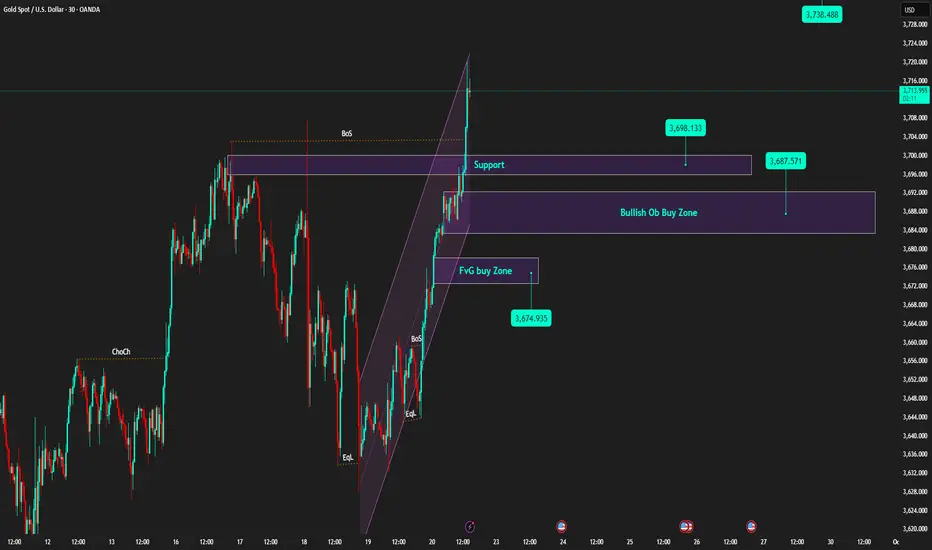
Weekly Candle High | Buy on Pullbacks to Support🟡 XAU/USD – 09/22 | Captain Vincent ⚓
🔎 Captain’s Log – Quick Overview
Last week, gold closed around 3,685, paving the way for further advances and the creation of a new ATH.
After the FED cut 25bps, Powell's 'brake' comments tempered the rise, but the overall trend remains bullish.
This morning, prices surged to 3,697.xx, currently adjusting slightly around 3,692 – 3,690 → a sensible strategy: wait for a pullback to continue Buying.
⏩ Captain’s Summary: The gold voyage still heads North, Buying remains the main choice, but wait for a pullback to board.
📈 Captain’s Chart – Technical Analysis
Golden Harbor (Support / Buy Zone):
Thin support: ~3,698 (recently broken old range peak).
OB Dock: 3,687 – 3,690.
FVG Dock: 3,672 – 3,676 (liquidity check on deep adjustments).
Storm Breaker (Resistance / Sell Zone):
3,714 – 3,720 (supply cluster / old ATH – likely to react).
Price Structure:
Continuous BoS series, price breaks out of short-term rising channel and creates higher highs → bullish remains the main trend.
🎯 Captain’s Map – Trading Plan (before US session)
✅ Buy (trend priority)
Buy Zone 1
Entry: 3,698 – 3,701
SL: 3,688
TP: 3,706 – 3,714 – 3,720+
Buy Zone 2 (OB)
Entry: 3,687 – 3,690
SL: 3,680
TP: 3,698 – 3,706 – 3,714 – 3,72x
Buy Zone 3 (FVG)
Entry: 3,672 – 3,676
SL: 3,664
TP: 3,687 – 3,706 – 3,714
⚡ Sell (only scalp when overbought)
Sell Zone (ATH test)
Entry: 3,740 – 3,738
SL: 3,750
TP: 3,730 – 3,720 – 3,695
Captain’s Note ⚓
“The new week opens with a high-closing candle, the gold ship continues its bullish course. Golden Harbor 🏝️ (3,690 – 3,672) is a safe anchorage for the crew to watch for Buys. Storm Breaker 🌊 (3,714 – 3,720) is a wave peak prone to gusts, suitable for Quick Boarding 🚤 short-term scalps. Before the US session, the sea might be choppy – hold the wheel tight and manage volume wisely.”
Domo, Inc. | Bullish Setup Amid Strong AI Momentum📊 Domo, Inc. NASDAQ:DOMO is a cloud-based data intelligence platform helping enterprises manage and visualize data at scale.
☁️ Recent strategic expansions with Snowflake and AWS are enhancing its data integration stack and building out a competitive ecosystem.
🏆 Ranked #1 in Dresner’s 2025 Agentic AI Report, validating Domo’s leadership in AI-powered analytics—key for long-term growth.
📈 Analysts are bullish: 4 Buy ratings, 0 Sell, with a consensus price target of $18.50 (~18.7% upside from current levels).
🔍 Technical View:
• Bullish Above: $14.00–$14.25
• Upside Target: $27.00–$28.00
• Trend: Reversal setup possible with continued institutional support.
This setup offers potential for mid-term upside, especially if bullish volume confirms above the $14.25 pivot zone.
💡 Watching for continuation as AI and data analytics tailwinds accelerate across the enterprise sector.
🔔 Like, follow, and comment if you're watching DOMO too.

Nasdaq-100 (NDX) Weekly Chart 2025 Chart Context
This weekly timeframe analysis of the Nasdaq-100 Index (NDX) forms a key pillar in our 2025 macro analysis series. Following the breakout structure seen in TOTAL, TOTAL2, BTC.D, and US10Y, this chart utilizes 2 Fibonacci tools (1 trend-based extensions and 1 retracement) to project potential corrective and expansion scenarios.
Fibonacci Tools Used:
Fibonacci Retracement : Applies to the recent smaller swing to determine micro retracement zones and cluster supports.
0=20674 and 100=10504
Trend-Based Fibonacci Extension: Drawn using a three-leg structure (point A= 3993 to B=16724 to C10504) to forecast upside targets beyond ATH.
All take-profit (TP) levels: TP1 (~23,400), TP2 (~26,700), and TP3 (~30,344.49)—are located at confluence zones where Fibonacci levels from different tools align, reinforcing their validity and strength.
There is a 4TP above all the Visible TPs
Key price references:
0% retracement: ~20,674.71
Next Resistance ~23,400 (confluence of extensions and psychological resistance)
Projected TPs:
1TP=~23,400,
2TP=~26,700,
3TP=~30,344.49,
4TP=44000
Support/Resistance:
Red zone: ~16,700–18,300 (historical S/R and correction target and Fib Confluences)
Resistance zone: ~23,000–23,400 ,
22000(ATH area)
Key Technical Observations:
Fibonacci Retracement from ~20674 to ~15732 marks the initial corrective range.
Trend-Based Extensions forecast:
TP1 (~23,400): First breakout resistance
TP2 (~26,700): Medium-term expansion zone
TP3 (~30,344): Long-term target if macro tailwinds persist
Scenario Pathways:
Bullish Continuation: Breaks above ATH to reach TP2/TP3
Healthy Correction: Pullback to ~20,600 or deeper ~18,300 before resumption
Deep Correction: Revisits ~16,700 zone if macro environment deteriorates
Fundamental Context:
Tech Stocks & Economic Sentiment: NDX is often the first to move during liquidity expansions. Its performance signals risk-on behavior across global equity markets.
Rate Cuts in 2025: With anticipated Fed rate cuts, tech stocks are primed for inflows. Forward earnings valuations rise, justifying extended upside in high-beta tech.
AI Boom & Earnings Growth: Nasdaq is heavily weighted toward AI, cloud, and semiconductors—sectors expected to lead earnings surprises.
NDX Influence on Gold and Crypto
When NDX rallies:
Crypto: Risk appetite improves. Capital rotation flows into altcoins and layer-1 assets.
Bitcoin: Often sees parallel inflows, especially during strong tech rallies (e.g., 2020).
TOTAL & TOTAL3: Begin breakout patterns if NDX continues to surge.
Gold: May stall or correct as investors favor risk assets. However, gold still holds due to macro hedging and real yield pressures.
When NDX corrects:
Crypto: Volatility spikes. Altcoins bleed faster.
Bitcoin: Short-term dip but may decouple if viewed as digital gold.
Gold: Benefits from flight-to-safety behavior.
US10Y: Often reacts inversely to NDX moves—used for confirmation.
Search Highlights (2024–2025):
Institutions view NDX correction as signal to rotate into commodities (incl. gold).
Cross-market correlations show NDX peaks often precede crypto mini-rallies.
De-risking from NDX often triggers gold strength, especially in geopolitical or inflationary backdrops.
Bias & Strategy Implication
Primary Bias: Bullish
Expecting upside continuation to 26,700–30,000 zone
Multiple correction opportunities are present even during rally
Strategic Actions:
Monitor for correction to yellow/red zones for accumulation
Use NDX behavior as leading macro signal for crypto rotations
Watch resistance at 23,400 closely; breakout confirms trend extension
Time Horizon
Short-Term (1–2 months): Watch for breakout or correction to ~20,600–18,300
Mid-Term (3–6 months): Probable test of ~26,700
Long-Term (6–12 months): Potential expansion to ~30,344.49

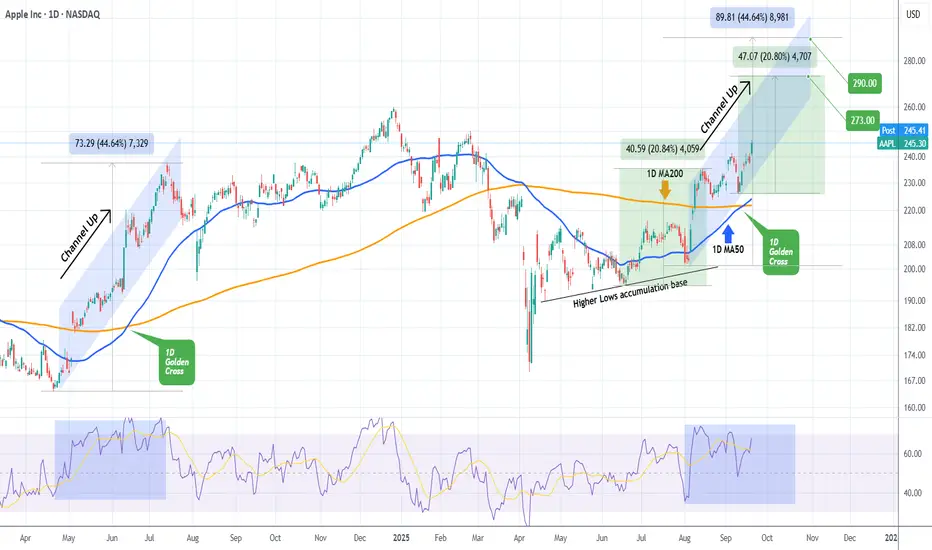
APPLE made first 1D Golden Cross in over a year!Apple Inc. (AAPL) completed this week its first 1D Golden Cross in over 1 year (since June 13 2024). The price has posted a strong 1D candle today on positive iPhone 17 fundamentals and it appears that the price is extending the very same Channel Up it had in May - July 2024.
If the current pattern ends the same way eventually as the 2024 fractal, expect a +44.64% rise with a $290.00 Target.
However the rally may stop a little lower at $273.00 if it follows the previous +20.80% Bullish Leg of the more recent June 18 - August 13 2025 run.
We will be more than satisfied with the less optimistic scenario nonetheless.
-------------------------------------------------------------------------------
** Please LIKE 👍, FOLLOW ✅, SHARE 🙌 and COMMENT ✍ if you enjoy this idea! Also share your ideas and charts in the comments section below! This is best way to keep it relevant, support us, keep the content here free and allow the idea to reach as many people as possible. **
-------------------------------------------------------------------------------
💸💸💸💸💸💸
👇 👇 👇 👇 👇 👇
Texas Instruments: Rebound Underway, But Downside Still in PlayTexas Instruments initially continued its decline but has recently shown early signs of a rebound. Nonetheless, we still see greater downside potential in magenta wave (3), and expect the broader bearish magenta impulse to ultimately extend into the beige zone between $130.04 and $107.75. Should a new (corrective) high occur in green wave alt. above $221.79, it could temporarily postpone the anticipated sell-off. However, even in this 30% likely scenario, price would likely reverse no later than at the higher resistance level at $240.67.

META Is this the final rally to $970??Meta Platforms (META) has been rising this month after successfully coming off August's Bull Flag. Technically this is an extension of the very aggressive rebound since the April 07 2025 Trade War bottom. It also took place right above the 1W MA100 (green trend-line).
This is quite similar to the Feb - March 2020 COVID crash, both corrections were -35.39% and -38.52% respectively. At the same time, they were both carried out by Bullish Megaphone patterns with similar 1W RSI sequences.
The Channel Up (green) that followed the COVID crash peaked on its 1.618 Fibonacci extension before turning sideways towards the 1W MA50 (blue trend-line) again.
As a result, given the remarkable symmetry between the two fractals so far, we can expect the current (post Trade War) Channel Up to peak near its 1.618 Fib ext at around $970.00.
-------------------------------------------------------------------------------
** Please LIKE 👍, FOLLOW ✅, SHARE 🙌 and COMMENT ✍ if you enjoy this idea! Also share your ideas and charts in the comments section below! This is best way to keep it relevant, support us, keep the content here free and allow the idea to reach as many people as possible. **
-------------------------------------------------------------------------------
💸💸💸💸💸💸
👇 👇 👇 👇 👇 👇

Hesai Group (HSAI) – LiDAR Leader Gearing Up for a Global RunHesai NASDAQ:HSAI is a dominant force in automotive LiDAR, holding a 33% global market share. With a strong portfolio of next-gen sensors, the company is pushing boundaries in autonomous driving, robotics, and industrial automation.
🔹 Catalyst: Upcoming Hong Kong IPO ($475M target) adds global visibility, improves liquidity, and diversifies funding amid U.S.–China tensions.
🔹 Tech Edge: Showcased ETX and FTX models at IAA Mobility 2025 – leading in range, resolution, and solid-state design for L3/L4 autonomy.
🔹 Growth Path: Backed by OEM & Tier-1 partnerships, expanding globally with durable revenue streams.
💡 Bullish above $24.50–$25.00
🎯 Target zone: $40.00–$42.00
📊 Watching volume and price action closely into the IPO news cycle.
🧠 Tech + geopolitical tailwinds + market leadership = strong breakout potential.
#HSAI #LiDAR #AutonomousDriving #IPO #TechStocks

IONQ — trend breakout and growth potentialIonQ shares have consolidated above the 47–50 zone and successfully broke the trendline, opening the way for further upside. The first target is set around 120, and if buying pressure continues, the price could extend toward 200. Key support levels are at 47–48 and 36, providing attractive accumulation zones.
From a fundamental perspective, the quantum computing sector is gaining momentum, and IonQ remains one of its leading players. Increasing demand for innovative technologies may support the continuation of the bullish trend in the medium term.
A stock you buy and forget — the longer you hold, the more you earn.

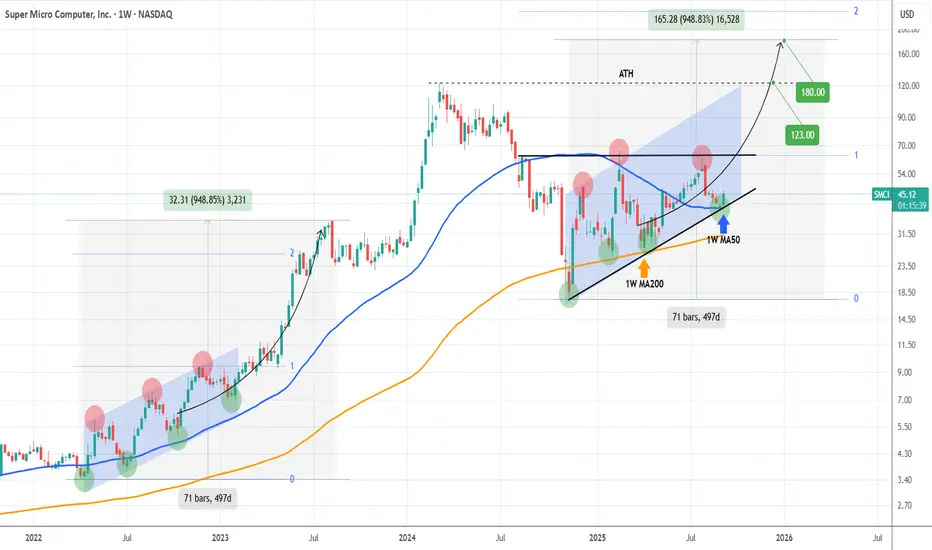
SMCI Rebounding on its 1W MA50 and targeting the ATH.Super Micro Computer Inc (SMCI) hit last week its 1W MA50 (blue trend-line) and this week posts a strong 1W candle. This rebound comes on the Higher Lows trend-line (bottom) of the 1-year Ascending Triangle.
It may not be exactly like the Channel Up of 2022 but it looks like a similar Accumulation pattern that preceded the massive 2023 rally. The Triangle typically breaks to the upside and technically targets the 2.0 Fibonacci extension. This time that would be even higher than the 2023 rise of +948.85%.
In any case that would be our over-extended Target ($180.00), with a more 'reasonable' one being the All Time High (ATH) of $123.00.
-------------------------------------------------------------------------------
** Please LIKE 👍, FOLLOW ✅, SHARE 🙌 and COMMENT ✍ if you enjoy this idea! Also share your ideas and charts in the comments section below! This is best way to keep it relevant, support us, keep the content here free and allow the idea to reach as many people as possible. **
-------------------------------------------------------------------------------
💸💸💸💸💸💸
👇 👇 👇 👇 👇 👇
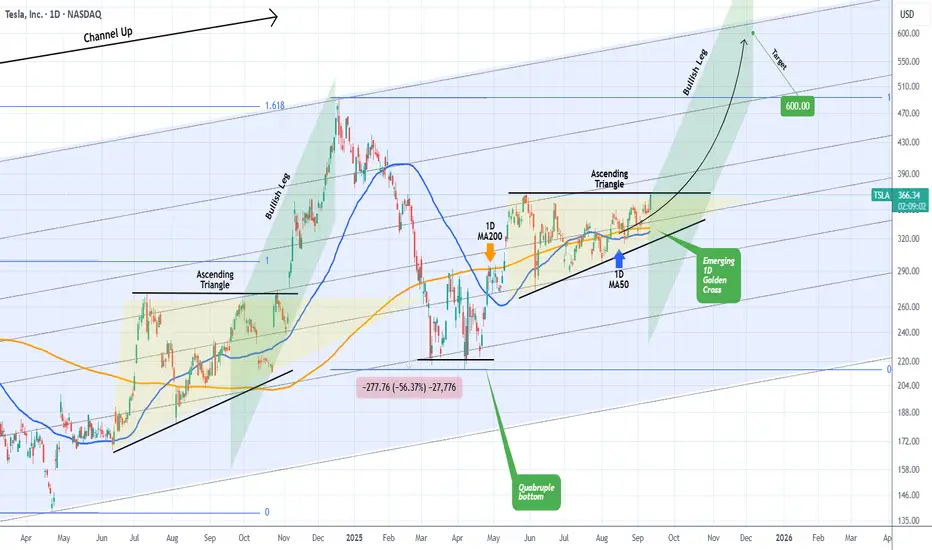
TESLA about to start a parabolic rally to $600.Exactly 3 months ago (June 06, see chart below) we called a bottom buy on Tesla (TSLA) right when it was trading at $284.70:
The price followed this prediction precisely, got out of the Bull Flag and eyes now a new 4-month High above $368.
This would be a break above the 4-month Ascending Triangle, a pattern we last saw during the stocks previous Bullish Leg in mid-end 2024. As you can see, that break-out delivered the Higher High test of Tesla's 3-year Channel Up at $488.
At the same time we are about to form a 1D Golden Cross, which makes the bullish sentiment even stronger.
As with our June 06, we still expect the price to reach $600 and price a new Higher High on the long-term Channel Up
-------------------------------------------------------------------------------
** Please LIKE 👍, FOLLOW ✅, SHARE 🙌 and COMMENT ✍ if you enjoy this idea! Also share your ideas and charts in the comments section below! This is best way to keep it relevant, support us, keep the content here free and allow the idea to reach as many people as possible. **
-------------------------------------------------------------------------------
💸💸💸💸💸💸
👇 👇 👇 👇 👇 👇
Can Specialized Depth Trump Market Breadth in Cybersecurity?NetScout Systems (NASDAQ: NTCT) has emerged as a compelling investment opportunity at the intersection of escalating global cyber threats and artificial intelligence innovation. With DDoS attacks surging to over 8 million globally in the first half of 2025—including record-breaking attacks reaching 7.3 terabits per second—NetScout's specialized position in network security has garnered analyst attention, including B. Riley's recent "Buy" rating with a $33 price target. The company's unique value proposition lies in its patented Adaptive Service Intelligence (ASI) and Deep Packet Inspection (DPI) technologies, which transform raw network traffic into actionable "smart data" without disrupting operations.
The company's financial performance reflects this strategic positioning, with Q1 FY26 revenue growing 7% year-over-year to $186.75 million, driven by a remarkable 19.3% growth in product revenue. NetScout's enterprise segment has been particularly robust, expanding 17.7% annually and comprising 59% of total revenue, while serving high-value clients across government, healthcare, financial services, and telecommunications sectors. The company's gross profit margins of nearly 79% and strong balance sheet with more cash than debt underscore its operational efficiency and financial stability.
NetScout's competitive advantage stems from its focused specialization rather than broad market dominance. While holding only 2.82% of the Application Performance Monitoring market, the company has been recognized as a "Technology Leader" and "Ace Performer" in DDoS mitigation—a critical niche where depth matters more than breadth. The integration of AI and machine learning into its Arbor DDoS protection suite, combined with the ATLAS Intelligence Feed providing global threat visibility, positions NetScout as a force multiplier for understaffed security teams facing increasingly sophisticated attacks.
The strategic outlook appears promising, with the global DDoS protection market projected to grow from $4.34 billion in 2025 to $13.90 billion by 2034 at a 13.81% CAGR. NetScout's 46% international revenue exposure aligns well with rapid cybersecurity growth in Asia-Pacific, where the market is expected to exceed $146 billion by 2030. Despite facing competitive pressure in some segments, the company's focus on AI-enhanced hybrid solutions for large enterprises, coupled with its patent-protected intellectual property, creates a defensible position in an increasingly complex and high-stakes cybersecurity landscape.

Vimeo | VMEO | Long at $3.87Vimeo NASDAQ:VMEO provides a cloud-based platform for video creation, hosting, and sharing - primarily serving businesses, creators, and enterprises for professional video content management. While NASDAQ:VMEO has a **lot** of competition, it is a rather "healthy" company:
Debt-free (a rarity out there...)
Maintained profitability over the last twelve months, with a healthy gross profit margin of 78%
Earnings are forecast to grow 34.76% per year
[*}Revenue growth rate through 2027 is projected at 5.36% (modest)
Adjusted EBITDA guidance raised to $35 million, up from $25-30 million
Upcoming product developments, including AI-powered features and new SKUs, are expected to drive further growth
Insider bought over $868,000 in shares in the last year at an average price of $5.04
Subscriber growth is a concern...
From a technical analysis perspective, the stock price is currently near the bottom of my historical simple moving average bands. This region is typically an area of consolidation. The two open price gaps below the current price on the daily chart (down to $3.38) will likely get closed in the near-term before a move up. I do believe this is a risky investment, though, given the competition and economic headwinds. I would not be surprised if the market flipped and took this down near or below $1... But, if one is going purely by what the company reports concerning fundamentals and general growth, this is an undervalued stock in the $3 range.
Thus, if the insider/company hype is true, NASDAQ:VMEO is in a personal buy zone at $3.87 - with near-term risk of the stock dropping to close the price gaps on the daily chart down to $3.38... or below.
Targets into 2028:
$5.00 (+29.2%)
$6.40 (+65.4%)

NVIDIA Has it bottomed??NVIDIA Corporation (NVDA) broke last week below its 1D MA50 (blue trend-line) for the first time in 4 months (since May 06). That was perceived as the bullish trend's strongest Support and rightfully so technically.
The next level to watch as a Support is the 1D MA100 (green trend-line), which was the level that held and led the stock to its previous peak during the last strong bullish trend of October 31 2023 to June 20 2024.
As you can see, there was a situation similar to today's where the price again broke below the 1D MA50 during the uptrend but kept the 1D MA100 intact and rebounded. Still, it managed to touch the 0.236 Fibonacci retracement level.
As a result, there might be potential for one more weekly Leg down to $155.00 (Fib 0.236) before recovering but this would also most likely mean breaking below the 1D MA100. This is doubtful but not impossible but still there are higher probabilities of a rebound sooner.
A strong indicator that is in Support of this is the 1D RSI, which just touched its 2-year Support Zone, a level that has always been a 'Buy' whether short or long-term. As far as a Target is concerned, the 2024 Channel Up peaked on the -0.382 Fibonacci extension, which is at $245.00.
-------------------------------------------------------------------------------
** Please LIKE 👍, FOLLOW ✅, SHARE 🙌 and COMMENT ✍ if you enjoy this idea! Also share your ideas and charts in the comments section below! This is best way to keep it relevant, support us, keep the content here free and allow the idea to reach as many people as possible. **
-------------------------------------------------------------------------------
💸💸💸💸💸💸
👇 👇 👇 👇 👇 👇

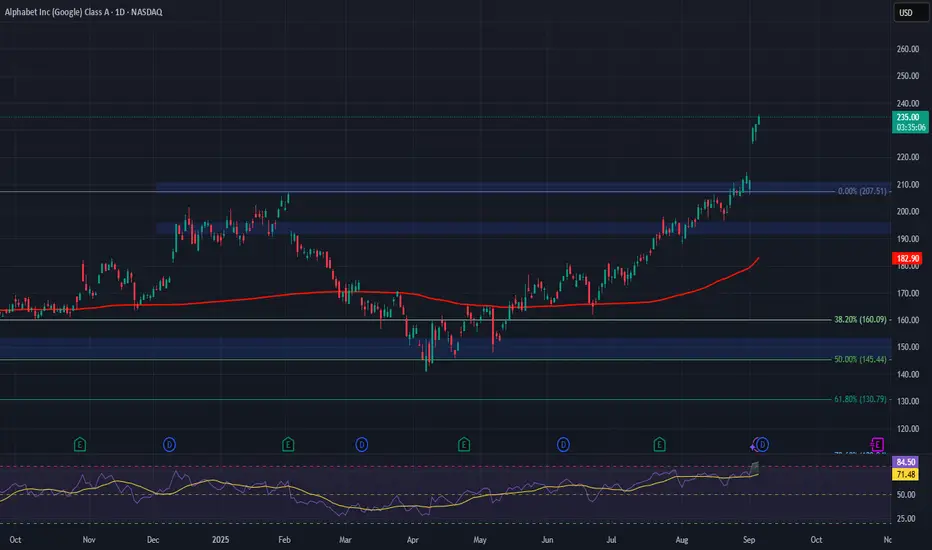
GOOGL Breaks Out to ATH on Chrome Win — $250 Target in SightAlphabet Inc. NASDAQ:GOOGL has broken into new all-time highs after bullish news that it won’t be forced to sell Chrome. This development removes regulatory overhang and boosts investor confidence.
The stock has surged 55% since our previous analysis. With strong fundamentals, ongoing AI integration, and now a clean regulatory slate, GOOGL shows continued strength.
📊 Technical Setup:
Price has reclaimed the previous ATH and turned it into support. This creates a strong base for a continuation move higher.
💼 Macro & Fundamental Tailwinds:
AI expansion, strong cloud performance, and consistent ad revenue growth make Alphabet a long-term leader in the tech space.
🔹 Bullish Above: $196.00–$211.00
🔹 Upside Target: $240.00–$250.00
⏳ Invalid Below: $196 breakdown with volume
#GOOGL #Alphabet #TechStocks #StockMarket #NASDAQ #Equities #AIGrowth #ChromeNews #EarningsGrowth #BigTech #MarketNews #Investing #Finance #Bullish #StockWatch #TradeSetup #FAANG #TradingIdeas