EURUSD Set To Grow! BUY!
My dear friends,
EURUSD looks like it will make a good move, and here are the details:
The market is trading on 1.1637 pivot level.
Bias - Bullish
Technical Indicators: Supper Trend generates a clear long signal while Pivot Point HL is currently determining the overall Bullish trend of the market.
Goal - 1.1674
About Used Indicators:
Pivot points are a great way to identify areas of support and resistance, but they work best when combined with other kinds of technical analysis
Disclosure: I am part of Trade Nation's Influencer program and receive a monthly fee for using their TradingView charts in my analysis.
———————————
WISH YOU ALL LUCK
Tecnicalanalysis

NZDJPY On The Rise! BUY!
My dear followers,
This is my opinion on the NZDJPY next move:
The asset is approaching an important pivot point 86.786
Bias - Bullish
Safe Stop Loss - 86.701
Technical Indicators: Supper Trend generates a clear long signal while Pivot Point HL is currently determining the overall Bullish trend of the market.
Goal - 86.936
About Used Indicators:
For more efficient signals, super-trend is used in combination with other indicators like Pivot Points.
Disclosure: I am part of Trade Nation's Influencer program and receive a monthly fee for using their TradingView charts in my analysis.
———————————
WISH YOU ALL LUCK

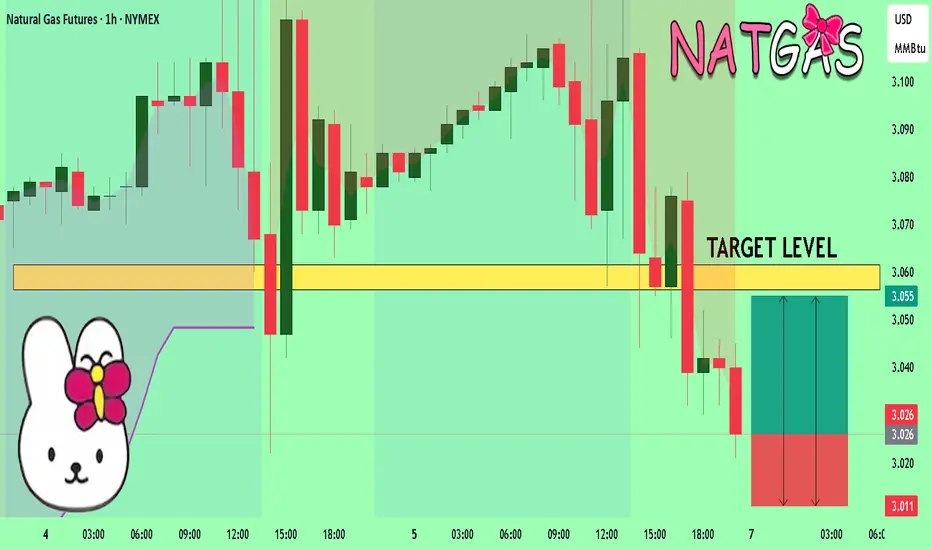
NATGAS Sellers In Panic! BUY!
My dear subscribers,
My technical analysis for NATGAS is below:
The price is coiling around a solid key level - 3.026
Bias - Bullish
Technical Indicators: Pivot Points Low anticipates a potential price reversal.
Super trend shows a clear buy, giving a perfect indicators' convergence.
Goal - 3.056
My Stop Loss - 3.011
About Used Indicators:
By the very nature of the supertrend indicator, it offers firm support and resistance levels for traders to enter and exit trades. Additionally, it also provides signals for setting stop losses
Disclosure: I am part of Trade Nation's Influencer program and receive a monthly fee for using their TradingView charts in my analysis.
———————————
WISH YOU ALL LUCK
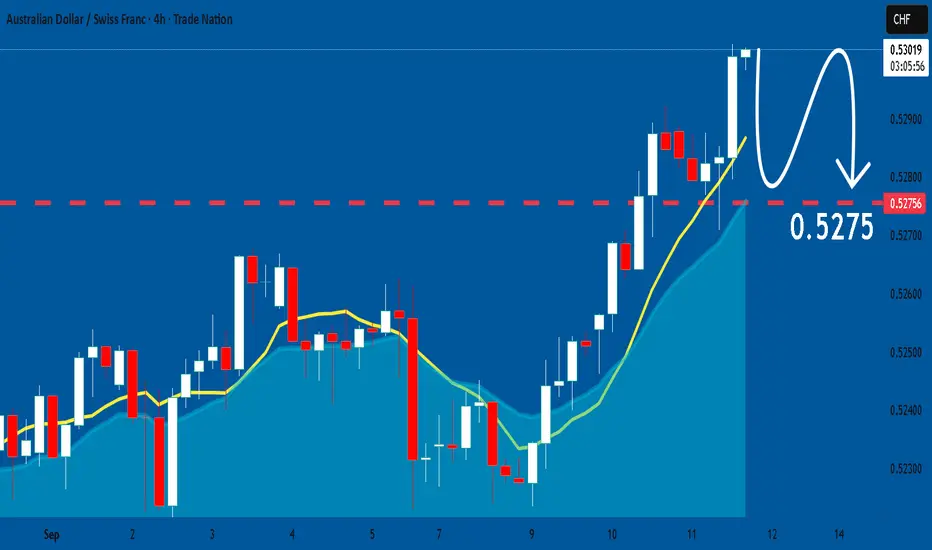
AUDCHF: Bearish Continuation is Expected! Here is Why:
It is essential that we apply multitimeframe technical analysis and there is no better example of why that is the case than the current AUDCHF chart which, if analyzed properly, clearly points in the downward direction.
Disclosure: I am part of Trade Nation's Influencer program and receive a monthly fee for using their TradingView charts in my analysis.
❤️ Please, support our work with like & comment! ❤️
USDCHF: Long Trading Opportunity
USDCHF
- Classic bullish pattern
- Our team expects retracement
SUGGESTED TRADE:
Swing Trade
Buy USDCHF
Entry - 0.7963
Stop -0.7955
Take - 0.7977
Our Risk - 1%
Start protection of your profits from lower levels
Disclosure: I am part of Trade Nation's Influencer program and receive a monthly fee for using their TradingView charts in my analysis.
❤️ Please, support our work with like & comment! ❤️

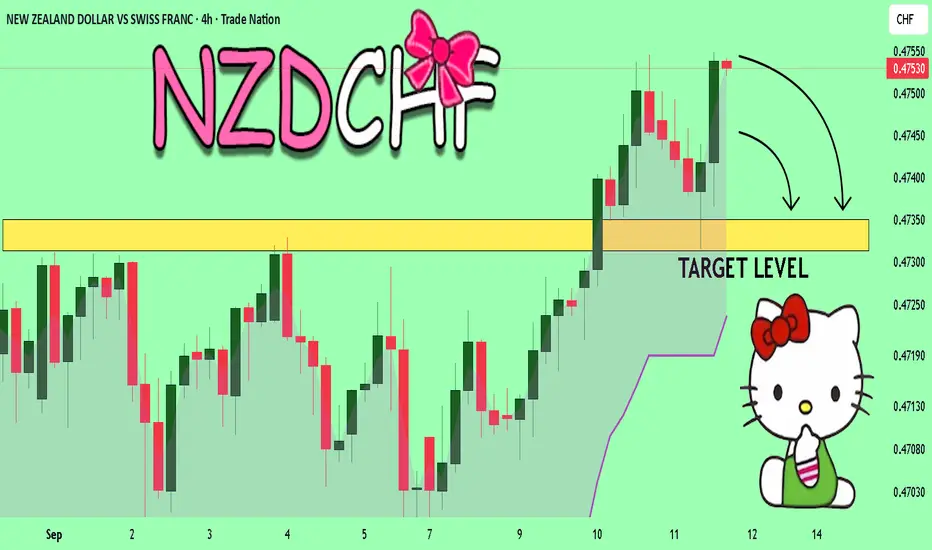
NZDCHF Technical Analysis! SELL!
My dear friends,
Please, find my technical outlook for NZDCHF below:
The price is coiling around a solid key level - 0.4352
Bias - Bearish
Technical Indicators: Pivot Points High anticipates a potential price reversal.
Super trend shows a clear sell, giving a perfect indicators' convergence.
Goal - 0.4735
About Used Indicators:
The pivot point itself is simply the average of the high, low and closing prices from the previous trading day.
Disclosure: I am part of Trade Nation's Influencer program and receive a monthly fee for using their TradingView charts in my analysis.
———————————
WISH YOU ALL LUCK
GBPUSD A Fall Expected! SELL!
My dear subscribers,
My technical analysis for GBPUSD is below:
The price is coiling around a solid key level - 1.3577
Bias - Bearish
Technical Indicators: Pivot Points Low anticipates a potential price reversal.
Super trend shows a clear sell, giving a perfect indicators' convergence.
Goal - 1.3550
My Stop Loss - 1.3590
About Used Indicators:
By the very nature of the supertrend indicator, it offers firm support and resistance levels for traders to enter and exit trades. Additionally, it also provides signals for setting stop losses
Disclosure: I am part of Trade Nation's Influencer program and receive a monthly fee for using their TradingView charts in my analysis.
———————————
WISH YOU ALL LUCK

AUDNZD: Bears Will Push Lower
The analysis of the AUDNZD chart clearly shows us that the pair is finally about to tank due to the rising pressure from the sellers.
Disclosure: I am part of Trade Nation's Influencer program and receive a monthly fee for using their TradingView charts in my analysis.
❤️ Please, support our work with like & comment! ❤️

EURUSD: Short Trade Explained
EURUSD
- Classic bearish formation
- Our team expects pullback
SUGGESTED TRADE:
Swing Trade
Short EURUSD
Entry - 1.1723
Sl - 1.1732
Tp - 1.1707
Our Risk - 1%
Start protection of your profits from lower levels
Disclosure: I am part of Trade Nation's Influencer program and receive a monthly fee for using their TradingView charts in my analysis.
❤️ Please, support our work with like & comment! ❤️

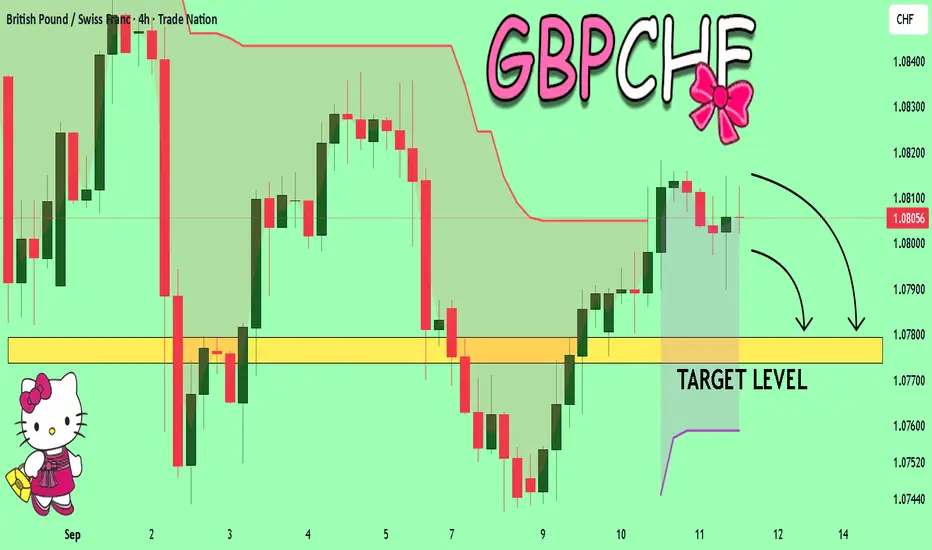
GBPCHF Set To Fall! SELL!
My dear friends,
My technical analysis for GBPCHF is below:
The market is trading on 1.0803 pivot level.
Bias - Bearish
Technical Indicators: Both Super Trend & Pivot HL indicate a highly probable Bearish continuation.
Target - 1.0779
About Used Indicators:
A pivot point is a technical analysis indicator, or calculations, used to determine the overall trend of the market over different time frames.
Disclosure: I am part of Trade Nation's Influencer program and receive a monthly fee for using their TradingView charts in my analysis.
———————————
WISH YOU ALL LUCK
GOLD Trading Opportunity! SELL!
My dear followers,
I analysed this chart on GOLD and concluded the following:
The market is trading on 3635.2 pivot level.
Bias - Bearish
Technical Indicators: Both Super Trend & Pivot HL indicate a highly probable Bearish continuation.
Target - 3624.7
Safe Stop Loss - 3641.7
About Used Indicators:
A super-trend indicator is plotted on either above or below the closing price to signal a buy or sell. The indicator changes color, based on whether or not you should be buying. If the super-trend indicator moves below the closing price, the indicator turns green, and it signals an entry point or points to buy.
Disclosure: I am part of Trade Nation's Influencer program and receive a monthly fee for using their TradingView charts in my analysis.
———————————
WISH YOU ALL LUCK

Bitcoin – Trend Update Ahead of PPIBitcoin – Trend Update Ahead of PPI
Hello Traders,
The current picture for Bitcoin is unfolding broadly in line with expectations, with the uptrend continuing to build momentum. Price movements are backed by solid volume, and the overall structure is developing as anticipated.
Key Levels
The price has cleared the 113k area, confirming that the bullish trend remains intact. This strengthens the probability of completing the final leg of the inverse head-and-shoulders pattern.
The next area to monitor is around 116k, where a modest reaction or short-term pullback could occur before the trend resumes towards the 121k region.
Close attention should be paid to the 117k level, as this represents the potential completion of the inverse head-and-shoulders structure. At this point, price may consolidate before establishing a fresh primary trend.
Trading View
For the moment, it remains important to follow the prevailing uptrend. Any shift in market structure will call for re-assessment, with updated strategies to be applied only once clear confirmation emerges.
This is my latest outlook on Bitcoin ahead of the PPI release. I trust this perspective will assist in shaping your trading approach.

XAUUSD – Latest Trend UpdateXAUUSD – Latest Trend Update
Good day Traders,
Gold has so far unfolded in line with yesterday’s projection: following a corrective pullback towards 3660, price has resumed its decline and is currently maintaining a bearish tone. Should this structure be confirmed on the higher timeframes such as H1 and H4, it may indicate that a broader corrective phase on the daily chart (D1) is underway.
Key Levels of Interest
3620: Established as an important support yesterday, this level is now regarded as the key marker for confirming continued downside momentum.
3630: Coincides with the lower boundary of the ascending channel, where a reaction could still develop before direction becomes clearer.
Medium-Term Outlook
A decline towards 3550 is anticipated, from which a rebound could follow – this represents the preferred medium-term scenario.
A deeper retracement to 3510 is also possible, where liquidity from previous candle wicks may be absorbed before the longer-term uptrend resumes on the daily timeframe.
This expectation of a corrective move is supported by the fact that price has already reached the Fibonacci Extension 2.618, often a sign of exhaustion in the prior leg.
Trading Approach
Monitor the 3630 – 3620 – 3610 zones for potential long opportunities in line with the broader bullish structure.
Short positions should only be considered if price delivers a decisive close beneath 3620, thereby confirming renewed downside pressure.
This is my current outlook for gold today. Please use it as a guide alongside your own analysis and risk management.

3,417 – 3,360 (final defense for buyers).1. Price Structure
Gold has surged strongly from 3,360 → 3,657, forming a steep uptrend inside a rising wedge channel.
Currently, price is near the upper boundary of the wedge and has just made a pullback.
2. Pattern & Technical Signals
A rising wedge pattern is visible, which often signals downside pressure when price touches the upper boundary.
The recent candlestick shows a long upper wick, indicating strong selling pressure around the 3,657 top.
The blue arrow on the chart highlights a potential correction back toward the wedge’s lower trendline.
3. Fibonacci Support Levels
From the rally 3,360 → 3,657:
Fib 0.786 = 3,573: short-term support, likely to be tested.
Fib 0.618 = 3,508: key medium-term support.
Fib 0.382 = 3,417: if this breaks, the short-term uptrend could reverse.
Red zone (3,360 – 3,417): a strong demand zone, may attract buying interest again.
4. Possible Scenarios
Scenario 1 (primary):
Price continues to correct down toward 3,573 – 3,508, then rebounds if the trendline holds.
Suitable for trend-following buys if reversal signals appear around the 0.618 Fib.
Scenario 2 (breakdown of wedge):
If price breaks below the wedge and Fib 0.5/0.382, it could drop back to 3,360 – 3,417.
In that case, the short-term bullish trend weakens → short opportunities may open up.
5. Conclusion
Gold is currently in a correction phase after a strong rally.
Key levels to watch:
3,573 – 3,508 (decisive for holding or losing the uptrend).
3,417 – 3,360 (final defense for buyers).
👉 Short-term: wait for price action signals around 0.786 – 0.618 Fib zone to consider buying with the trend.
👉 Medium-term: if 3,417 breaks, bearish momentum could return.

GBPAUD: Growth & Bullish Continuation
The analysis of the GBPAUD chart clearly shows us that the pair is finally about to go up due to the rising pressure from the buyers.
Disclosure: I am part of Trade Nation's Influencer program and receive a monthly fee for using their TradingView charts in my analysis.
❤️ Please, support our work with like & comment! ❤️

NZDCAD: Trading Signal From Our Team
NZDCAD
- Classic bearish pattern
- Our team expects retracement
SUGGESTED TRADE:
Swing Trade
Sell NZDCAD
Entry - 0.8230
Stop - 0.8238
Take - 0.8216
Our Risk - 1%
Start protection of your profits from lower levels
Disclosure: I am part of Trade Nation's Influencer program and receive a monthly fee for using their TradingView charts in my analysis.
❤️ Please, support our work with like & comment! ❤️

EURNZD Expected Growth! BUY!
My dear subscribers,
EURNZD looks like it will make a good move, and here are the details:
The market is trading on 1.9695 pivot level.
Bias - Bullish
Technical Indicators: Both Super Trend & Pivot HL indicate a highly probable (Bullish continuation.
Target - 1.9782
About Used Indicators:
The average true range (ATR) plays an important role in 'Supertrend' as the indicator uses ATR to calculate its value. The ATR indicator signals the degree of price volatility.
Disclosure: I am part of Trade Nation's Influencer program and receive a monthly fee for using their TradingView charts in my analysis.
———————————
WISH YOU ALL LUCK

EURUSD On The Rise! BUY!
My dear friends,
EURUSD looks like it will make a good move, and here are the details:
The market is trading on 1.1704 pivot level
Bias - Bullish
Technical Indicators: Supper Trend generates a clear long signal while Pivot Point HL is currently determining the overall Bullish trend of the market.
Goal - 1.1730
Recommended Stop Loss - 1.1690
About Used Indicators:
Pivot points are a great way to identify areas of support and resistance, but they work best when combined with other kinds of technical analysis
Disclosure: I am part of Trade Nation's Influencer program and receive a monthly fee for using their TradingView charts in my analysis.
———————————
WISH YOU ALL LUCK

AUDCHF: Bearish Forecast & Bearish Scenario
Remember that we can not, and should not impose our will on the market but rather listen to its whims and make profit by following it. And thus shall be done today on the AUDCHF pair which is likely to be pushed down by the bears so we will sell!
Disclosure: I am part of Trade Nation's Influencer program and receive a monthly fee for using their TradingView charts in my analysis.
❤️ Please, support our work with like & comment! ❤️

GOLD: Bearish Continuation & Short Trade
GOLD
- Classic bearish setup
- Our team expects bearish continuation
SUGGESTED TRADE:
Swing Trade
Short GOLD
Entry Point - 3644.0
Stop Loss - 3652.1
Take Profit - 3630.1
Our Risk - 1%
Start protection of your profits from lower levels
Disclosure: I am part of Trade Nation's Influencer program and receive a monthly fee for using their TradingView charts in my analysis.
❤️ Please, support our work with like & comment! ❤️

EURGBP The Target Is UP! BUY!
My dear followers,
This is my opinion on the EURGBP next move:
The asset is approaching an important pivot point 0.8649
Bias - Bullish
Technical Indicators: Supper Trend generates a clear long signal while Pivot Point HL is currently determining the overall Bullish trend of the market.
Goal - 0.8666
About Used Indicators:
For more efficient signals, super-trend is used in combination with other indicators like Pivot Points.
Disclosure: I am part of Trade Nation's Influencer program and receive a monthly fee for using their TradingView charts in my analysis.
———————————
WISH YOU ALL LUCK

GBPJPY What Next? SELL!
My dear subscribers,
This is my opinion on the GBPJPY next move:
The instrument tests an important psychological level 199.56
Bias - Bearish
Technical Indicators: Supper Trend gives a precise Bearish signal, while Pivot Point HL predicts price changes and potential reversals in the market.
Target - 199.28
My Stop Loss - 199.71
About Used Indicators:
On the subsequent day, trading above the pivot point is thought to indicate ongoing bullish sentiment, while trading below the pivot point indicates bearish sentiment.
Disclosure: I am part of Trade Nation's Influencer program and receive a monthly fee for using their TradingView charts in my analysis.
———————————
WISH YOU ALL LUCK

Bitcoin – Current Trend UpdateBitcoin – Current Trend Update
Good day Traders,
Bitcoin continues to respect the structure of an inverse head-and-shoulders formation, which remains intact at this stage. Following a test of the 113.5k region, price once again reacted lower – this marks the third rejection from this level, highlighting its importance as a pivotal zone. For the bullish momentum to extend and complete the final wave of the formation, this resistance must eventually be overcome.
Scenarios to Monitor
Bullish Scenario: The upward bias remains valid while price holds above 109k. In this context, long positions remain the preferred approach.
Bearish Scenario: Should price sustain a break beneath 109k, the bullish case would be invalidated and a bearish outlook activated. Confirmation will be required before considering such positions.
Short-Term Dynamics
On the intraday timeframes, BTC is trading within a sideways channel. For short-term participants, range-based strategies such as buying near support and selling into resistance may remain effective until a decisive breakout occurs.
Market Context
At present, broader market attention is focused more heavily on gold rather than Bitcoin. As a result, BTC may continue to consolidate within a narrower range, requiring traders to temper expectations for immediate volatility.
This represents my current outlook for Bitcoin. Traders are encouraged to use this as a reference and compare it with their own perspectives.
