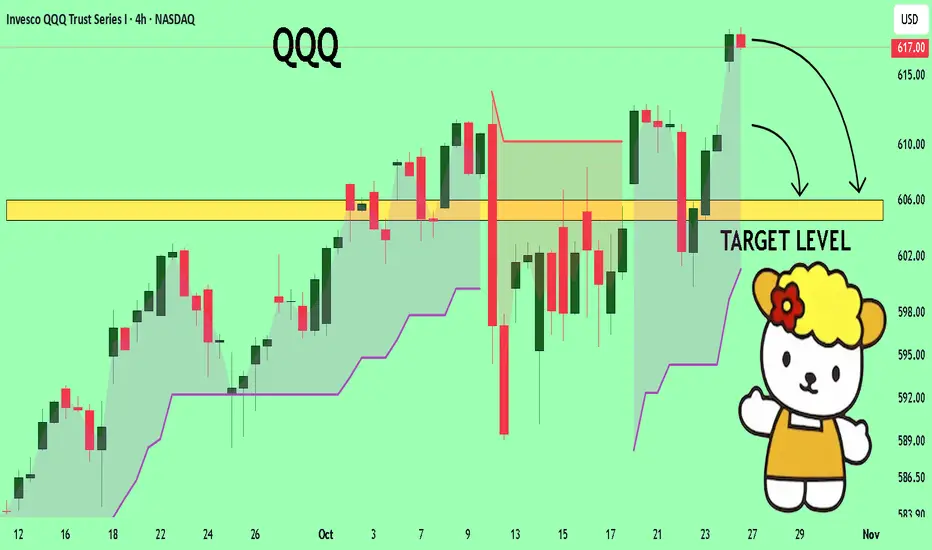
QQQ Will Collapse! SELL!
My dear followers,
I analysed this chart on QQQ and concluded the following:
The market is trading on 617.00 pivot level.
Bias - Bearish
Technical Indicators: Both Super Trend & Pivot HL indicate a highly probable Bearish continuation.
Target - 605.94
About Used Indicators:
A super-trend indicator is plotted on either above or below the closing price to signal a buy or sell. The indicator changes color, based on whether or not you should be buying. If the super-trend indicator moves below the closing price, the indicator turns green, and it signals an entry point or points to buy.
Disclosure: I am part of Trade Nation's Influencer program and receive a monthly fee for using their TradingView charts in my analysis.
———————————
WISH YOU ALL LUCK
Tecnicalanalysis
technical analysis for Gold (XAU/USD) based on your provided chaPrice: Around $4,112.53
Timeframe: 30-minute
Trend Structure: Gold is trading within a rising channel, suggesting short-term bullish momentum after rebounding from a support level.
🧭 Key Technical Zones
Support Level: $4,060 – $4,080
→ This zone has held price multiple times and aligns with the channel’s lower boundary.
Immediate Resistance: $4,125
→ Minor horizontal resistance, currently being retested.
Mid-term Resistance: $4,175 – $4,200
→ The upper boundary of the short-term consolidation range.
Main Target Zone: $4,381
→ Marked as the projected bullish target; aligns with the top of the ascending channel.
📊 Pattern & Projections
The chart shows a bullish continuation setup (possibly a flag or channel breakout in progress).
Price recently bounced from support and is respecting the ascending trendline, hinting at a possible push toward higher resistance levels.
A break above $4,125 could trigger momentum toward $4,175, then $4,225, and finally the target at $4,381.
⚠️ Risk Management
Invalidation: A close below $4,075 (support zone) would invalidate the bullish scenario and could push price back toward $4,025 – $4,000.
Stop-Loss (for buyers): Below $4,070.
Take-Profit Levels:
1️⃣ $4,175
2️⃣ $4,225
3️⃣ $4,381
🟢 Summary Signal
Bias: Bullish
Entry Zone: Around $4,100 – $4,115 (after confirmation of support hold)
Target: $4,381
Stop-Loss: $4,070 NASDAQ:TSLA NASDAQ:AAPL CME_MINI:NQ1! CME_MINI:ES1! COMEX:GC1! CBOT_MINI:YM1! COMEX_MINI:MGC1! NYMEX:CL1! COMEX:SI1! CME_MINI:RTY1! CBOT_MINI:MYM1!

technical analysis for your ETH/USD chart:Pair: Ethereum / U.S. Dollar (ETH/USD)
Current Price: around $3,931
Structure: Rising channel pattern
Key Zones:
Support Level: $3,850 – $3,880
Target Level: $4,120.70
📊 Technical Analysis
Trend Structure:
ETH/USD is currently trading within an ascending channel, reflecting a short-term bullish structure.
Price is consolidating just above the midline of the channel, suggesting a potential retracement before the next bullish leg.
Support Area Reaction:
The support level near $3,850 – $3,880 aligns with the lower channel boundary.
A possible pullback into this zone could act as a liquidity grab before a bullish continuation.
Bullish Scenario (Primary Expectation):
If price retests and holds above the support level, expect a rebound toward $4,120.
Confirmation: Bullish candlestick pattern or breakout above the local resistance around $3,970.
Bearish Scenario (Alternative):
A confirmed break below $3,850 could invalidate the bullish setup.
In that case, ETH could extend lower toward $3,780 – $3,750 support area.
⚙️ Trading Plan (Summary)
Direction Entry Zone Stop-Loss Target
🔺 Long (Buy) 3,850 – 3,880 Below 3,820 4,120
🔻 Short (Sell – only if breakdown) Below 3,850 Above 3,900 3,750
🧩 Technical Indicators (Implied)
Trend: Bullish structure intact within ascending channel.
Momentum: Neutral–bullish (possible short-term retracement).
Market Sentiment: Buyers maintaining control unless $3,850 breaks. NASDAQ:TSLA NASDAQ:NVDA NASDAQ:AMD NASDAQ:PLTR NASDAQ:META NASDAQ:MSFT NASDAQ:NFLX NASDAQ:INTC NASDAQ:BYND NASDAQ:MSTR

technical analysis for your BTC/USD chart:Pair: Bitcoin / U.S. Dollar (BTC/USD)
Current Price: around $111,628
Structure: Ascending channel pattern
Key Zones:
Resistance Level: $112,000 – $112,500
Target Level (Support): $106,572
📊 Technical Analysis
Trend Structure:
BTC/USD is moving within a rising channel, showing short-term bullish momentum.
Price is now approaching the upper boundary of the channel and a major resistance zone ($112,000–$112,500).
Resistance Reaction Expected:
This zone has previously rejected price, so sellers may re-enter around this region.
If price fails to break above the resistance, a bearish correction is likely.
Bearish Scenario (Primary Expectation):
A potential reversal from resistance is indicated on your chart.
Confirmation: A strong bearish candle or break below the midline of the channel.
Downside target: around $106,572, aligning with previous demand/support and the lower boundary of the broader channel.
Bullish Scenario (Alternative):
If BTC/USD breaks above $112,500 with volume, price could extend toward $113,500–$114,000 before any correction.
⚙️ Trading Plan (Summary)
Direction Entry Zone Stop-Loss Target
🔻 Short (Sell) 112,000 – 112,500 Above 113,000 106,600
🔺 Long (Breakout) Above 112,500 (confirmed) Below 111,800 113,500 – 114,000
🧩 Technical Indicators (Implied)
Trend Channel: Uptrend but nearing exhaustion.
Volume: Likely decreasing as price nears resistance (sign of weakening momentum).
Market Sentiment: Short-term bullish → potential reversal zone ahead. RUS:SBER RUS:VTBR RUS:LKOH RUS:ROSN RUS:MOEX RUS:PLZL RUS:T RUS:NVTK RUS:AFLT RUS:SMLT

USOIL: Bears Are Winning! Short!
My dear friends,
Today we will analyse USOIL together☺️
The in-trend continuation seems likely as the current long-term trend appears to be strong, and price is holding below a key level of 61.394 So a bearish continuation seems plausible, targeting the next low. We should enter on confirmation, and place a stop-loss beyond the recent swing level.
❤️Sending you lots of Love and Hugs❤️

NG1!: Next Move Is Up! Long!
My dear friends,
Today we will analyse NG1! together☺️
The market is at an inflection zone and price has now reached an area around 3.348 where previous reversals or breakouts have occurred.And a price reaction that we are seeing on multiple timeframes here could signal the next move up so we can enter on confirmation, and target the next key level of 3.408.Stop-loss is recommended beyond the inflection zone.
❤️Sending you lots of Love and Hugs❤️
NI225: Target Is Up! Long!
My dear friends,
Today we will analyse NI225 together☺️
The price is near a wide key level
and the pair is approaching a significant decision level of 49,299.59 Therefore, a strong bullish reaction here could determine the next move up.We will watch for a confirmation candle, and then target the next key level of 49,674.26.Recommend Stop-loss is beyond the current level.
❤️Sending you lots of Love and Hugs❤️

APPLE: Price Action & Swing Analysis
The recent price action on the APPLE pair was keeping me on the fence, however, my bias is slowly but surely changing into the bearish one and I think we will see the price go down.
Disclosure: I am part of Trade Nation's Influencer program and receive a monthly fee for using their TradingView charts in my analysis.
❤️ Please, support our work with like & comment! ❤️

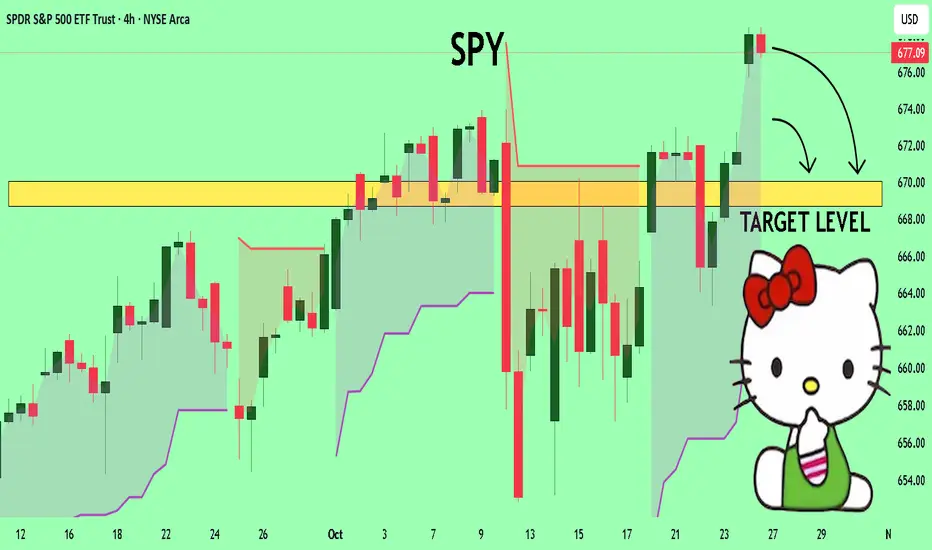
SPY The Target Is DOWN! SELL!
My dear friends,
SPY looks like it will make a good move, and here are the details:
The market is trading on 677.09 pivot level.
Bias - Bearish
Technical Indicators: Supper Trend generates a clear short signal while Pivot Point HL is currently determining the overall Bearish trend of the market.
Goal - 670.03
About Used Indicators:
Pivot points are a great way to identify areas of support and resistance, but they work best when combined with other kinds of technical analysis
Disclosure: I am part of Trade Nation's Influencer program and receive a monthly fee for using their TradingView charts in my analysis.
———————————
WISH YOU ALL LUCK
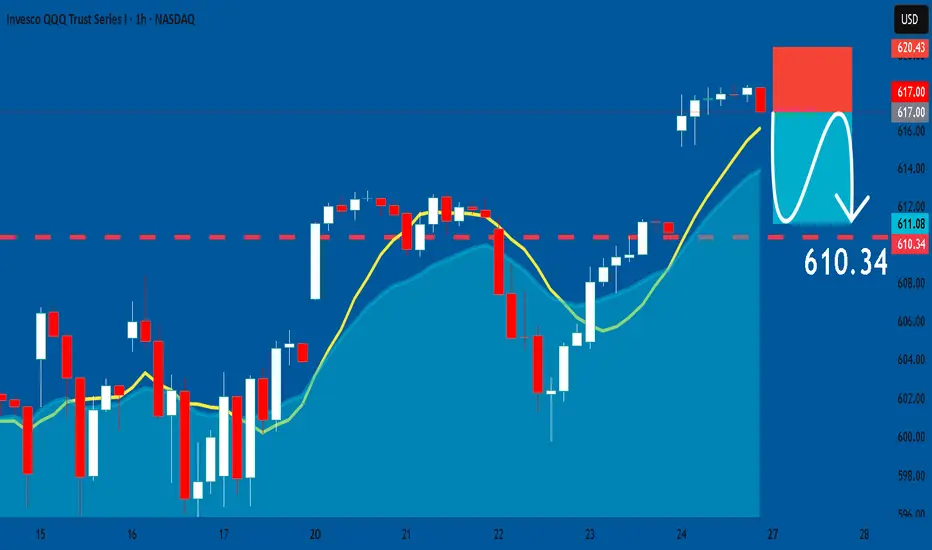
QQQ: Short Trading Opportunity
QQQ
- Classic bearish formation
- Our team expects fall
SUGGESTED TRADE:
Swing Trade
Sell QQQ
Entry Level - 617.00
Sl -620.43
Tp - 610.34
Our Risk - 1%
Start protection of your profits from lower levels
Disclosure: I am part of Trade Nation's Influencer program and receive a monthly fee for using their TradingView charts in my analysis.
❤️ Please, support our work with like & comment! ❤️
EURUSD: Weak Market & Bearish Continuation
It is essential that we apply multitimeframe technical analysis and there is no better example of why that is the case than the current EURUSD chart which, if analyzed properly, clearly points in the downward direction.
Disclosure: I am part of Trade Nation's Influencer program and receive a monthly fee for using their TradingView charts in my analysis.
❤️ Please, support our work with like & comment! ❤️

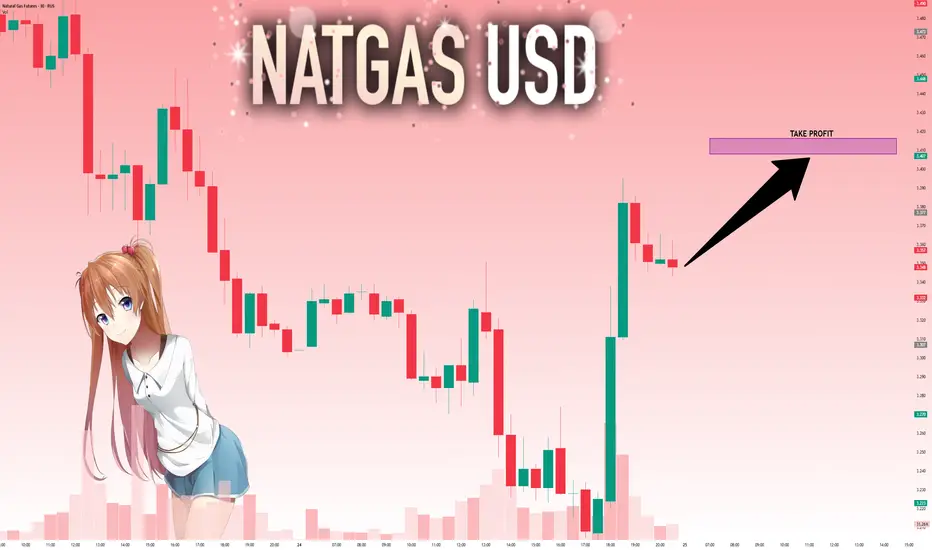
NATGAS: Short Trade Explained
NATGAS
- Classic bearish formation
- Our team expects pullback
SUGGESTED TRADE:
Swing Trade
Short NATGAS
Entry - 3.337
Sl - 3.372
Tp - 3.272
Our Risk - 1%
Start protection of your profits from lower levels
Disclosure: I am part of Trade Nation's Influencer program and receive a monthly fee for using their TradingView charts in my analysis.
❤️ Please, support our work with like & comment! ❤️

TESLA On The Rise! BUY!
My dear followers,
This is my opinion on the TESLA next move:
The asset is approaching an important pivot point 433.50
Bias - Bullish
Safe Stop Loss - 429.07
Technical Indicators: Supper Trend generates a clear long signal while Pivot Point HL is currently determining the overall Bullish trend of the market.
Goal -440.74
About Used Indicators:
For more efficient signals, super-trend is used in combination with other indicators like Pivot Points.
Disclosure: I am part of Trade Nation's Influencer program and receive a monthly fee for using their TradingView charts in my analysis.
———————————
WISH YOU ALL LUCK

USOIL Buyers In Panic! SELL!
My dear subscribers,
This is my opinion on the USOIL next move:
The instrument tests an important psychological level 61.43
Bias - Bearish
Technical Indicators: Supper Trend gives a precise Bearish signal, while Pivot Point HL predicts price changes and potential reversals in the market.
Target - 59.88
About Used Indicators:
On the subsequent day, trading above the pivot point is thought to indicate ongoing bullish sentiment, while trading below the pivot point indicates bearish sentiment.
Disclosure: I am part of Trade Nation's Influencer program and receive a monthly fee for using their TradingView charts in my analysis.
———————————
WISH YOU ALL LUCK

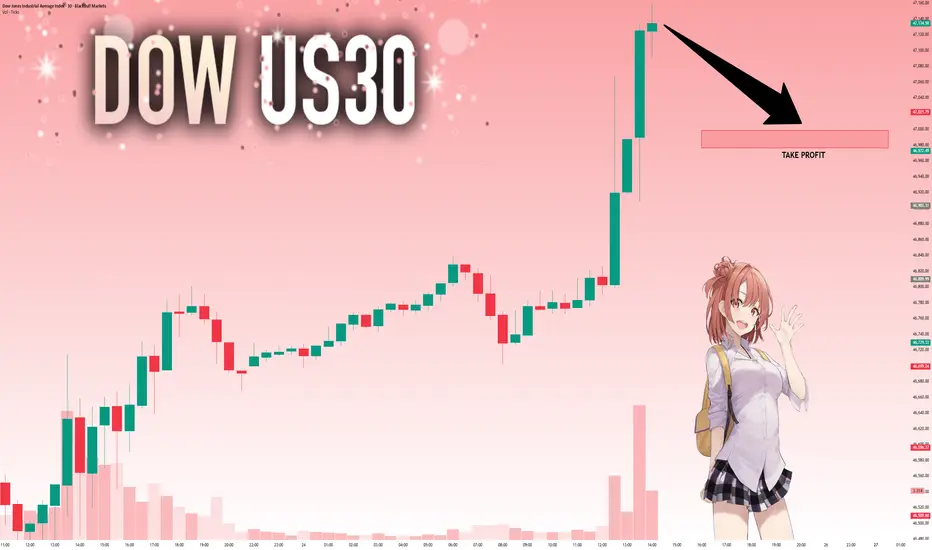
US30 Massive Short! SELL!
My dear friends,
Please, find my technical outlook for US30 below:
The instrument tests an important psychological level 47206
Bias - Bearish
Technical Indicators: Supper Trend gives a precise Bearish signal, while Pivot Point HL predicts price changes and potential reversals in the market.
Target - 46982
Recommended Stop Loss - 47329
About Used Indicators:
Super-trend indicator is more useful in trending markets where there are clear uptrends and downtrends in price.
Disclosure: I am part of Trade Nation's Influencer program and receive a monthly fee for using their TradingView charts in my analysis.
———————————
WISH YOU ALL LUCK

technical analysis of your chart for USD/CAD (15-minute timeframThe pair is moving within an ascending channel, indicating short-term bullish momentum.
Higher highs and higher lows confirm the ongoing uptrend structure.
🟦 Key Zone
Support Level: 1.3985 – 1.3990
This shaded zone represents a demand area where price previously found strong buying interest.
As long as this level holds, the short-term bullish bias remains valid.
🔹 Price Action Outlook
Price is currently testing the lower trendline of the channel and near the support zone.
A bullish reaction from this level could trigger a bounce toward the mid-channel and potentially the upper resistance.
🎯 Target
Upside Target: 1.4039
This corresponds to the upper boundary of the channel and a previous swing high area.
⚠️ Invalidation / Risk Level
A break below 1.3980 would invalidate the bullish setup and could lead to a bearish correction toward 1.3965 or lower.
📈 Trading Signal (Summary)
Bias: Bullish (short-term)
Entry Zone: 1.3985 – 1.3995 (support area)
Target: 1.4039
Stop-Loss: Below 1.3980 ICMARKETS:EURUSD ICMARKETS:GBPUSD ICMARKETS:USDJPY ICMARKETS:GBPJPY ICMARKETS:AUDUSD ICMARKETS:USDCAD ICMARKETS:USDCHF ICMARKETS:NZDUSD ICMARKETS:EURJPY ICMARKETS:EURJPY ICMARKETS:AUDJPY ICMARKETS:EURGBP ICMARKETS:GBPAUD ICMARKETS:USDZAR ICMARKETS:USDDKK

GBPCAD: Bullish Continuation is Highly Probable! Here is Why:
The recent price action on the GBPCAD pair was keeping me on the fence, however, my bias is slowly but surely changing into the bullish one and I think we will see the price go up.
Disclosure: I am part of Trade Nation's Influencer program and receive a monthly fee for using their TradingView charts in my analysis.
❤️ Please, support our work with like & comment! ❤️

AUDNZD: Bearish Continuation & Short Trade
AUDNZD
- Classic bearish pattern
- Our team expects retracement
SUGGESTED TRADE:
Swing Trade
Sell AUDNZD
Entry - 1.1327
Stop - 1.1332
Take - 1.1317
Our Risk - 1%
Start protection of your profits from lower levels
Disclosure: I am part of Trade Nation's Influencer program and receive a monthly fee for using their TradingView charts in my analysis.
❤️ Please, support our work with like & comment! ❤️

GBPAUD Trading Opportunity! BUY!
My dear friends,
Please, find my technical outlook for GBPAUD below:
The price is coiling around a solid key level - 2.0436
Bias - Bullish
Technical Indicators: Pivot Points Low anticipates a potential price reversal.
Super trend shows a clear buy, giving a perfect indicators' convergence.
Goal - 2.0524
About Used Indicators:
The pivot point itself is simply the average of the high, low and closing prices from the previous trading day.
Disclosure: I am part of Trade Nation's Influencer program and receive a monthly fee for using their TradingView charts in my analysis.
———————————
WISH YOU ALL LUCK

EURGBP: Bearish Forecast & Outlook
Remember that we can not, and should not impose our will on the market but rather listen to its whims and make profit by following it. And thus shall be done today on the EURGBP pair which is likely to be pushed down by the bears so we will sell!
Disclosure: I am part of Trade Nation's Influencer program and receive a monthly fee for using their TradingView charts in my analysis.
❤️ Please, support our work with like & comment! ❤️

GOLD: Short Signal with Entry/SL/TP
GOLD
- Classic bearish setup
- Our team expects bearish continuation
SUGGESTED TRADE:
Swing Trade
Short GOLD
Entry Point - 4129.1
Stop Loss - 4142.0
Take Profit - 4102.9
Our Risk - 1%
Start protection of your profits from lower levels
Disclosure: I am part of Trade Nation's Influencer program and receive a monthly fee for using their TradingView charts in my analysis.
❤️ Please, support our work with like & comment! ❤️

EURUSD Technical Analysis! SELL!
My dear followers,
I analysed this chart on EURUSD and concluded the following:
The market is trading on 1.1631 pivot level.
Bias - Bearish
Technical Indicators: Both Super Trend & Pivot HL indicate a highly probable Bearish
continuation.
Target - 1.1615
Safe Stop Loss - 1.1640
About Used Indicators:
A super-trend indicator is plotted on either above or below the closing price to signal a buy or sell. The indicator changes color, based on whether or not you should be buying. If the super-trend indicator moves below the closing price, the indicator turns green, and it signals an entry point or points to buy.
Disclosure: I am part of Trade Nation's Influencer program and receive a monthly fee for using their TradingView charts in my analysis.
———————————
WISH YOU ALL LUCK

US30: Move Down Expected! Short!
My dear friends,
Today we will analyse US30 together☺️
The recent price action suggests a shift in mid-term momentum. A break below the current local range around 47,135.50 will confirm the new direction downwards with the target being the next key level of 46,998.29 and a reconvened placement of a stop-loss beyond the range.
❤️Sending you lots of Love and Hugs❤️