XAUUSD – H2 Technical OutlookXAUUSD – H2 Technical Outlook: Scenario 3 – Corrective Rebound Before the Next Decision | Lana ✨
Gold is showing signs of stabilisation after a strong sell-off, and today’s price action may favour Scenario 3: a corrective rebound. This is not a full trend reversal yet, but a likely recovery phase into key imbalance zones, where the market will decide whether to continue lower or rebuild structure for a broader rebound.
📈 Market Structure & Context
The recent move down was impulsive, clearing multiple supports and creating a clear bearish displacement.
Price is now reacting from a lower base, suggesting selling pressure is slowing and a technical retracement can develop.
In this environment, the focus is on how price reacts at FVG/supply zones above, not on chasing moves in the middle of the range.
🔍 Key Zones to Watch Today
Buy Liquidity / Base Support: 4640 – 4645
This is the current stabilisation area and the most important zone to defend for any rebound scenario.
FVG Support Zone: 4953 – 4958
First major upside target for a corrective rebound. This zone may act as a magnet for price, but also as a reaction area.
Sell FVG (Upper Supply): ~5250 – 5320
If the rebound extends, this becomes the next resistance zone where selling pressure may return.
Strong Resistance: ~5452
A higher objective only possible if price shows clear acceptance and trend rebuilding above key levels.
Structural Pivot: ~5104
A key mid-level. Acceptance above it would strengthen the rebound thesis.
🎯 Scenario 3 – Corrective Rebound Plan
If price holds above 4640–4645 and continues to build higher lows, the market may attempt a push back into imbalance:
First recovery path: 4640–4645 → 4953–4958
If price accepts above the mid-structure: → 5104
Extension (only with strong acceptance): → 5250–5320
Higher target (less likely today): → 5452
This is a structure-first environment: the rebound is valid as long as price defends the base and prints cleaner bullish follow-through.
🧠 Lana’s View
Today’s setup leans toward a retracement-driven rebound, where price rebalances into key zones after a sharp drop. The best approach is to stay patient, track reactions at 4953–4958 and 5250–5320, and let structure confirm whether this rebound is only corrective or the start of a broader recovery.
✨ Stay calm, respect the zones, and let price confirm the next move.
Tecnicalanalysis
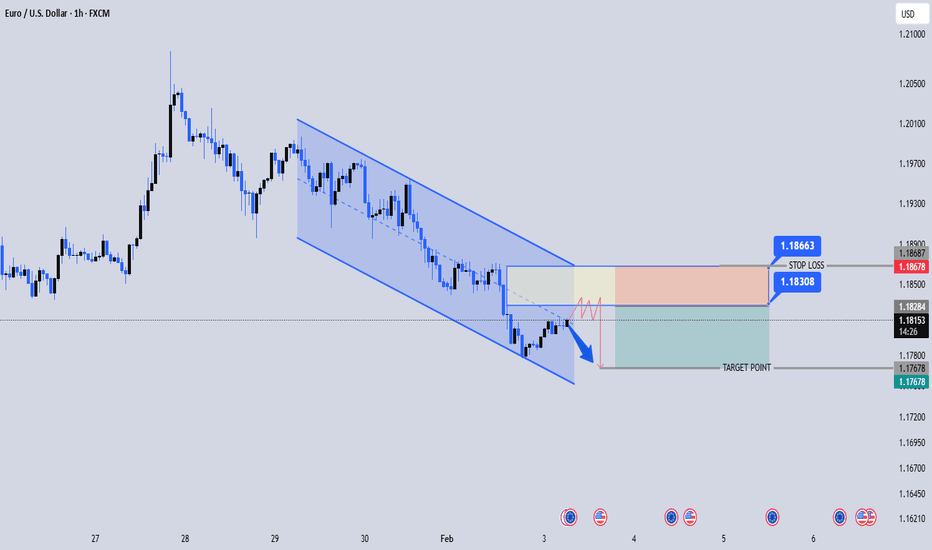
EURUSD 1H – Sell on Pullback After Channel BreakEURUSD – 1H Technical Analysis 📉
Market Structure: Clear bearish channel on the 1H timeframe. Price has been making lower highs & lower lows, confirming sellers are in control.
Current Move: After breaking the channel support, price is doing a pullback / retest into the broken structure (supply zone).
Bias: Bearish continuation favored.
Trade Idea (as shown on chart):
Sell Zone: 1.1830 – 1.1850 (pullback into resistance)
Stop Loss: 1.1868 (above structure / invalidation)
Target: 1.1767 (previous low / demand area)
Confirmation to watch .
Bearish rejection candles (pin bar / engulfing)
Weak bullish momentum during the pullback
Lower timeframe structure break to the downside
Summary:
As long as price stays below 1.1868, EURUSD is likely to continue lower toward 1.1767. Patience on entry = better risk-reward.
XAUUSD (H2) – Liam Bearish OutlookXAUUSD (H2) – Liam Bearish Outlook
Structure broken | Selling pressure remains dominant
Quick summary
Gold has shifted into a clear bearish phase after failing to hold key support levels. The strong sell-off has broken the prior bullish structure, and recent rebounds show signs of weakness rather than accumulation.
At this stage, the market is no longer in a buy-the-dip environment. The priority is selling rallies, not catching bottoms.
Market structure
The previous uptrend has been decisively invalidated by a sharp downside impulse.
Price is now trading below former support, which has flipped into resistance.
Recent recovery attempts lack follow-through and are corrective in nature.
This keeps the broader intraday-to-short-term bias bearish.
Key technical zones
Primary sell zone: 5100 – 5110
Former support turned resistance. This area favours sell reactions if price retests.
Secondary sell / liquidity zone: 4860 – 4900
A corrective bounce into this zone is likely to attract sellers again.
Near-term support: 4690 – 4700
A weak support area that may give way if selling pressure resumes.
Deeper downside targets:
4400 – 4450, then 4120 if the bearish momentum expands.
Trading plan (Liam style: sell the structure)
Primary scenario – SELL rallies
As long as price remains below 5100, any rebound should be treated as corrective. Sell reactions are preferred at resistance and liquidity zones, targeting further downside continuation.
Secondary scenario – Breakdown continuation
Failure to hold 4690 – 4700 would confirm continuation lower, opening the path toward deeper value zones.
Invalidation
Only a strong reclaim and acceptance back above 5100 – 5150 would force a reassessment of the bearish bias.
Key notes
Volatility remains elevated after the breakdown.
Avoid premature longs against structure.
Let price come into resistance, then execute.
Trend and structure first, opinions second.
Focus for now:
Selling rallies while structure remains bearish.
No bottom fishing.
— Liam
EURUSD 15M – Sell the PullbackEURUSD – 15M Technical Analysis 📉
Market Structure: Strong bearish trend visible. Price is respecting a descending channel, making lower highs & lower lows.
Pattern: Short-term bearish pullback / flag inside the downtrend → continuation bias remains sell-side.
Entry Zone: Current price is reacting near the supply / pullback area inside the channel (highlighted zone).
Resistance:
1.1829 – 1.1833 (key intraday resistance & SL zone)
Targets:
TP1: 1.1789
TP2: 1.1765 (channel support / liquidity zone)
Invalidation: Clean 15M close above 1.1833 would weaken the bearish setup.
Bias: ✅ Bearish continuation
Idea: Sell on pullback → ride the trend, not fight it.
BTCUSD – Very Simple Market Idea (4H)BTCUSD – Very Simple Market Idea (4H)
This is the Bitcoin 4-hour chart.
The market is moving down. Price is making lower highs and lower lows. This means the trend is bearish.
Price fell strong before. Now price moved up a little. This move is only a small pullback.
The grey zone above is resistance. Sellers can enter from this area. Price may go down again.
The blue zone below is support. Price can bounce for a short time. If support breaks, price can fall more.
AUDJPY: Price Action & Swing Analysis
The analysis of the AUDJPY chart clearly shows us that the pair is finally about to tank due to the rising pressure from the sellers.
Disclosure: I am part of Trade Nation's Influencer program and receive a monthly fee for using their TradingView charts in my analysis.
❤️ Please, support our work with like & comment! ❤️
EURGBP: Bullish Continuation & Long Trade
EURGBP
- Classic bullish setup
- Our team expects bullish continuation
SUGGESTED TRADE:
Swing Trade
Long EURGBP
Entry Point - 0.8654
Stop Loss - 0.8650
Take Profit - 0.8661
Our Risk - 1%
Start protection of your profits from lower levels
Disclosure: I am part of Trade Nation's Influencer program and receive a monthly fee for using their TradingView charts in my analysis.
❤️ Please, support our work with like & comment! ❤️
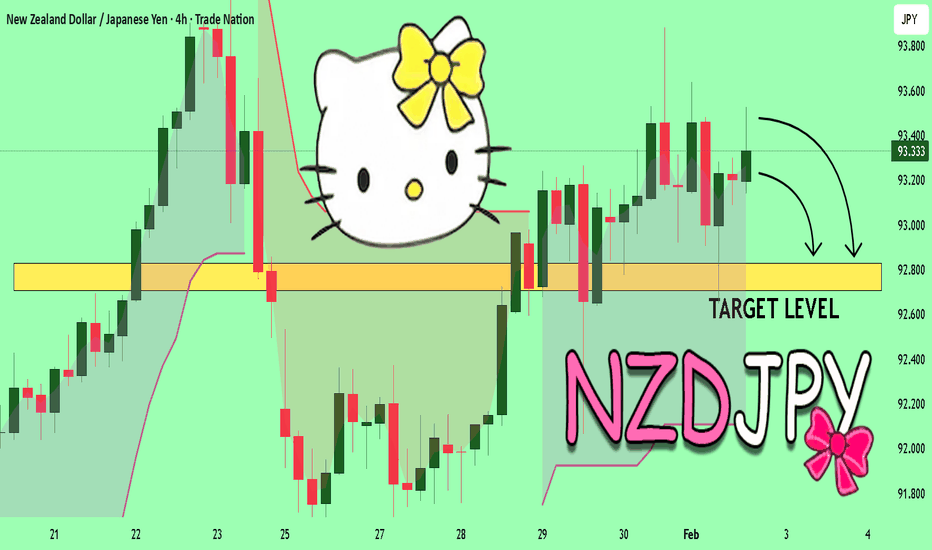
NZDJPY My Opinion! SELL!
My dear friends,
Please, find my technical outlook for NZDJPY below:
The instrument tests an important psychological level 93.349
Bias - Bearish
Technical Indicators: Supper Trend gives a precise Bearish signal, while Pivot Point HL predicts price changes and potential reversals in the market.
Target - 92.827
About Used Indicators:
Super-trend indicator is more useful in trending markets where there are clear uptrends and downtrends in price.
Disclosure: I am part of Trade Nation's Influencer program and receive a monthly fee for using their TradingView charts in my analysis.
———————————
WISH YOU ALL LUCK
EURUSD: Growth & Bullish Forecast
Remember that we can not, and should not impose our will on the market but rather listen to its whims and make profit by following it. And thus shall be done today on the EURUSD pair which is likely to be pushed up by the bulls so we will buy!
Disclosure: I am part of Trade Nation's Influencer program and receive a monthly fee for using their TradingView charts in my analysis.
❤️ Please, support our work with like & comment! ❤️
AUDCHF: Short Signal with Entry/SL/TP
AUDCHF
- Classic bearish formation
- Our team expects fall
SUGGESTED TRADE:
Swing Trade
Sell AUDCHF
Entry Level - 0.5398
Sl - 0.5411
Tp - 0.5380
Our Risk - 1%
Start protection of your profits from lower levels
Disclosure: I am part of Trade Nation's Influencer program and receive a monthly fee for using their TradingView charts in my analysis.
❤️ Please, support our work with like & comment! ❤️
GBPCHF Set To Fall! SELL!
My dear subscribers,
My technical analysis for GBPCHF is below:
The price is coiling around a solid key level - 1.0627
Bias - Bearish
Technical Indicators: Pivot Points Low anticipates a potential price reversal.
Super trend shows a clear sell, giving a perfect indicators' convergence.
Goal - 1.0581
About Used Indicators:
By the very nature of the supertrend indicator, it offers firm support and resistance levels for traders to enter and exit trades. Additionally, it also provides signals for setting stop losses
Disclosure: I am part of Trade Nation's Influencer program and receive a monthly fee for using their TradingView charts in my analysis.
———————————
WISH YOU ALL LUCK [/b
GOLD Massive Long! BUY!
My dear friends,
My technical analysis for GOLD is below:
The market is trading on 4708.4 pivot level.
Bias - Bullish
Technical Indicators: Both Super Trend & Pivot HL indicate a highly probable Bullish continuation.
Target - 4829.8
Recommended Stop Loss - 4622.8
About Used Indicators:
A pivot point is a technical analysis indicator, or calculations, used to determine the overall trend of the market over different time frames.
Disclosure: I am part of Trade Nation's Influencer program and receive a monthly fee for using their TradingView charts in my analysis.
———————————
WISH YOU ALL LUCK
EURUSD – 1H Technical Analysis Price is moving inside a descendEURUSD – 1H Technical Analysis
Price is moving inside a descending channel, showing short-term bearish structure, but it’s currently reacting from a key support zone, hinting at a possible corrective bounce.
Structure & Key Levels
🔽 Trend: Bearish channel (lower highs & lower lows)
🟫 Support zone: 1.1789 (channel lower boundary)
🟢 Entry area: ~1.1867
🔴 Stop loss: 1.1789
🎯 Target: 1.1900 – 1.1906
Scenario
As long as price holds above 1.1789, a pullback to the upside is likely.
The move would be a counter-trend correction, not a full trend reversal unless price breaks and closes above the channel.
Rejection from the upper channel line may resume selling pressure.
Trading Idea
📈 Buy from support → target mid/upper channel
⚠️ Conservative traders should wait for bullish confirmation candle near entry.
Bias
Short-term: Bullish correction
Overall structure: Still bearish
Gold (XAUUSD) 30M – Support Bounce SetupHere’s a clean TradingView ANALYSIS you can post with this XAUUSD 30M chart 👇
(Professional + trader-style, matches your setup)
XAUUSD 30M – Descending Channel Support Bounce
Gold is trading inside a well-defined descending channel, respecting both upper and lower boundaries. Price recently tapped the lower channel support zone, where strong buying pressure appeared, forming a bullish reaction from support.
This bounce suggests a short-term bullish correction within the broader bearish channel.
Key Observations:
Price respected channel support and rejected lower levels
Bullish impulse from support confirms buyer presence
Entry aligned with structure + support confluence
Market targeting mid / upper channel liquidity
Trade Plan:
Entry: Around 4,570 area
Target: 4,710 – 4,720 (channel resistance / target point)
Stop Loss: Below 4,368 (support failure)
As long as price holds above the support level, bullish continuation toward the target remains valid. A break below support would invalidate this setup.
XAUUSD – H4 Outlook: Liquidity ResetXAUUSD – H4 Outlook: Liquidity Reset Before the Next Expansion | Lana ✨
February has opened with heightened volatility across global markets, and gold is no exception. After a strong upside run, XAUUSD has experienced a sharp corrective move, driven largely by deleveraging flows rather than a structural trend reversal.
Current price action suggests gold is entering a rebalancing phase, where liquidity is being cleared before the market can attempt a renewed push higher.
📈 Market Structure & Higher-Timeframe Context
Gold previously traded in a strong bullish structure, but the recent sell-off marked a clear market structure shift (MSS) on the H4 timeframe.
The impulsive decline swept sell-side liquidity below prior consolidation zones, a typical behavior after an extended rally.
Despite the speed of the drop, price is now approaching key support and demand areas, where selling pressure may begin to slow.
This type of move often reflects position reduction and risk-off behavior, not the end of the broader bullish narrative.
🔍 Key Zones to Monitor
Primary Support / Buy Zone: ~4,280 – 4,350
This area represents a strong demand zone where price may stabilize and form a base.
Short-Term Reaction Zone: ~4,450 – 4,500
A zone where price could oscillate during consolidation, suitable for short-term reactions rather than trend trades.
Sell-Side Liquidity Cleared:
The recent drop has already taken liquidity below previous lows, reducing immediate downside pressure.
Upside Rebalance Zones (FVG / Supply):
~4,850 – 4,900
~5,200 – 5,350
These areas are likely to act as resistance during any recovery phase.
🎯 Market Scenarios
Scenario 1 – Controlled Correction (Base Case):
Gold may continue to range or dip modestly into the 4,280–4,350 support zone, allowing the market to complete its liquidity reset. Holding this area would keep the broader bullish structure intact.
Scenario 2 – Recovery After Stabilization:
Once selling pressure is absorbed, price may begin a gradual recovery, targeting the 4,850–4,900 zone first. Acceptance above this level would open the door toward higher resistance areas.
Scenario 3 – Deeper Reset (Lower Probability):
A clean break below the main support would suggest a deeper correction, but at this stage, such a move would still be viewed as corrective within a larger cycle, not a full trend reversal.
🌍 Macro Backdrop (Brief)
The sharp sell-off in gold, silver, equities, and crypto reflects a global deleveraging wave, intensified by rising geopolitical risks and shifting risk sentiment. In such environments, gold often experiences short-term drawdowns, even as its longer-term role as a hedge remains intact.
This reinforces the idea that the current move is more about resetting positioning than changing long-term direction.
🧠 Lana’s View
Gold is not in a hurry.
After a powerful run, the market often needs to pause, rebalance, and absorb liquidity before the next meaningful expansion.
Lana remains patient, focusing on how price behaves around key H4 support zones, rather than reacting emotionally to volatility.
✨ Let the correction do its work. Structure will guide the next move.
XAUUSD – Brian | H1 Technical OutlookXAUUSD – Brian | H1 Technical Outlook – SELL Bias Aligned With the Main Trend
Gold is entering a strong corrective phase after forming a short-term top, with the H1 structure clearly shifting to the downside. The latest bearish leg is impulsive in nature, reflecting active position unwinding and short-term distribution following the prior extended rally.
In this environment, the preferred approach is to prioritise sell setups in line with the dominant intraday trend, focusing on reactions around key psychological and value-based levels.
Market Structure & Price Behaviour
The previous bullish structure has been invalidated by a sharp downside break, confirming a structure shift on H1.
Price is now trading below prior value areas, suggesting a transition from expansion into pullback and continuation to the downside.
Upward moves at this stage are likely to be corrective rallies rather than trend reversals, offering potential sell opportunities.
Key Psychological & Technical Zones
1) Trend-Following SELL Zone
Sell VAL: 5,048 – 5,051
This zone represents the lower value area of the most recent distribution range and is acting as a psychological resistance within the current bearish context. Reactions here are critical for assessing sell-side continuation.
2) Near-Term Balance Level
The 5,000 psychological level remains a focal point for intraday volatility. How price behaves around this round number will help determine momentum continuation.
3) Deeper BUY Zone (Not a Day-Trade Focus)
Buy Zone VAL: 4,450 – 4,455
This is a broader structural support area and should be treated as an observation zone rather than an active long entry during the current session.
Intraday Trading Bias
Primary bias: SELL, aligned with the current H1 trend
Strategy: Look to sell corrective pullbacks into key psychological and value zones
Risk note: Avoid counter-trend long positions while the bearish structure remains intact
In volatile conditions, following the dominant structure and waiting for price reactions at key levels is more effective than attempting to pick bottoms.
Refer to the chart for a detailed view of structure and highlighted zones.
Follow the TradingView channel for early market structure updates and ongoing analysis.
If you want:
a shorter intraday note,
a more neutral tone, or
an alternative version in UK / Indian English,
just say the word and I’ll adjust it for you 👌
SILVER: Will Start Growing! Here is Why:
Balance of buyers and sellers on the SILVER pair, that is best felt when all the timeframes are analyzed properly is shifting in favor of the buyers, therefore is it only natural that we go long on the pair.
Disclosure: I am part of Trade Nation's Influencer program and receive a monthly fee for using their TradingView charts in my analysis.
❤️ Please, support our work with like & comment! ❤️
USOIL: Short Trade with Entry/SL/TP
USOIL
- Classic bearish formation
- Our team expects pullback
SUGGESTED TRADE:
Swing Trade
Short USOIL
Entry - 65.73
Sl - 66.14
Tp - 65.01
Our Risk - 1%
Start protection of your profits from lower levels
Disclosure: I am part of Trade Nation's Influencer program and receive a monthly fee for using their TradingView charts in my analysis.
❤️ Please, support our work with like & comment! ❤️
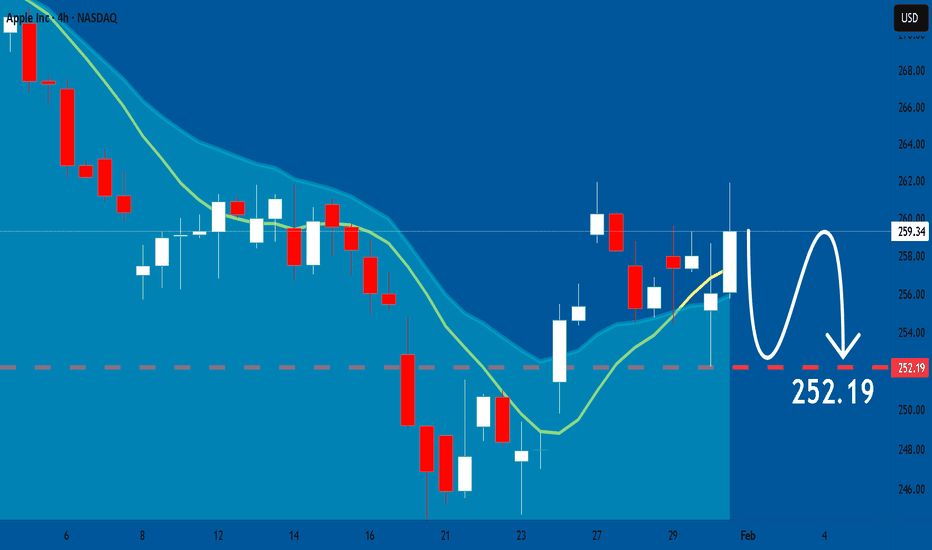
APPLE: Bearish Forecast & Bearish Scenario
Looking at the chart of APPLE right now we are seeing some interesting price action on the lower timeframes. Thus a local move down seems to be quite likely.
Disclosure: I am part of Trade Nation's Influencer program and receive a monthly fee for using their TradingView charts in my analysis.
❤️ Please, support our work with like & comment! ❤️
QQQ: Long Signal Explained
QQQ
- Classic bullish formation
- Our team expects growth
SUGGESTED TRADE:
Swing Trade
Buy QQQ
Entry Level - 621.75
Sl - 618.96
Tp - 627.24
Our Risk - 1%
Start protection of your profits from lower levels
Disclosure: I am part of Trade Nation's Influencer program and receive a monthly fee for using their TradingView charts in my analysis.
❤️ Please, support our work with like & comment! ❤️
EURUSD Technical Analysis! BUY!
My dear followers,
I analysed this chart on EURUSD and concluded the following:
The market is trading on 1.1850 pivot level.
Bias - Bullish
Technical Indicators: Both Super Trend & Pivot HL indicate a highly probable Bullish continuation.
Target - 1.1935
About Used Indicators:
A super-trend indicator is plotted on either above or below the closing price to signal a buy or sell. The indicator changes color, based on whether or not you should be buying. If the super-trend indicator moves below the closing price, the indicator turns green, and it signals an entry point or points to buy.
Disclosure: I am part of Trade Nation's Influencer program and receive a monthly fee for using their TradingView charts in my analysis.
———————————
WISH YOU ALL LUCK
NATGAS Will Collapse! SELL!
My dear subscribers,
NATGAS looks like it will make a good move, and here are the details:
The market is trading on 4.416 pivot level.
Bias - Bearish
My Stop Loss - 4.568
Technical Indicators: Both Super Trend & Pivot HL indicate a highly probable Bearish continuation.
Target - 4.168
About Used Indicators:
The average true range (ATR) plays an important role in 'Supertrend' as the indicator uses ATR to calculate its value. The ATR indicator signals the degree of price volatility.
Disclosure: I am part of Trade Nation's Influencer program and receive a monthly fee for using their TradingView charts in my analysis.
———————————
WISH YOU ALL LUCK
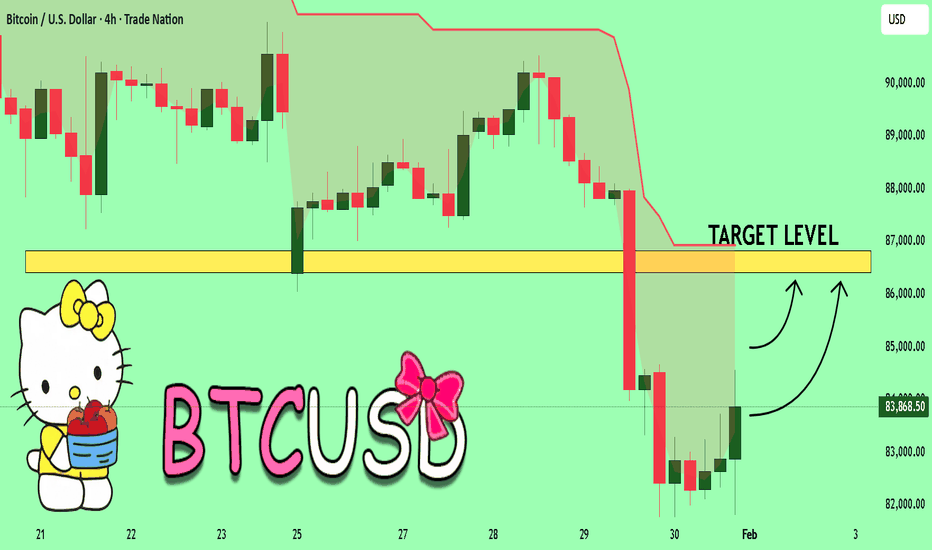
BTCUSD Expected Growth! BUY!
My dear friends,
BTCUSD looks like it will make a good move, and here are the details:
The market is trading on 83868 pivot level.
Bias -Bullish
Technical Indicators: Supper Trend generates a clear long signal while Pivot Point HL is currently determining the overall Bullish trend of the market.
Goal - 86403
About Used Indicators:
Pivot points are a great way to identify areas of support and resistance, but they work best when combined with other kinds of technical analysis
Disclosure: I am part of Trade Nation's Influencer program and receive a monthly fee for using their TradingView charts in my analysis.
———————————
WISH YOU ALL LUCK


