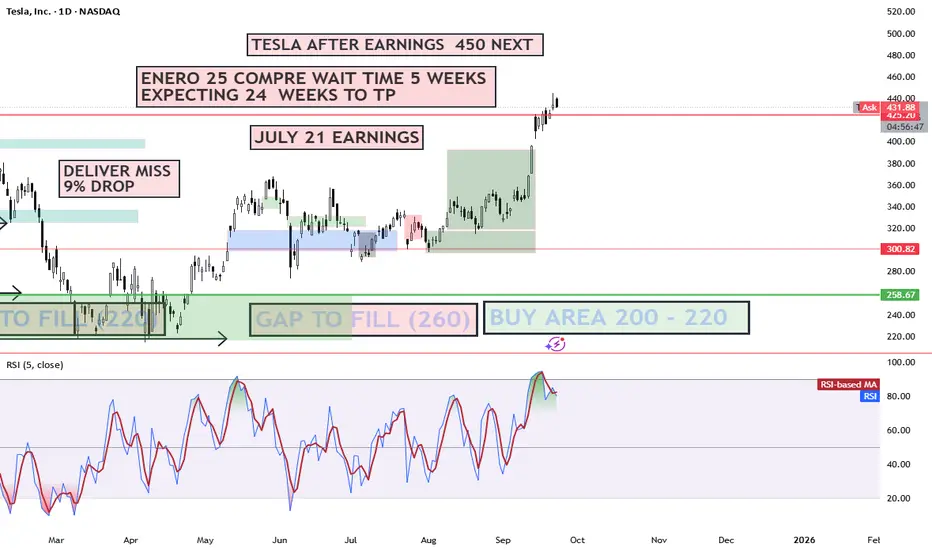
TESLA 500 BY EOY OR 2026 Why Tesla (TSLA) Could Hit $450 Then $500 by EOY 2025 or 2026: Key Catalysts Tesla's hovering around $315 today (as of Sept 23, 2025), down ~20% YTD amid sales dips, but the setup for a rebound to $450 (43% upside) and $500 (59% upside) is primed by execution on autonomy, EVs, and energy. Here's the bull case, blending fundamentals and forecasts:Robotaxi & FSD Rollout Momentum: Tesla's Cybercab unveil in Oct 2025 could catalyze a surge, with unsupervised Full Self-Driving (FSD) v13 hitting highways by year-end. ARK Invest's base case eyes $4,600 by 2026 (driven 60%+ by autonomy), but even conservative models like CoinCodex forecast $453 avg in 2026, with highs to $664 on ride-hailing revenue potentially adding $10T market value.
2 sources
Piper Sandler just hiked their PT, calling TSLA the "top idea" for AV investing.
EV Delivery Rebound & Affordable Models: Post-2025 sales weakness (1.8M deliveries est.), expect 2.3M+ in 2026 with Model 2 launch (~$25K EV) ramping production to 3M+ annually. This counters China/EU headwinds, recaptures 20%+ US market share, and boosts EPS to $0.49 next quarter—fueling a $450 breakout per LongForecast's Q3 2026 path.
2 sources
Morningstar sees a 2026 revival echoing 2016's Model 3 surge.
Energy Storage Boom: Megapack deployments exploding (Q2 2025: 9.4 GWh), with 50%+ YoY growth projected through 2026, diversifying revenue to 15%+ of total. This hedges EV volatility, pushing margins to 20%+ and supporting $500 on 11% revenue growth to $130B.
Optimus Humanoid Robot Sales: External sales kick off late 2025/early 2026, targeting $20K/unit with factory pilots scaling to millions. This could add $1T+ valuation long-term, per ARK, but even modest adoption lifts sentiment to $500 by EOY 2026.
2 sources
Tesla
ADOBE 510 BY 2026 LONG TERM Why Adobe (ADBE) Could Hit $510 by 2026: Technical Breakdown Adobe's trading at ~$365 today, but bullish setups scream upside. Here's why $510 (40% gain) is in play:Bullish Triangle Breakout: ADBE's consolidated in a multi-year ascending triangle since 2020. A recent close above $370 resistance (near 50-day MA ~$383) signals breakout, targeting $510 (measured move from base at $330 low).
RSI Rebound: At 42 (neutral, not oversold), RSI is coiling for momentum shift. Weekly RSI >50 could trigger buy signals, aligning with AI-driven catalysts like Firefly integrations.
MACD Crossover Potential: MACD histogram narrowing (-5.26) hints at bullish crossover by Q4 2025. Paired with 200-day MA (~$420) as next support, this flips sentiment to "Strong Buy" per TradingView.
Analyst Backing: Consensus targets $465–$496 short-term, but long-term forecasts (e.g., LongForecast) eye $577 EOY 2026 on 11% revenue growth to $23B+.

CATL’s HK Debut IGNITES EV Revolution Tesla’s Secret Weapon?🔥 CATL’s HK Debut IGNITES EV Revolution Tesla’s Secret Weapon?
BOOM! Chinese battery king CATL ($CATL.HK) just skyrocketed in its Hong Kong debut, defying Pentagon blacklists. Powering Tesla, VW, and Mercedes, it’s the EV supply chain’s 800-lb gorilla. Funds are pouring in for global domination miss this, and you’re sidelined!
⚡️ Pro Tip: EV stocks are heating up, but US-China tensions could crash the party. Watch NYSE:NIO , NASDAQ:LI too!
🚀 Share this if you’re bullish on EVs! What’s your top EV pick?

Tesla (TSLA) BUYTesla (TSLA) is best known for electric cars, but its future depends on AI. From self-driving vehicles to its Optimus humanoid robot, Tesla is an AI-first company disguised as an automaker.

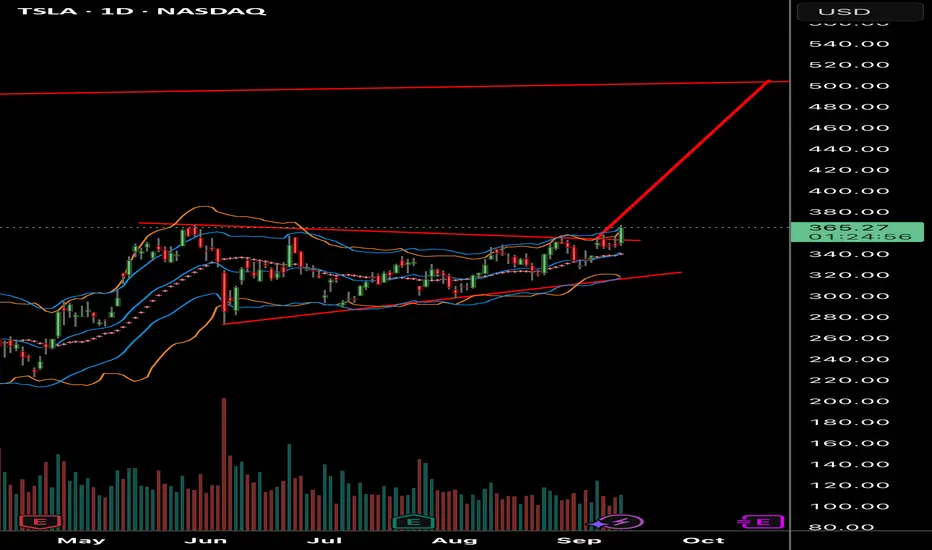
Tesla - Technicals are pretty clear!🚨Tesla ( NASDAQ:TSLA ) respects the triangle:
🔎Analysis summary:
Ever since Tesla was listed on the Nasdaq, we saw perfect cycles playing out. Since 2021, Tesla has once again been consolidating within a bullish triangle pattern. Therefore with the recent bullish break and retest, it becomes more and more likely that Tesla will break out soon.
📝Levels to watch:
$400, $250
SwingTraderPhil
SwingTrading.Simplified. | Investing.Simplified. | #LONGTERMVISION

Tesla (TSLA) Stock Price Rises Above $400Tesla (TSLA) Stock Price Rises Above $400
As the chart shows, Tesla (TSLA) stocks are displaying strong market momentum. In particular, the price:
→ is above the psychological level of $400;
→ has reached its highest levels since late January;
→ has gained around 25% since the beginning of September.
Why Is TSLA Rising?
The main news driving the price surge was a media report that Elon Musk had purchased $1 billion worth of Tesla stock. The market interpreted this as commitment and confidence in the company’s future from its founder, which sharply increased demand for the shares.
Other factors contributing to TSLA’s rise include:
→ Expectations of a Federal Reserve interest rate cut to stimulate the economy. This makes growth stocks such as Tesla more attractive to investors.
→ Reduced tensions between Elon Musk and President Trump’s administration. This removes some of the political risks that had weighed on the stock.
Technical Analysis of TSLA Stock
In our August analysis of the TSLA chart, we:
→ noted that the price had broken through the upper boundary of a broad contracting triangle with its axis around $317;
→ suggested that a correction might follow after the rally in early August.
Since then:
→ the price made a minor pullback before reversing upwards (as shown by the arrow);
→ the bullish trend resumed, providing anchor points to construct a rising (blue) channel.
Thus, the chart confirms:
→ a shift in sentiment in favour of buyers;
→ an improving fundamental backdrop (as highlighted in the news) and growth prospects linked to robotaxis and other innovations.
From a bullish perspective, the breakout of $355 followed by accelerated growth points to strong demand.
From a bearish perspective:
→ the RSI indicator has spiked into overbought territory;
→ the price is near the upper boundary of the rising channel;
→ the seven-month high could prompt profit-taking by investors – already reflected in yesterday’s pullback.
Taking this into account, we could assume that while the long-term outlook remains optimistic, a correction is possible, for example:
→ towards the 50% retracement level of the A→B impulse;
→ into the price expansion zone (a bullish imbalance signal, as described by the Fair Value Gap pattern in the Smart Money Concept methodology).
This article represents the opinion of the Companies operating under the FXOpen brand only. It is not to be construed as an offer, solicitation, or recommendation with respect to products and services provided by the Companies operating under the FXOpen brand, nor is it to be considered financial advice.

CUP AND HANDLE $TSLA TO $515 MINIMUMThe cup and handle is a bullish chart pattern commonly used by traders to spot potential buying opportunities. It features a rounded "cup" formation followed by a slight downward drift forming the "handle." This pattern typically signals a continuation of an upward trend once the handle completes its consolidation phase.
ROBOTAXI BOOM
BUY NOW NASDAQ:TSLL NASDAQ:TSLA

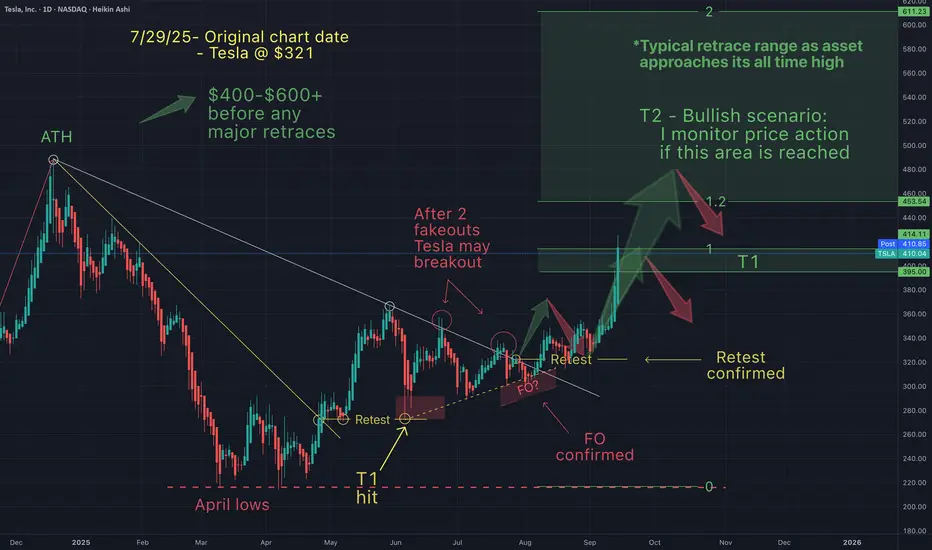
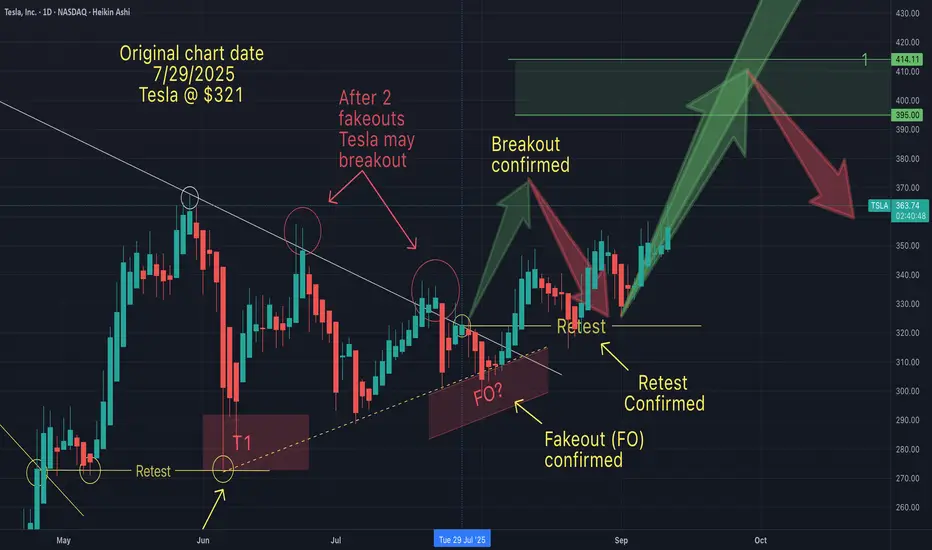
You will ask yourself, "how did he know Tesla would do that"?On July 29th, I posted this chart suggesting that I anticipated a typical pattern to emerge. Things are going according to what I was expecting.
Congratulations to everyone who has been making some gains here based on everthing that was discussed in the charts.
The most important thing in my opinion is a trading strategy...and these strategies have made us incredible gains across the board.
Only question remains, will Tesla hit my T2. What do you think?
May the trends be with you.
TSLA Tesla Options Ahead of EarningsIf you haven`t bought TSLA before the recent rally:
Now analyzing the options chain and the chart patterns of TSLA Tesla prior to the earnings report this week,
I would consider purchasing the 350usd strike price Calls with
an expiration date of 2025-8-15,
for a premium of approximately $14.90.
If these options prove to be profitable prior to the earnings release, I would sell at least half of them.
Disclosure: I am part of Trade Nation's Influencer program and receive a monthly fee for using their TradingView charts in my analysis.

Long TESLATrading Fam,
Today my indicator has signaled a BUY on $TSLA. The technicals align. M pattern looks to have completed at strong support (RED TL) and is bouncing upwards inside of a solid liquidity block. Buyers are stepping in. I'm in at $315 and will shoot for $430 (probably taking some profit along the way). My SL is currently $241 but will trail as we enter profit.
Best,
Stew

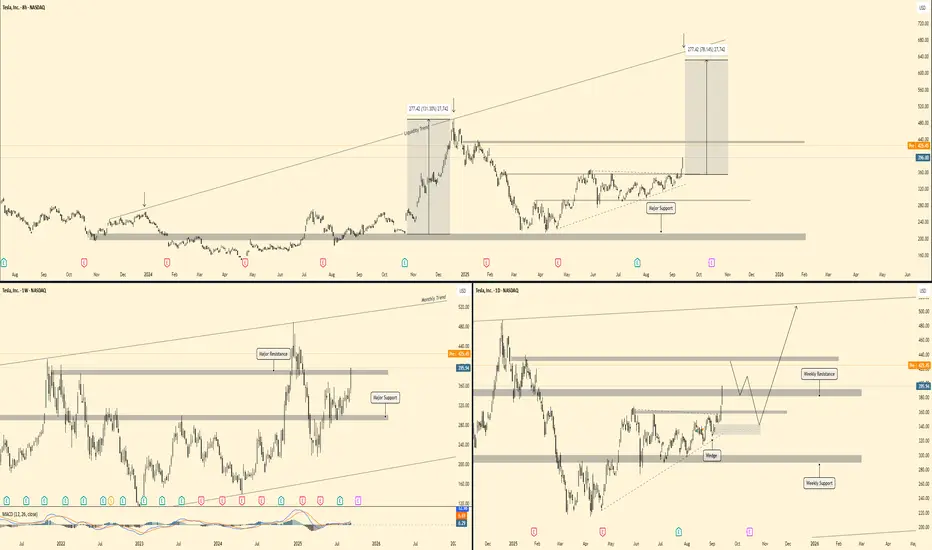
Tesla - Forecast (Before and After)🕰 Weekly View
Price is holding above major support at 325–340 and pushing into weekly resistance around 420–440. The broader monthly trend points higher, with upside liquidity aligned toward the 500–520 zone.
📉 Daily Structure
Resistance: 420–440 supply zone.
Support: 325–340 demand zone, with a secondary base near 280.
Price has broken from a wedge formation and is now testing overhead supply, with potential to retest support before continuation.
⏱ 8H Breakdown
Tesla has been trending steadily upward off major support. Clean structure shows momentum building. A breakout and retest scenario could drive price toward 500+ targets, while failure at 420–440 could cause a pullback into 360–380 support.
🔎 Outlook
Scenario 1 → Retest support (360–380) before continuation higher.
Scenario 2 → Clean breakout above 440 accelerates into 500–520 zone.
Bias : Bullish continuation → mid-term target 500+.
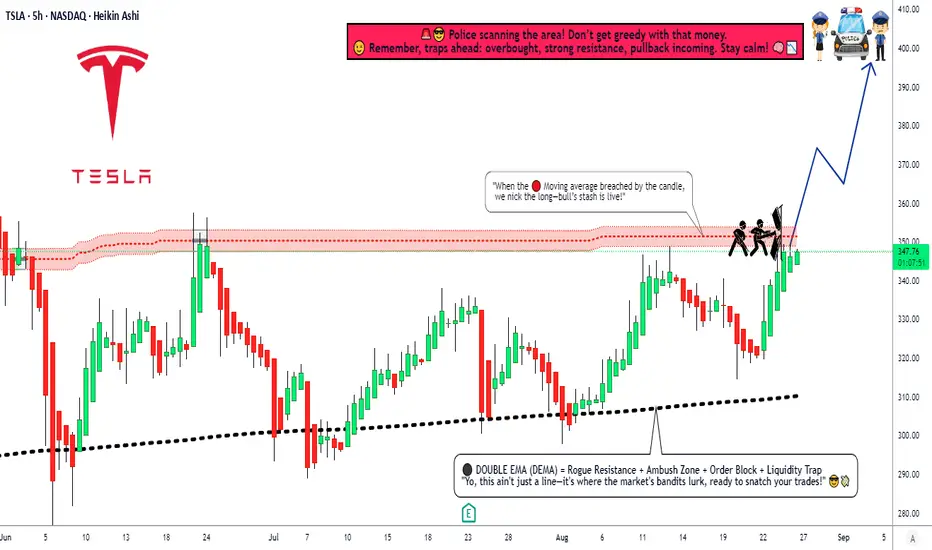
TSLA Breakout Play: Time to Steal Some Profits?🚨 TESLA INC (TSLA) HEIST PLAN - BULLISH SWING/Day LAYUP! 🚨
Yo, Thief OG's! 🐱👤🤑 Time to swarm the TSLA vault. The blueprint is set for a major bullish score. Our intel says the cops (bears) are losing their grip. Let's get this money! 💰💸✨
🎯 THE MASTER PLAN: BULLISH BREAKOUT (PENDING ORDERS)
Based on the Thief Trading Style™ technical analysis, we're plotting a bullish heist on TSLA. We wait for the breakout confirmation, then we strike with precision using our layered entry strategy.
Asset: TESLA INC (TSLA)
Trade Type: Swing / Day Trade
Bias: BULLISH ⬆️⚡
📍 ENTRY: THE HEIST INITIATES (SET YOUR ALARMS! ⏰)
Primary Entry: Breakout and close above $355.00 ⚡
THIEF'S LAYERED ENTRY STRATEGY: 🎯
Don't go all in at one price! We use multiple limit orders to layer into the position after the breakout confirms the move. This is how the pros (and thieves) do it!
Layer 1: Breakout Entry @ $355.00
Layer 2: Pullback Entry @ $350.00
Layer 3: Pullback Entry @ $345.00
Layer 4: Pullback Entry @ $340.00
Layer 5: Pullback Entry @ $335.00
(You can add more layers based on your own capital and risk appetite, you savage!)
📌 IMPORTANT: SET A TRADINGVIEW ALARM at $355.00! This is your signal that the heist is a GO! Don't get caught sleeping. 🛌💤
🛑 STOP LOSS: THE ESCAPE ROUTE
Thief SL for Breakout Entry: $320.00
⚠️ HEAR ME, HEAR ME! Dear Ladies & Gentleman (Thief OG's), adjust your SL based on your own strategy & risk! I am not your financial advisor; I'm just the guy with the blueprint. 🗺️ Place your SL ONLY AFTER the breakout happens. Protect your capital at all costs!
🎯 TARGET: CASH OUT & VANISH
Primary Target: $400.00 🚀
The police barricade is thick up there! 🚓🚧 Once the money is in the bag, don't get greedy! Escape with the stolen profits before they catch you!
Note: Dear Thief OG's, I am not recommending you use only my TP. Take profits at your own risk and based on your own analysis. Secure the bag when YOU feel comfortable! 💼🔥
💎 THIEF'S FINAL WORDS:
This is not a gamble; it's a calculated heist. Follow the plan, manage your risk, and let's eat! 🍽️
Hit the LIKE button if you're riding with us! ✅
BOOST this idea to empower the thief community! 💪❤️
Follow for more daily heist plans! 🎯
Stay sharp, stay profitable, and remember... in the market, be a thief, not a victim! 🐱💻🚀
NASDAQ:TSLA #TradingView #StockMarket #TradingPlan #SwingTrading #DayTrading #Investing #Bullish #TESLA #ThiefTradingStyle
Check if it can rise above 347.21
Hello, traders!
Follow us to get the latest updates quickly.
Have a great day!
-------------------------------------
(TSLA 1D chart)
The key is to determine which direction the price breaks out of the two support and resistance areas of 268.07-311.48 and 347.21-382.40.
For a step-up trend to occur, the price must remain above 334.09-347.21.
However, a step-up trend is highly likely only if the price rises above the support and resistance levels of 382.40 and 421.06 on the 1W and 1M charts.
Even so, a larger increase is likely if the price rises above the 334.09-347.21 range on the 1D chart.
-
The 268.07-311.48 range also falls within the HA-High indicator.
Therefore, it's important to remember that the current position is not a buy position, but rather a sell position.
However, for new buys, it's best to initiate them when support is found near the M-Signal indicator on the 1M chart, if possible.
Therefore, when the 268.07-311.48 range acts as a support zone, it can be considered a buying opportunity.
However, since it's within the HA-High indicator zone, trades should be executed with short and quick responses.
The key volatility period is around October 7th, but before that, we should check the movements around September 5th and September 12th.
At this time, the trend is likely to be determined by which direction the price moves: the 268.07-311.48 range or the 347.21-382.40 range.
-
Thank you for reading to the end.
I wish you successful trading.
--------------------------------------------------

TESLA : Short Signal Explained
TESLA
- Classic bearish setup
- Our team expects bearish continuation
SUGGESTED TRADE:
Swing Trade
Short TESLA
Entry Point - 396.08
Stop Loss - 406.37
Take Profit - 374.02
Our Risk - 1%
Start protection of your profits from lower levels
Disclosure: I am part of Trade Nation's Influencer program and receive a monthly fee for using their TradingView charts in my analysis.
❤️ Please, support our work with like & comment! ❤️
TSLA UPDATE 13 SEP 2025I dont care what price does next. I have exited from Tesla at $390. I want it to go moon and I will buy it back again whenever I want but wont hold here or make new entries here. There is a big monthly supply zone here so I wont be touching Tesla now & wait for further price action

TESLA stock to gain more heights again!Tesla has finally broke out of that ardous consolidation it was in! investors can look for the buying opportunities for a probable pullback on a shown order block!
You will ask yourself, "how did he know Tesla would do that"?I wrote this on my July 29th chart description (below):
"Price action really has less to do with the news making Elon a hero, then a villain and then back and forth...but moreso to do with price action patterns that just keep repeating". Since then, the pattern has played out exactly as anticipated, and my 1st take profit target just hit (+22%).
July 29th chart:
Now the question remains, will Telsa hit my next target range (T2). Although it is a much larger range than my T1, I will monitor price action closely and use TA to get out near the top before the next major retracement.
Let me know if you're into Tesla and if you are interested in me charting the top of this run.
May the trends be with you.

Tesla Breakout? For the majority of the calendar year TESLA has been in a range between $220 - $365 with a clear midpoint of $295.
From March to the beginning of May TESLA bounced between range low and the midpoint until finally breaking through into the upper half of the range where it has stayed ever since. However, there is a clear diagonal resistance level that is preventing higher highs.
So will TESLA breakout, or will it lose the midpoint? Structurally it is clear that the bulls have a set level they are happy to buy at (Midpoint) but the bears are getting more aggressive with their selling, hence the lower highs. This compression inevitably leads to an impulse move but the direction is not so clear.
Bullish scenario: A clean breakout with volume that makes a new higher high, signaling a shift in structure. A pullback and retest of the breakout would be an ideal opportunity to go long and aim for that range high before expecting resistance.
Bearish scenario: The lower highs keep printing until the midpoint is lost and price accepts below it, that would then signify to me the new trading range is between Range Low and Midpoint.
The fakeout scenario is a risk but with price so close to the midpoint already it follows the same invalidation criteria as the bullish scenario, the midpoint is vital to both sides.

TESLA BULLISH BREAKOUT|LONG|
✅TESLA is going up
Now and the stocks is trying to
Made a bullish breakout
Of the key horizontal
Level of 367.50$ and IF breakout
Is confirmed we will be expecting
A further bullish move up
LONG🚀
✅Like and subscribe to never miss a new idea!✅

TSLA about to POPClear play that I’ve been sharing with friends and it’s playing out perfectly so far
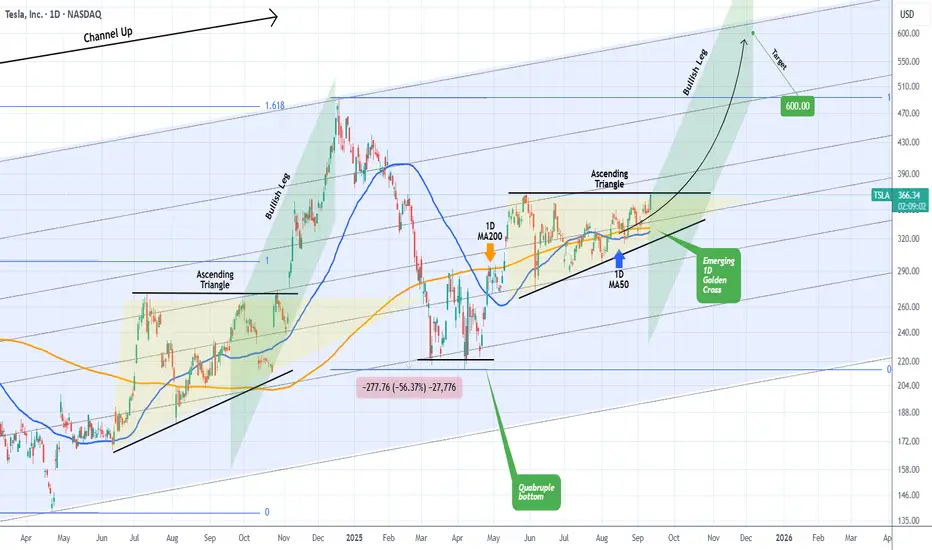
TESLA about to start a parabolic rally to $600.Exactly 3 months ago (June 06, see chart below) we called a bottom buy on Tesla (TSLA) right when it was trading at $284.70:
The price followed this prediction precisely, got out of the Bull Flag and eyes now a new 4-month High above $368.
This would be a break above the 4-month Ascending Triangle, a pattern we last saw during the stocks previous Bullish Leg in mid-end 2024. As you can see, that break-out delivered the Higher High test of Tesla's 3-year Channel Up at $488.
At the same time we are about to form a 1D Golden Cross, which makes the bullish sentiment even stronger.
As with our June 06, we still expect the price to reach $600 and price a new Higher High on the long-term Channel Up
-------------------------------------------------------------------------------
** Please LIKE 👍, FOLLOW ✅, SHARE 🙌 and COMMENT ✍ if you enjoy this idea! Also share your ideas and charts in the comments section below! This is best way to keep it relevant, support us, keep the content here free and allow the idea to reach as many people as possible. **
-------------------------------------------------------------------------------
💸💸💸💸💸💸
👇 👇 👇 👇 👇 👇
Is Tesla on it's way to $400+On July 29th I suggested that Tesla was about to break out to the upside (after fakeouts).
Then on Sep 4th I suggested that after a restest (of the breakout line), Tesla would begin its climb. This portion of the anticipated pattern now been confirmed.
One question now remains...will Tesla hit my T1 ($395 - $414).
What do you think? I'd like to know what the sentiment is out there. I'd like to hear your thoughts.
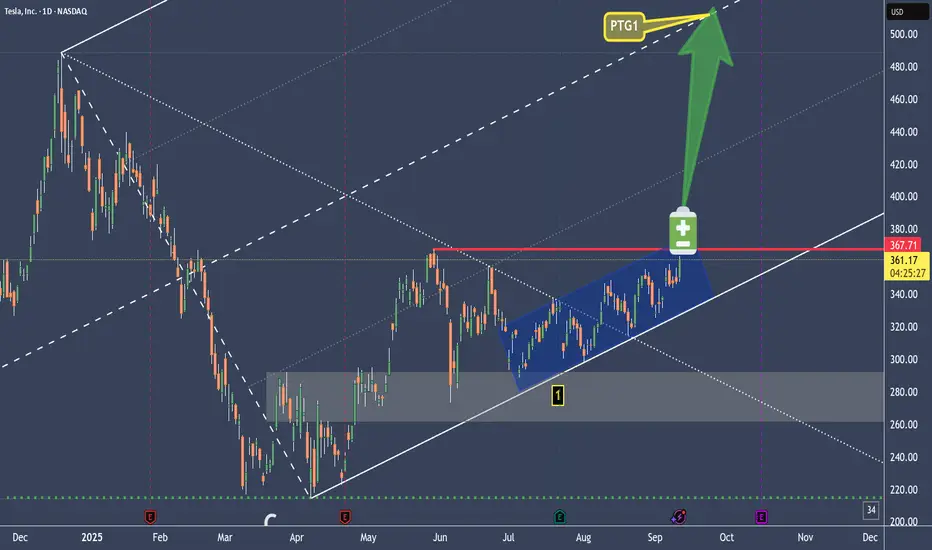
TSLA Battery Is still loading - May the Energy be with you.We see the slanted coil.
It act's like a Battery loading energy.
At one time it will expend it's energy, either up, or down.
Forks show the most probable path of price.
Forks provide a framework, where a Trader doesn't have to guess. Just trade the rule-book and follow your one plan.
Either we get stopped or we are happy Teslonians.
May the Energy be with you §8-)