Why Most Backtests Fail in Live MarketsBacktests often look convincing because they operate in a world that does not exist in live trading. Historical data is clean, fills are perfect, and execution is assumed to be instant. In reality, markets are driven by liquidity, friction, and uncertainty, none of which show up properly in hindsight testing.
The first failure point is liquidity. Backtests assume you can enter and exit at any price shown on the chart. Live markets do not work that way. At key levels, price accelerates, spreads widen, and partial fills occur. What looks like a precise entry in a backtest often becomes slippage or a missed fill in real time, especially during news, session opens, or liquidity sweeps.
The second issue is spread and fees. Many strategies survive on thin margins. A few ticks of spread expansion or commissions per trade are enough to flip a positive expectancy into a losing one. Backtests that ignore realistic costs create false confidence and encourage overtrading systems that cannot survive friction.
Execution timing is the third blind spot. In hindsight, confirmation is obvious. Live, confirmation unfolds candle by candle. Strategies that rely on exact closes, perfect retests, or instant reactions break down when hesitation, latency, or human execution enters the process.
To stress-test ideas realistically, remove precision. Add slippage assumptions, widen stops slightly, delay entries by one candle, and test during different market regimes. If a strategy only works under ideal conditions, it is not robust. Robust strategies survive imperfection.
Backtests are not useless, but they are incomplete. They should test logic, not profitability. Live viability comes from understanding how liquidity, cost, and execution pressure reshape every idea once real money is involved.
Test

TestRight now, Bitcoin (BTC) is in a consolidation phase after recently hitting a new all-time high above $125,000. The price has since pulled back and is trading between $107,000 and $115,000. This range has become an important support zone — if Bitcoin holds here, the uptrend could continue, but if it breaks down, the next major target could be around $100,000.
Market sentiment is mixed. On one hand, institutional demand remains strong, driven by the success of Bitcoin ETFs and the broader perception of BTC as a reliable store of value in an uncertain economy. On the other hand, technical indicators like trading volume and momentum have weakened, suggesting that buyers may be losing strength.
Macroeconomic conditions are playing a big role, too. Softer U.S. inflation data has fueled expectations that the Federal Reserve might begin cutting interest rates later this year, which is generally bullish for risk assets like crypto. However, global geopolitical tensions and signs of financial stress in certain banking sectors are creating uncertainty and limiting Bitcoin’s upside momentum.

Perfect Setup AnatomyPERFECT SETUP ANATOMY: Sept 17, 2025
OBVIOUS LIQUIDITY SWEEP(SSL) AREA, OF COURSE PRICE WILL TAKE IT OUT LOL.
i THOUGHT ABOUT PUTTING AN ENTRY HERE JUST IN CASE MY INITIAL FVA RESPECT
ENTRY WAS TAKEN OUT, BUT I WAS OFF THE PC BY THAT TIME SO I DIDN'T.
WELL, THERE WAS A BULLISH DIV + SWEEP + FVA RESPECT AT THIS POINT,
SO I DID WHAT ANY SANE PERSON WOULD DO, RE-ENTER.
Price moved as follows:
1.) TRENDLINE LIQUIDITY GATHERING
2.) ACCUMULATION BEFORE TRENDLINE BREAKOUT. This is where sweep+div+cisd+fvg+fva happened. "PDA accumulation"
3.) FVA RESPECT/RE-TEST
4.) PRICE HITS ORIGINAL DAY EQH TARGET
5.) I SHOULD HAVE PUT THIS ON 1:3RR,
BUT I'M GOING TO TRY 1:1RR FIRST
(TO INCREASE WINRATE = INCREASE CONFIDENCE IN THE STRATEGY),
WITH A TRAILING STOP THAT STARTS AT 1.5RR USING MT5.
LOGIC IS, SO IT FULL TPs AT 1RR MINIMUM,
AND RIDE THE TREND IF THE PRICE RUNS FARTHER.
-
so, here's what's required again for a trade to start being considered:
0. HTF Target (EQH/EQL) + HTF OF Alignment
1. Previous Orderflow Liquidity Sweep
2. Accumulation of BUY/SELL Arguments (Trendline Liquidity & FVA = recent sweep+div+CISD+FVG) / PDA ACCUMULATION
3. Respect of FVA
4. Entry
Bias - uptrend, day eqh
Narrative - sting into htf fvg = ltf ssl
Context - ssl to eqh
Entry - fva respect & retest

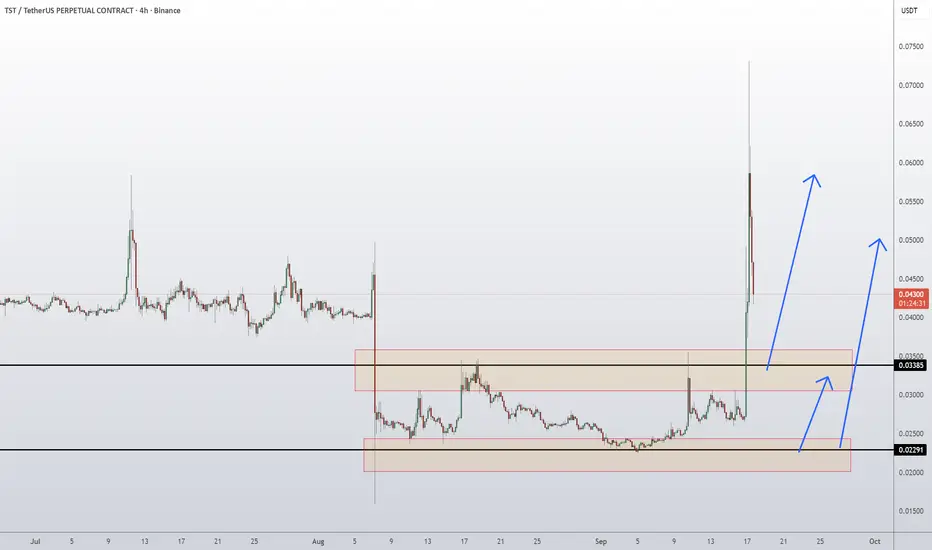
Test Coin TST Token Price Prediction and Technical AnalysisTST/USDT has broken out with a sharp rally from the 0.0229 demand base, clearing the 0.0338 resistance zone and extending toward 0.0521 before facing rejection. Price is now pulling back, and as long as it holds above 0.0338, the bullish structure remains intact. A healthy retest of this support could provide momentum for another leg higher, while failure to defend it risks a return to the 0.0229 demand zone before any recovery attempt.
📈 Key Levels:
Buy trigger: Retest/hold above 0.0338 support
Buy zone: 0.023 – 0.034 region
Target 1: 0.0521 resistance (recent high)
Target 2: Extension toward 0.06 if momentum continues
Invalidation: Daily close below 0.0229 (would negate bullish setup)
👉 Follow me for More Real Time Opportunities.
Share your Thoughts if you have any?
Dummy ideaFastest Way to Create an Idea on TradingView
Here’s a step-by-step guide to quickly publish an idea (analysis, chart, or setup) on TradingView:
1. Prepare Your Chart
• Open TradingView and set up your chart with all desired indicators, drawings, and timeframes.
2. Open the Publish Idea Window
• Shortcut: Press `Alt + P` on your keyboard to instantly open the “Publish Idea” window.
• Or: Click the Publish button at the top-right corner of your chart.
3. Fill Out the Required Fields
• Title: Enter a clear, descriptive title for your idea.
• Description: Write a brief explanation of your analysis or setup.
• Category: Select the appropriate category (e.g., Analysis, Tutorial).
• Direction: Mark your idea as Long, Short, or Neutral.
• Privacy: Choose Public or Private.
• (Optional) Add tags and related ideas for better visibility.
4. Publish
• Confirm you agree to the House Rules.
• Click Publish Idea.

Is about to do somethingPrice just tested the support zone and is bouncing off. This is not a dead cat bounce, is going for more. TP 1 at 4.5, TP 2 at 6. SL triggers if a daily candle closes as shown. But it has to close. This stock is highly volatile, be careful.

Bullish behaviour on NEM stockThe price of Newmont Corporation shares retraced to the areas where professional buying took place in the past (blue rectangles). The volume during that move down is decreasing, which, according to Volume Spread Analysis (VSA), is bullish behaviour.
Also, given that today's bar penetrates the recent demand zone and the professionals were buying there again, this stock looks very strong and has a high chance of reversal.
Closing above the $43.72 level followed by its testing on daily or lower (1H, 15 minutes) timeframes might start the rally towards $55.13 - $55.89 with resistance around $49.27 - $50.12.
If today's bar is tested and supply reappears during this process, we may expect an extension of the ongoing correction to the $37.53 - $38.37 area and another surge of buying there.

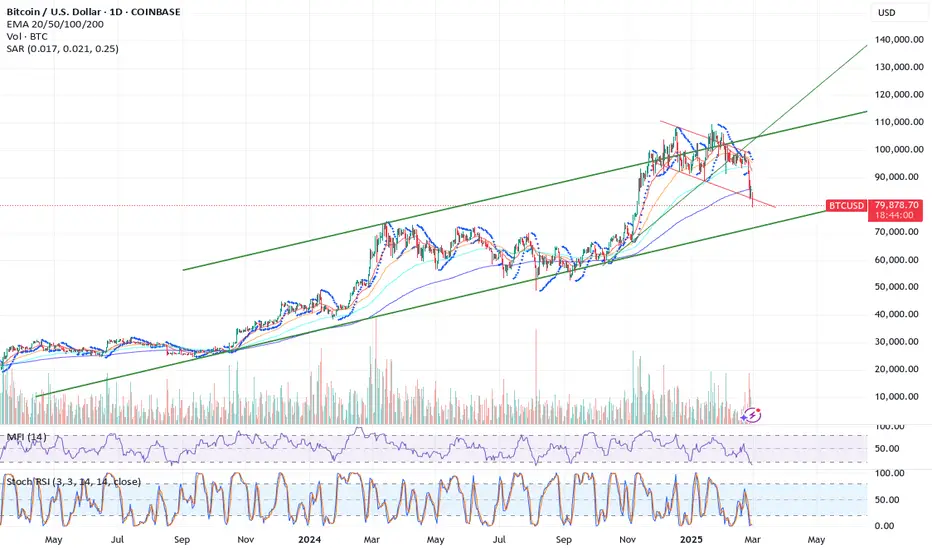
BTC to $72k-$73k to test major supportWe tried to break out of this long term channel and we were rejected like a nerd on prom day. We were tracking a short/medium term descending channel and now we have broken out of that and fast heading for bottom of overarching ascending channel. another really bit of ominous sign is we lost our 200 day moving average, this also puts us at threat of a death cross over the next month or so. Also note the rest of the crypto market for the most part, looks worse than BTC, many are at multi year lows, many have broken their multi-year ascension, few charts look appealing in crypto right now... But we are still inside that long term ascending channel and therefore, still in a bullish trend overall but a lot of things are piling up against it.
So we will look to catch support at around $72- FWB:73K and then hopefully climb back up this channel. If we break the bottom of this two year ascending channel the lows could be a lot lower. The only thing that makes this a little shaky right now is that Ethereum just broke its two year ascending pattern, could it be a sign of whats to come for BTC?
Stay vigilant, personally I would not consider a long before we test that bottom of channel, and even there I would urge tight stop losses for those trying to take advantage of the situation. That also stands for any crypto, never trade any alts and such without also watching BTC, when BTC is unhappy, generally the rest of the market is even more unhappy.
As always, my posts are informational, DYOR.
Reopening tradeIt has more downside. See my previous post. Is testing the broken support now resistance and looks very weak.

Yes, I'm shorting thisBought puts Jan 24, strike 315. Price still in a downtrend and I think it needs more to change that. This is just a test of the broken support now resistance.

Testing...Looks a test of the broken resistance. Also could be a false breakout. I bought calls anyway 01/17 strike 170. If it is a test, it should go up very fast.

Going for another tryPair is testing the broken support level after being rejected by the resistance at 0.98. I think is going to try is going to test again the 0.98 resistance. The double bottom is still active. SL triggers if a weekly candle breaks down the support and closes under it.

HS but wait for a bounce offPerfect HS, I'll short it of the price bounces up and test the broken neck (blue line). I think next week will be green, I'll use it to short this. SL at 19.

test widget dashboardtesting building a widget dashboard. I want to build a dashboard with many charts and am trying to figure out how to embed them in a local file. It keeps making me write more information before I publish, so I'm just going to ramble. Buy low and sell high, but if you're high stay high.

Dr Lal Pathlabs Ltd can it double in one year?Dr Lal Pathlabs one of the largest players of healthcare industry in India has a beaten down stock price currently. It is approximately 53.29% down from it's lifetime high. There is not a single reason for such stock price. The company is posting good results and is consistently showing profits. But the stock is highly undervalued. It is a good time to buy it as the current levels make it a precious deal to make.
Hope you like my analysis.
Please do your own study before investing.
Do like and follow and share among your family and friends.
Thank you.

follow-up of a descending triangle formation on an index In NSE:BANKNIFTY there is failure of descending triangle pattern. When a descending triangle fails, it often leads to a sudden reversal or consolidation rather than a continuation of the prior downtrend. This reversal could result in a period of sideways movement or even a bullish breakout if buying pressure persists. A sustained rally above the upper trendline of the triangle could indicate a shift in momentum and potential bullish continuation.
On the other hand, if the index fails to maintain upward momentum and returns to test the lower boundary of the triangle, it might indicate renewed selling pressure and a potential breakdown.
Traders should always employ proper risk management techniques, such as setting stop-loss orders, to mitigate losses in case of pattern failures or unexpected market movements.

I Think the General Principles Work
These are the principles I have gained due to the reading materials.
1. Wait for Extreme Premium/Discount
2. Wait for Price to Exhaust Pressure
3. Wait for Any Chart Patterns Indicating Reversal
4. Wait for Trendline Break with Momentum
5. Wait for HARSI/WAE Above Explosion Line + Reversal Engulfing Candle Close
6. Entry on Trendline or Pivot Re-Test.
NO DISCOUNT/PREMIUM, NO PRESSURE, NO RE-TEST, NO ENTRY.

Going back to the trendlinePrice is failing the test of the broken support. It may try another test, that would an opportunity to add to my short position. SL triggers if daily candle break through the resistance and confirms the break. Otherwise I hold.

Cosmos(ATOM): Breakout + Re-TestWe're observing a significant development on the ATOM/USDT pair, as we've witnessed a robust breakout from the descending trendline that was previously restraining the bullish momentum. We see that this breakout could lead to a potential retest of the trendline, which, if successful, would confirm the shift to a bullish trend. Currently, our focus is on the $9.7 level.

Back downThe chart is very clear. The pair is testing the broken support now resistance, it may try again but there is a lot of resistance above. I think is going to be rejected to the 0.64 support (blue line). Then will see what it does.

Cardano(ADA): Weekly Up By 28% 😮 / Will We Drop Now? Cardano (ADA) is experiencing a significant breakout on the weekly chart, as the recent candle has surged past both the descending channel resistance and the key horizontal zones. This impulsive move indicates a potential change in trend, suggesting that buyers are regaining control.
But what caught our attention is that the RSI has spiked into overbought territory. If the ADA sustains this momentum and closes the week above these crucial levels, it could signal the start of a more substantial rally. However, given the overbought conditions, we should be vigilant for any signs of a pullback or consolidation before the continuation of the uptrend. The next thing that is most likely to come is a re-test of that same broken trend, so eyes open!

MASK/USDT: Re-Test Might Fail and Show Further Dump! We've been tracking the MASK coin closely and have noticed some interesting movements. The coin attempted a breakout which didn't hold, leading to a sharp decline towards a re-test zone. If this re-test fails to push through, we're likely to witness a further slide into the lower price regions, with the 200 EMA as our primary target. This area will be crucial to watch, as a solid close below could intensify the bearish trend.
We're on the lookout for potential short opportunities upon confirmation of these bearish signals."

We are Bearish all the WayHey Guys!
So today i decided to test a publishing a video idea. lol
It feels great.
The video is a quick interpretation of what we have already stated on the EURUSD analysis.
PS: Apologies for the sound quality. It was just a test and I created it in a pretty noisy environment.
Feel free to drop your comments and boosts.And if you have a different persepctive on this pair, do well to share and we will be glad to learn together.
