XTZUSD to see a slight uptrend(1D) | Lower highs observedMarket in last 1 week
XTZUSD saw a slight uptrend after riding the lower band and moving up
Price volatility was very high. The market moved ~14.3%, between $2.74 and $2.4
Today’s Trend analysis
XTZUSD expected to see an uptrend as the price is trading between midline and lower band with lower highs observed
Price at time of publishing: $2.67
XTZ’s market cap: $1.98 Billion
Oscillator indicators are mostly neutral. RSI at 41
Moving average indicators are biased towards a downtrend. Ichimoku Cloud is neutral and Hull MA indicates a buying opportunity
Volume indicators saw a decrease in initial candles while an increase afterward with a low value for red candle
Price expected to see an uptrend as the price is trading between midline and lower band with lower highs observed. Most of the Oscillator indicators are neutral. MACD line crossed above the signal line with the histogram moving from negative to positive region, suggesting a bullish bias. RSI at 41, below the midline still in the neutral region. CCI is around -33, in the neutral region with an up move. Another interesting point to notice here is that volume saw a decrease in initial candles while an increase afterward with a low value for red candles indicating a shift from sellers to buyers.
----------------------------------------------------------------------------------------
The analysis is based on signals from 28 technical indicators, out of which 17 are moving averages and remaining 11 are oscillators. These indicator values are calculated using 1 D candles.
DM to get details of the above analysis and list of indicators & their values used to arrive at the above conclusion.
Note: Above analysis would hold true if we do not encounter a sudden jump in trade volume .
----------------------------------------------------------------------------------------
If you find the analysis useful, please like and share our ideas with the community!
- Mudrex
Tezos


Tezos! Where did you go my love? XTZUSDGame's turning here guys, post tumble. RSI divergent, Fib goals and invalidation noted, Fib time zones suggest by the by the 7th we should see goals reached if we do. Anyway. I'm still bullish on XTZ.

XTZBTC is in a very interesting placeHi all,
Just a quick TA from me.
The chart says it all, have a look around, zoom in and see how the down trend support line shows that XTZBTC is in fact in a bull flag.
There is of course a very real chance that the markets correct some more if the Dollar has a minor correction rally before it's inevitable further downside.
If we did breakdown I think XTZBTC would just make another bear trap / failed breakdown and that it would in fact just be an even better better place to buy.
This is not financial advice by any means, these are just my thoughts so trade and be safe :)
What are your thoughts?

Last hidden support channel?Related to my first idea. There is still some hope left.
Seems a last hidden support channel has raisen. The green line goes back to 7 Nov 2019.
Three days in a row strong support same price. Shows a chance for growth.
Remember even Chainlink needed 7-8 months before it's big breakout.
Stop loss below 2200 sats.

XTZBTC The Tezos syndrome. Time to buy.XTZBTC has been one of the most consistent pairs throughout the year 2020 so far. So consistent, that in fact helped me calculate the exact top and take a sell position and hit the target with surgical accuracy as you can see on the idea below:
Now I believe it is time to start buying Tezos again as the price has made successive 1D closings above the (blue) annual Rectangle's Support and the LMACD is close to making a bullish cross. See how the LMACD is an additional tool (a little lagging but still quite effective) in determining tops and bottoms.
** Please support this idea with your likes and comments, it is the best way to keep it relevant and support me. **
!! Donations via TradingView coins also help me a great deal at posting more free trading content and signals here !!
Shout-out to TradingShot's top TradingView Coin donor this week ==> NilBalance

$XTZ bullish until it closes a week below 24k sats$XTZ bullish until it closes a week below 24k sats

Tezos on it's last leg?Mixed signals. with higher volume then couple months before. Bearish red wave continuation till mid september. Long if support trades on time above the blue line in. Short if it falls or consolidates longer.
Hard to say a target, since it consolidated for a long amount of time.
Just to point out. The longer it consolidates, the more bears losing momentum


XTZUSD to move sideways(1D) | Price riding the lower bandMarket in last 1 week
XTZUSD saw a downtrend and started riding the lower band
Price volatility was very high. The market moved ~49.9%, between $3.47 and $2.31
Today’s Trend analysis
XTZUSD expected to see a sideways movement as the price after riding the lower band got support from lower band
Price at time of publishing: $2.56
XTZ’s market cap: $1.9 Billion
Oscillator indicators are mostly neutral. RSI at 36
Moving average indicators are biased towards a downtrend. Ichimoku Cloud is neutral and Hull MA indicates a buying opportunity
Volume indicators saw an increase in recent red candles while a decrease in the blue candles with the decrease in the 20-candle moving average
Price expected to see a sideways movement as the price after riding the lower band got support from lower band. Most of the Oscillator indicators are neutral. MACD moving below the signal line with histogram size decreasing in the negative direction, suggesting a bearish bias. RSI at 36, below the midline still in the neutral region. CCI is around -113, in the oversold region indicating an uptrend. Another interesting point to notice here is that volume saw an increase in recent red candles while a decrease in the blue candles indicating a weakening buying pressure.
----------------------------------------------------------------------------------------
The analysis is based on signals from 28 technical indicators, out of which 17 are moving averages and remaining 11 are oscillators. These indicator values are calculated using 1 D candles.
DM to get details of the above analysis and list of indicators & their values used to arrive at the above conclusion.
Note: Above analysis would hold true if we do not encounter a sudden jump in trade volume .
----------------------------------------------------------------------------------------
If you find the analysis useful, please like and share our ideas with the community!
- Mudrex

XTZ/USD - TEZOS GOING HIGHER?!We've been watching Tezos for quite some time.
We played the last rally from the $2.40 support zone and we're here again after a massive crypto sell off. We noticed a bounce slightly higher than the previous lows around this level.
Short term LONG trade idea to $3.20 level.
*NOT A FINANCIAL ADVICE, THIS IS JUST OUR PERSPECTIVE AND WE DO NOT RECOMMEND ANY TRADES WE PUBLISH ON OUR CHANNEL. YOU WILL LOSE MONEY.

Tezos Trading IdeaHello Traders,
Tezos is inside of a huge rectangle formation and it is likely to pump to the top of this formation. The perfect moment to open a long position is on the bottom of this rectangle for a low-risk trade.
Please push the like button and follow us.

Tezos (XTZ) - September 7Hello?
Dear traders, nice to meet you.
"Like" is a huge force for me.
By "following" you can always get new information quickly.
Thank you for always supporting me.
-------------------------------------------------- -----
Make sure you can get support at point 2.4614.
You also need to see if it can rise above the uptrend line (2).
You should also check if you can ascend to the critical section of 2.8886-3.2 to gather the force to ascend.
If it falls below the uptrend line (1), it is a short-term Stop Loss.
------------------------------------------
(Bithumb XTZKRW 1h chart)
In order to turn into an uptrend, it must rise above 3679.0 points.
However, if it is confirmed that it is supported by rising above 3324.0 points, I think it is highly likely to rise above 3679.0 points.
(We plan to publish it together with the XTZUSDT chart until the chart period is longer than about 6 months. We apologize for the inconvenience.)
-------------------------------------------------- -------------------------------------------
** Check support, resistance, and abbreviation points.
** Support or resistance is based on the closing price of the 1D chart.
** All explanations are for reference only and do not guarantee profit or loss on investment.
Explanation of abbreviations displayed on the chart
R: A point or section of resistance that requires a response to preserve profits
S-L: Stop-Loss point or section
S: A point or segment that can be bought for generating profit as a support point or segment
(Short-term Stop Loss can be said to be a point where profits and losses can be preserved or additionally entered through installment trading. You must trade from a short-term investment perspective.)


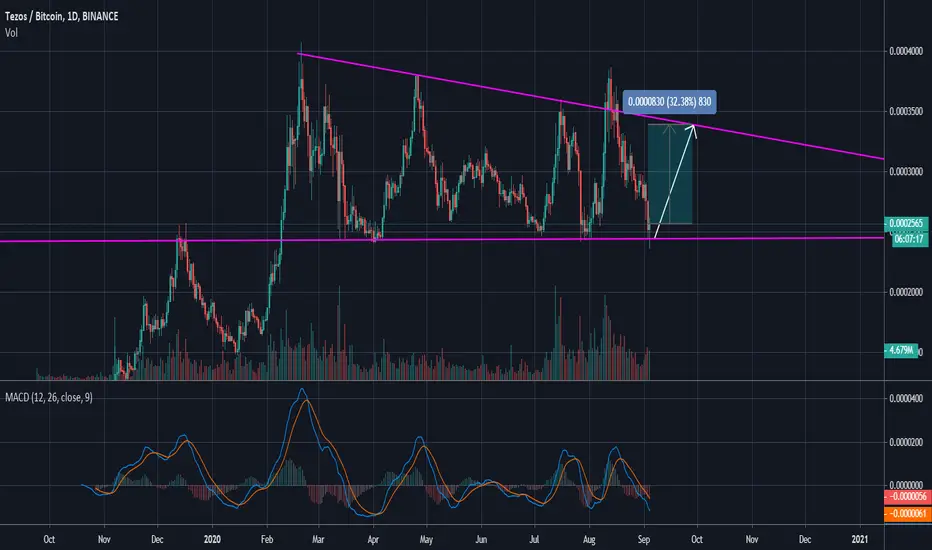
XTZ - Tezos Bouncing Off Strong Support, Long for 32% TargetConsider this long position here. But be mindful of Bitcoin because it could ruin this trade.
Important Support Level Buy on XTZHello, traders.
XTZ is testing the support level of a bullish rectangle and is forming indefinition candlestick pattern.
The buy point is indicated if the price goes above today's candlestick pattern.
Push the Like button.

Tezos at a key level, retest of resistance inc.XTZ is currently at a key level of $3.3 If we see it hold I believe in the next couple of weeks we will see a retest of $3.9-$4 level.
Got my bags ready!

TEZOS +300%Buy now and more low price.
Sell levels on the chart.
Profit 300-500%
Good luck for you !

XTZBTC Possible BullflagVery horizontal price movement
May be a bull flag
If it is it aligns well with my super bullish XTZUSD chart


Invers head and shoulderIm taking a long here and going to aim for 3.55$
Im always have a stop in my mind or setting a stop for what im willing to lose on trades

