$BTC Liquidity Spigot = RRP > TGA > FED BSThe RRP is tapped out.
The Fed Balance Sheet is irrelevant.
Now is time for the TGA to shine.
TGA

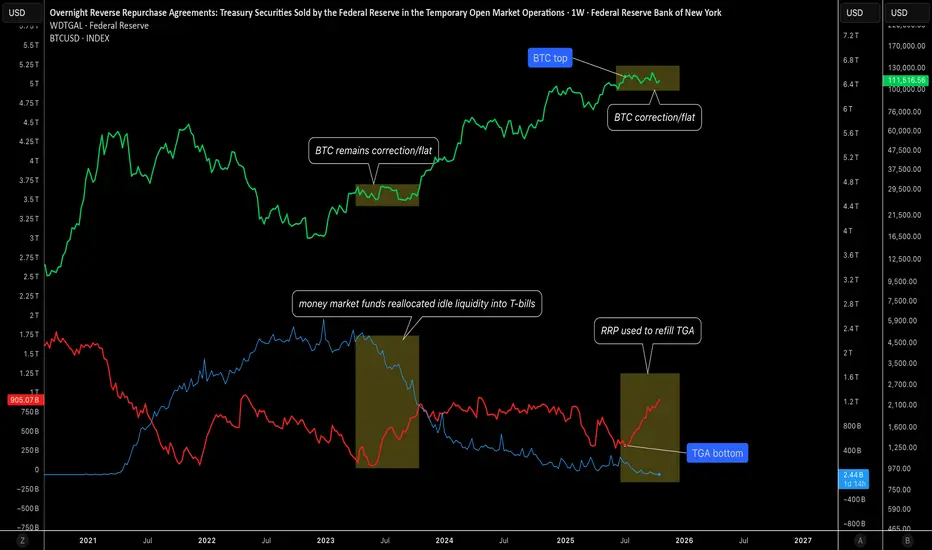
RRP Exhaustion and TGA Rebuild Signal a Tightening Cycle1. Overview
Liquidity conditions across the U.S. financial system have entered a tightening phase once again.
The U.S. Treasury General Account (TGA) has surged from its June low of around $200 billion to roughly $905 billion today, while the Federal Reserve’s Reverse Repo Facility (RRP) has collapsed to just $2 billion, effectively empty.
This shift marks the end of the liquidity buffer that had supported markets over the past year, and the consequences are now visible across risk assets, particularly Bitcoin, which has been trending lower since the TGA bottomed in June.
2. Liquidity Mechanics
The interaction between the TGA and RRP is central to understanding current market dynamics.
- When the Treasury rebuilds its TGA, it issues short-term bills and absorbs cash from the financial system.
- During 2023 and early 2024, this liquidity drain was largely offset by reductions in the RRP balance, as money market funds reallocated idle liquidity into T-bills.
- That mechanism kept overall market liquidity relatively stable — the RRP served as a shock absorber.
Today, that buffer is gone. With RRP nearly depleted, any additional TGA build now draws directly from the banking system’s reserves, tightening liquidity conditions beneath the surface.
3. Liquidity Inflection and Market Correlation
The TGA bottomed in June at around $200 billion, a point that coincided almost perfectly with the Bitcoin top near its recent cycle highs.
This correlation is not coincidental, it reflects the direct relationship between system liquidity and speculative risk demand.
As Treasury began rebuilding its cash balance, liquidity was redirected away from markets and into government accounts.
That liquidity drain aligns with the ongoing weakness in high-beta assets such as crypto and small caps, despite relatively stable macro data and policy expectations.
4. Current Liquidity Regime: Neutral in Level, Tight in Flow
At the aggregate level, liquidity may appear neutral — the increase in TGA has been offset by the decline in RRP, keeping the total size of Fed liabilities roughly unchanged.
However, the composition of that liquidity has deteriorated.
- The RRP is now empty, meaning the system no longer has an easy liquidity source to fund further Treasury accumulation.
- TGA is high and rising, effectively absorbing capital that could have supported credit or speculative flows.
- The bank reserve base is beginning to feel the pressure, tightening funding conditions quietly but steadily.
The result is a liquidity regime that is not collapsing but no longer expanding, which explains why risk assets are stagnant. There is no incremental liquidity flowing down the risk curve.
5. Fiscal and Structural Headwinds
The current U.S. government shutdown further complicates the outlook.
It restricts Treasury operations, delays issuance flexibility, and slows the recycling of liquidity back into the private sector. This prevents the RRP from being refilled and reinforces the liquidity stasis across markets.
In other words, the system is locked:
- The TGA is high and still rising.
- The RRP is empty.
- Reserves are now the adjustment variable, meaning further tightening could emerge if the Treasury continues to absorb cash.
6. Market Implications
- Liquidity exhaustion is becoming visible in market behavior.
- The TGA rebuild represents a clear liquidity drain as it is no longer offset by RRP balances.
- BTC’s reversal from its June peak reinforces the correlation between Treasury liquidity cycles and speculative risk performance.
The neutral aggregate liquidity masks an underlying structural tightening, there is no new money reaching markets.
Until the TGA begins to decline again, releasing liquidity back into the system, the bias for risk assets remains constrained. Markets are likely to remain choppy, with limited upside momentum due to the absence of fresh liquidity inflows.
7. Conclusion
Liquidity conditions are neutral in total but tight in structure. The RRP’s depletion removes the last line of defense against Treasury-driven liquidity absorption.
With the TGA near $905 billion and still rising, risk assets are operating in an environment where no new liquidity is entering the system, only being recycled internally.
The correlation between June’s TGA low and Bitcoin’s top highlights just how sensitive speculative assets are to liquidity cycles.
Until Treasury spending or Federal Reserve policy shifts inject new reserves into the system, market liquidity will remain capped and so will risk appetite.
$BTC / Total Global Liquidity / Treasury General Account How hilarious is this - ₿itcoin ended up reaching a new ATH just 5 days after I expected. I was 2 days off on my last call if you remember. And the several before I nailed to the day.
Remember all the grave-dancers last week who were showing you the decorrelation between CRYPTOCAP:BTC & Global Liquidity??
🐤 chirp chirp 😂
It was clear the Treasury General Account was the cause for this deviation, therefore I added it on this chart alongside Total Global Liquidity to monitor more closely.
Note - the TGA is already included in the TGL index, but it appears to hold much more weight so it’s best to look at it alongside.
I also took out the inverted DXY since it’s been tracking near 1 to 1 and was used simply to show confluence.
Now that Fiscal Year Q1 2026 has started, the TGA refill is complete, which will finance the ~$325 Billion outlined in the One Big Beautiful Bill for defense, border security etc. This will also be financed in the form of short-term T-Bill issuance (what I've written about before).
Then we see the trickle down effect as money makes it’s way through the economy and the business cycle booms which is tracked through the ISM PMI.
The latest print on Sept. 30th showed a 1-point uptick now at 49.1, which is a point higher than last month’s reading. I’m confident the next several months will show readings above 50 which show continued growth in the business cycle and health of the overall economy.
To all the haterz - FU HIGHER 🚀

Treasury General Account MAJOR Impact on $BTC PriceI’ll be the first to admit I failed to closely follow and analyze the impact of the Treasury General Account (TGA).
We all know it’s a liquidity suck on ₿itcoin and cryptocurrencies, which are the most highly sensitive assets to liquidity, but have you ever dove into the data to see just how impactful it is?
I went through all the refills and calculated how much it drew down the CRYPTOCAP:BTC price.
Note how TGA refills also marked cycle tops in 2017 and 2021.
This really is something to closely monitor going forward alongside Total Global Liquidity (TGL).
What I have found is when TGA refills are occurring, they have more impact on the price of BTC than TGL.
We can see this in the current state of market, where TGL is at an ATH and the TGA is currently being refilled.
GOOD NEWS: The TGA refill is just about complete 🏁
Moon on brave soldiers 🌛

UPDATE: Thungela still showing further downside to target R88.70Large H&S since May 2022 formed with the coal mining company.
It broke down in January and since then has been sliding on a gradual downtrend.
Other indicators confirmed downside to come including:
200 >21> 7 - Bearish (Red)
RSI <50 Red
The target still remains to be R88.70 and it looks like coal is still in very murky water.

TRADE UPDATE: Thungela showing more downside to R88.70 - SMCLarge H&S sine May 2022
It broke down and has been on a trajectory path downside.
Indicators are still bearish
200 >21> 7 - Bearish (Red)
RSI <50 Red
Target R88.70
SMC: We know the overall trend is down. There has been a BOS (Break of Structure) twice.
And now with the big candle there is a testing zone to see if there is buying or demand.
Once we get a break down, the price will continue on its path to R88.70.

Master of MarketsThis is an update to a chart I posted last September
Trading View updated the scale for ON RR so I'm reposting the idea so we can watch the rise/fall in playback.
Wall Street banks are now drinking the market liquidity cool-aid.
I wonder which one will be the first to implode this time.
2006-08 was a time of idiots without Money
2020-22 will be the time of idiots with to much Money.

Strong looking chart on Thungela ResourcesKeeping a close eye on this one.
Looks to be putting in a nice tight flag pattern
Will definitely be buying on a strong breakout with high volume

TGATransGlobe Energy Corporation (NASDAQ:TGA) is getting ready to come out of a bullish consolidation pattern in the next few days. A close above $4.08 gets the party started.

TransGlobe Energy Corporation Announces an AgreementTransGlobe Energy Corporation Announces an Agreement to Merge, Extend and Modernize Its Eastern Desert Concessions
Micro-cap TransGlobe Energy (TGA +45.1%) has reached an agreement with Egyptian General Petroleum to merge TransGlobe’s three existing Eastern Desert concessions into a new modernized concession agreement.
The merged concession will have a new 15-year development term and a 5-year extension option.
Improved netbacks and increased cash flows are expected to fund new investments in incremental recovery projects.
TGA will pay an initial equalization payment of $15M and signature bonus of $1M on ratification, with five further annual equalization payments of $10M each being made over five years (beginning Feb. 1, 2022 until Feb. 1, 2026).
finance.yahoo.com

TGA GOING FOR ONE MORE WAVE UP?TGA has broken the downward correction with a strong impulse and now it seems going for a second wave up. I'm expecting a test on the 2,50$ level.
