EURCHF big potential LONGS!EURCHF seems like rising high! Crazy RRR for my setups. Look at the chart ;)
Timeframe

AUDNZD potential SHORT setup on second D and 4H supply retestAUDNZD going down on W, D and 4H. 4H Uptrendline broken on first retest of supply area, also 1 4H demand broken, waiting for retest of supply, which caused it. If so, sell with nice 5:1 RRR.

AUDCAD Bullish PotentialBullish Gartley formation to the bottom of weekly ascending channel and RSI close to oversold conditions. ABC potential completion with divergence on the daily timeframe.
1) Never risk more than 2% of your account.
2) Try to be motionless by applying your strategy to the pip.
3) Invest to yourself and then your capital. Try to educate yourself along with the signals and enhance your risk intelligence and your perception on how Markets work.
4) You do not have to be extremely precise to be highly profitable as long as you take the set-ups with big R/R.


BIG PICTURE resistance and support as well as significant eventsThis is a big picture chart looking at resistance and support levels.
The vertical lines mark events.
1st red line is BCH fork.
Next blue line is the start of the first LTC spike
Followed by the green top of the LTC spike.
Then 2 more red lined on the BCG and failed 2X fork.
These are followed up by a blue line 1 month after (same time frame as before) which might mark the start of the next spike on TOMORROW.
The last 2 green lines would be the tops based on the BCG fork and the failed 2X for if the timing is the same as last time there was a bitcoin fork...
I have been hodling for a long time now so I’m really hopeful we will see another huge spike soon.
But honestly I’m hopping BTC does not follow the spike too because I would love to dump all my ltc into btc then ride into next year in btc. Sell off. Then go back to ltc just in time for lightening atomic swaps to become mainstream.
That’s my plan anyway...


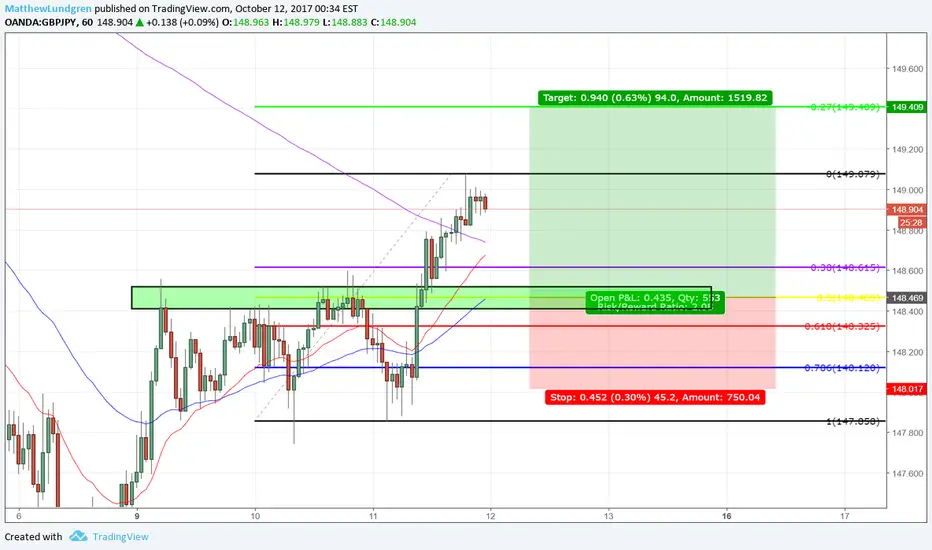
GBPJPY ShortTimeframe: 1H
Confluences: On the 1H chart, price has made a new higher high. I've set the buy order at the 50% bullish fib which lines up with a BRC of a resistance turned support, plus a bullish EMA zone. On the 4H chart, price has broken to the upside from a consolidation zone. On the daily chart, price appears to be making a new higher low, after a retrace into a bullish BRC.
Lower TF Short; Higher TF LongWith a break of 1.68 Support
Suggests that there still might be some more downside Momentum
Bearish Target 1.66
Completion of Bullish Cypher
Previous Post invalidated
However, with a Monthly Closure of an extremely Bullish candle
We can possibly anticipate a strong Bullish push Near the End of the Month
Bullish target remains 1.7225

USD/CHF short term analysis.XABCD pattern shows the downtrend of the market and I used the 4 hr timeframe to add arrows to be in line with the XABCD analysis.

Pullback for a trend continuation We saw a break of our countertrendline to the downside
Anticipating this will be a slight pull back for a continuation of the bullish momentum
Will be monitoring Price Action at the 1.685
Monthly Candle closed extremely bullish and we could possibly see a break out of Monthly consolidation
This new month
Next upside target @ 1.725

Trading Countertrend with MultitimeframeanalysisHi guys,
today I want to show you how I trade countertrend, piecing multiple timeframes together. Keep in mind though, that generally speaking the sentence 'the trend is your friend' is always true.
However when it comes to specific timeframes one can make use of particular price movements. Such as in this case.
As you can see the EURUSD recently had a strong bullish run after forming a tripple bottom at support. The bullish run occured with little to no pullbacks on the monthly, this is the first sign for me that this pair is overextended and in need of a pullback. As most of you will know, price 'breathes' meaning it goes up and down in a waveform. Furthermore price has begun decelerating at resistance. Last month closed as a doji, showing uncertainty in the market, and this month might be closing as a hightest. Keep in mind that this is the monthly timeframe, price action patterns and signals take way longer to form, thus have mostly way more significance, than lets say the hour chart.
Going further on the weekly chart one can see how significant the resistance/support zone at which price is sitting has been in the past. 5 Rejections have occured, most of them pretty violent. Furthermore we can see that price has really moved with little to no pullbacks and is now chopping at the resistance zone. What does this mean for us as traders?
Mostly choppiness is just uncertainty in a market. To make money in this profession, we have to act as smart traders. Smart traders dont just trade when they see something closing in on a potential reversal zone, they build a portfolio for each trade and act upon their trading plan. So far what do we have?
- A overextended bullish run
- Price is sitting at resistance
- Price has formed a doji and might be forming a hightest on the monthly
- Price is also sitting in the 0.5 fib monthly level (treat fib levels like a zone)
- Choppiness on the weekly
For me personally this isn't enough to justify a trade, so lets zoom in on the daily chart.
I used the same levels and what do we see? Massive bearish MACD divergence and a h&s pattern that formed, with a slanting neckline. Now this doesnt mean that this pair will drop with 100% uncertainty, however it gives us more confluence to put into our tradingportfolio. So adding to the confluence mentioned above, we now have:
- A h&s pattern on the daily
- Daily bearish MACD divergence
To pinpoint wether price action is going to change, i also like to look at the 4h chart:
The 4hour chart confirms what we've seen on the daily. A h&s pattern with massive macd divergence. However it also tells us that the neckline of the h&s pattern still holds strong. The first indication of a potential trendchange would be a lower high at the 4h 50 EMA. However I wouldn't enter the trade until the neckline is broken and retested.
This is how I like to put together my trades. Ofcourse the are short trading opportunities which are not showing on the monthly or weekly, however it is always good to build a portfolio for each trade, look at it from different timeframes and justify your actions with confluence.
I will keep you updated and should price move in the right direction I will ofcourse also show my PT and stop placement.
Until then have a good one!

Nasdaq is up 8 pts from the Monday Gap open in RTHMuch Ado about nothing again as this fake out false test of highs two weeks ago, is maxing out those Hoping for another Breakout! Simple sell it! CME_MINI:NQ1!

Soybeans look ready to run againAfter a nice pullback and test it could be time to start another move to the upside as long as 930 holds in Beans!

EURGBP SHORT OPPORTUNITYEURGBP has been climbing to the upside for some time now as the EURO gained significant strength across the pairs. However now we are starting to see a move lower in the EURO as exhaustion enters the market. GBPUSD held at significant key support and bounced showing it may finally be heading for the 1.3300 handle.
Looking at this pair we can clearly see from the higher timeframes price maybe retracing on the weekly & daily timeframes. The 4hr timeframe changed cycles and now we have our opportunity on the 1hr as price held at the moving averages (dynamic resistance). Looking for price to move lower.

CADJPY - Sell Limit Pending Good morning friends!
As you can see from the title, during the night my sell limit order was taken on this pair.
In the picture you can see an H4 graph and a Daily one, respectively pro trend and counter trend. Confusing, isn't it?
Now I'm going to explain the organization of my trade.
As usual, I start from a Daily chart in order to have a complete analysis.
There, I can see a correction (in an up trend) which I reckon we can't call it this way anymore because it's too long, and breaks an important support (as I said yesterday in the EURGBP analysis, check it out, it's really interesting); so I go checking the H4, to use my "powerful magnifying glass" (lol) to see what's going on.
There, I see an uptrend, but attention, thanks to the power of multi-timeframe given to me, I know that could be a trap, because on the Daily chart we should have found a resistance, and, if price wanted to invert (I think it's just happening, maybe with a head and shoulders pattern formation), the bullish trend wouldn't have gone much further.
So, I set a Sell Limit Order right on that resistance, which was taken during the night (12 AM in Italy). Initially that seemed weak, because prices seem like they wanted to break that resistance, but now, they're slowing turning back.
As stop I used the left shoulder, because if prices break it, maybe there's some more power for un uptrend.
As target I used the bottom on the Daily chart, I don't want to exaggerate, if needed I will re enter the market.
Let me know what you think in the comments below :-)
