TIPS

EJ MARKUP : Zone Work-- Although its about to hit tp
I wanted to point out this notion:
--> Consistently gaining a set amount of pips versus the vigorous psychological stampede of trying to hit Jackpot every trade was a humbling lesson from my experience!
--> 10 - 30 pips can go an absolutely long way when you know how to use it.
Don't get me wrong, I want that beautiful swing trade that is going to bat my balance to an overall home run of notable increase.
Yet, I also want a good batting average where I can build the mental strength combined with the skills necessary that will take my runners through all four bases and prepare me for that home run!
The pitcher and the umpire will just be playing a game of catch once they get you to strike out.
From one beginner to another
- stay humble
- know your strategy
- know your play
- build the skill and psychological strength to bag more winners and losers with good sportsmanship
- get your runners to home plate and get some points on the board
- That home run move is coming -- it's waiting on you!
How you play is solely up to you but knowing how you playing is crucial!
--> know your strengths
--> know your weakness
--> use them to your advantage
Best wishes to all
P.S. If you have any tips, notes, or something funny to add .. Please do! I look forward to it.
- Happy Trading &%

RVI TUTORIAL OIL EXAMPLE 5/5 WINNERSSo I am going to breakdown an indicator that I have featured alot in my trades, so if we look at the crude oil chart here, we can see that in total we have 5 notable crosses of the rvi indicator, 3 bearish trades and 2 bullish trades for a total of 510 pips, 5 winners out of 5. Now the magic of the indicator is that it is both an entry signal and an exit signal, enter on cross exit on cross to maintain maximum pips. Personally i find relative vigor index very useful when used in conjunction with good trading ideas and good structure analysis

PTON Corrections is nearPrice of PTON advancing during last period. Looking forward small retracements during next week. Let's see how it will go. Not best time to buy...

$PTON - Bull case $146 & Bear case Target $119Bull Case: Cup & Handle First Target $146
Confirmation: Break above $140
Bear Case: H&S First Target $122-$119
Confirmation: Break below $127
I hold puts for this week.
Good Luck.

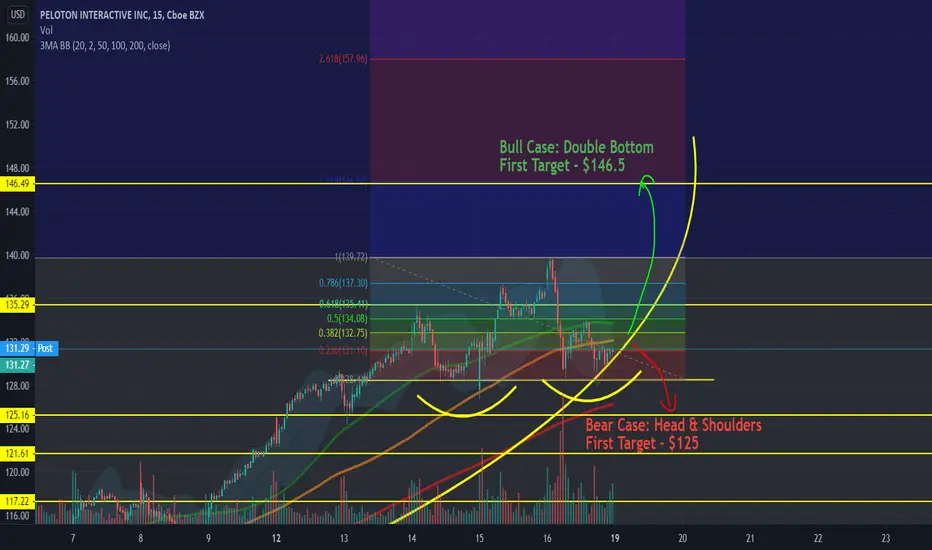
$PTON - Bull case Target $146.5 & Bear case Target $125$PTON is in parabolic trading pattern where it may be due to for a one last pump $146-$151
Check the below scenarios:
Bull Case: Double Bottom -> First Target - $146.5
Bear Case: Head & Shoulders -> First Target - $125
I hold $144 call for next week.
Good Luck.
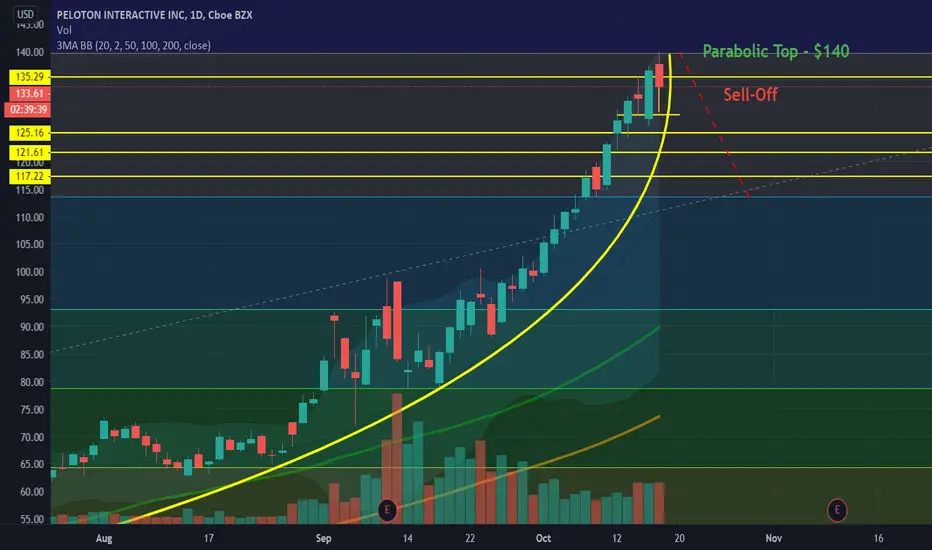
$PTON - End of Parabolic Curve! First Target $125$PTON performed parabolic trading pattern which hit $140 & kudos to who ride this curve.
First downside target (Head & shoulder pattern) - $125
Good Luck.
TIPS Real yields and interest rates are near perfectly negativelTIPS
Real yields and interest rates are near perfectly negatively correlated to Gold, Silver, and the miners. Therefore, the prices for Treasury Inflation Protected Securities (TIPS), which are the inverse of real rates, are near perfectly correlated to precious metals and miners: TIPS fall, Gold falls, and vice versa. TIPS had been falling in corrective fashion lately but are also undergoing a short-term rebound, just as in Gold, etc.

BTC/USD make or break of current trend.BTC on the third leg up and struggling at heavy resistance, established late August through early September. The current trend is fresh, things could easily fold up from here and fall back to previous levels of support, as indicated

$PTON - End of Parabolic Curve? Sell Point at $119?$PTON performed parabolic trading pattern which hit $119 & kudos to who ride this curve.
Now $120 needs to be breached to go any higher otherwise it out of the gas and Sell-off has been triggered.
Good Luck.
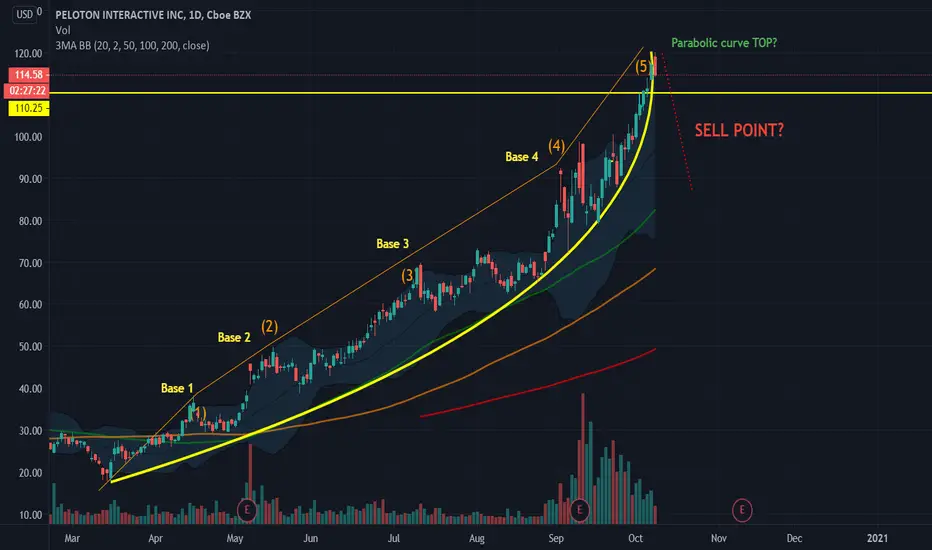
$PTON - Parabolic Curve Top $130-$150? But Couple of checkpointsI recounted the parabolic curve of $PTON where the Base 4 is ended at $103 as shown in the chart.
However a spike from Base 4 is not mandatory in parabolic curve pattern but indicators and pattern are strong enough for the last spike.
But there are couple of checkpoints for the stock to reach $130-$150 :
1) Stimulus Package
2) Trump's health
If these two marked with Green Tick then $PTON stock can hit between $130-$150 in this couple of weeks.
Trade with caution, stop-loss & Risk Management.
Good Luck.

$PTON - Bullish Pennant target $115-$118.5PTON almost breaking out of Bullish Pennant where it can hit between $115-$118.5.
If it fails, it has strong support at $110, $108.5, $106 & 104.
I hold $112 & $120 calls for this week.
Good Luck.

A TIP TO NOT MISS THE NEXT BSV PUMPJust check volume. volume has been declining meaning that a big move is on its way either up or down. If are really low in price and have a breakout with a green volume bar, it could be the start of the pump

Peloton (PTON): The Apple and Netflix of the Fitness IndustryIf you like this analysis, please make sure to like the post, and follow for more quality content!
I would also appreciate it if you could leave a comment below with some original insight.
What is Peloton Interactive (PTON)?
- Peloton is a home fitness company that offers fitness products such as an indoor cycle, and a treadmill, as well as live workout content
- Peloton is similar to Apple (AAPL) in that it promotes the establishment of a hardware-based ecosystem
- It’s also similar to Netflix (NFLX) in that it offers various fitness content in subscription form
Financials
- They initially anticipated $1.72 billion in revenue for 2020, which has been modified to $1.74 billion due to their explosive growth
- This means that PTON demonstrates a 89% year-over-year growth in revenue
- Out of their total revenue, 79% consists of sales of connected fitness products, and 20% from their subscription service
- PTON is one of the few stocks that has benefited from the pandemic.
- With an increasing number of people staying indoors, wanting to exercise, demand for Peloton’s products and services skyrocketed.
- Due to the Coronavirus (COVID-19), they have managed to be profitable for the fourth quarter with an Earnings per Share (EPS) at 27 cents.
- While they are not extremely profitable yet, as PTON is a growth stock, the fact that they have $500 million in cash proves that they will be financially stable for the short term.
Business Analysis
- The fitness machines sold by Peloton are not normal indoor cycles and treadmills with screens attached
- These fitness machines, which cost $2,245 and $4,295, apply cutting-edge technology that allow users to meticulously control the angle and resistance.
- Moreover, these products provide accurate data on the user’s athletic performance.
- The hardware provided by Peloton Interactive are optimized for the contents they provide.
- PTON’s instructors are 30 of the most famous fitness influencers on social media.
- As such, they could expand their streams of revenue to paid advertisements, and ecommerce opportunities, diversifying the business.
- They offer two subscription plans:
- A ‘Connected Fitness’ plan based on the hardware they offer
- And a digital membership that is offered separately
- Connected Fitness allows users to participate in live cycling sessions, and receive immediate feedback from the instructor
- The number of users subscribing to Connected Fitness is skyrocketing, with a 94% increase in users compared to that of the last quarter
- The number of subscribers for Connected Fitness surpassed 1 million in 2020 May
- The digital membership subscription does not require a Peloton hardware, and offers various types of content besides running and cycling, such as yoga, meditation, and boot camps.
- Their customer churn rate remains extremely low at 0.65% every quarter, while the number of users continue to grow every quarter
Technical Analysis
- We can see that prices have been in a phase of accumulation for a long time since later 2019
- As prices traded within a descending parallel channel, we saw a sharp breakdown caused by the market drop, which was triggered by the Corona Virus (COVID-19)
- Unlike other companies that were severely affected by the virus, the pandemic was an opportunity for Peloton to grow.
- As a result, we saw prices break through the $40 resistance zone, and rally in a parabolic trend
- Along the way, it has undergone a phase of re-accumulation, before reaching its all-time high at $91.17
- Currently, we have seen prices cool off, bouncing at $79.34 where the 0.236 Fibonacci support and parallel channel trend line support converge
- The 20 Simple Moving Average (SMA) is also a good indicator of PTON's bullish trend, as well as strong support.
- Based on fundamentals, unless we see a corrective confirmation below $80, we could anticipate new all-time highs for PTON.
Conclusion
Peloton is on its way to completing a hierarchical process of 'hardware-software-content-community' funneling users into their ecosystem. This ecosystem that Peloton is designing has been attempted by many, but successfully done by only a few. With the development of each elements and growth as a whole, we could expect a huge augmentation in the barrier to entry.
One thing to note about growth stocks such as PTON is that the essence of the business is rooted on tech. To say Peloton Interactive (PTON) is another fitness-related company like Fitbit (FIT) is to compare Amazon (AMZN) to bookstores and Tesla Motors (TSLA) to automotive companies.

TIPS hint of a S&P500 breakdown...TIPS is an leading indicator, according to Russell Napier, and it is one of the few leading indicators that have been shown to pre-empt market movement (most of the time).
In this comparison daily chart of TIPS and the S&P500 (orange line),you can see the recent lead but TIPS, and it is now under a Sell signal, with technicals pointing to the end of the bullish rally. And yet the S&P500 is weakening, stalling and just about to roll over.
TIP is about to breakdown a trendline, and MACD is also rolling over into the bearish territory, soon.
A thought to consider...

Market direction TIPS!Interesting correlation and a leading indicator I picked up from Russell Napier since November 2008. He gave me a tip about TIPS, available in his book Anatomy of a Bear. TIPS is one of the leading indicators used by RN.
In this correlative analysis, TIPS gave a heads up of the unsustainable rally of the equity market with a bearish divergence in the MACD. Now that it has broken the second uptrend line, and MACD crossed down, it is good indication that done and dusted a top is done.
The blue line is the S&P500 futures ES1! for reference. You can see previously TIPS precedes the S&P500 in a retracement and a rally. The current time is a concomitant drop, which may indicate the volatility involved (and the depth perhaps).

Again disciplinedI would wait for the set up. The retest may have already happened. So we need to be disciplined. Joining x

How to trade EMA
How to trade EMA
timeframe : 4 hour
Chart : MANABTC
price is holding 100 EMA (7 candle holding perfectly)
Good bounce off EMA 100 that's the good sign .. sideway accumulation complete
Bounce is confirmation wait for retest ( we made bounce they are ready to move pump it added many new buyer and than again dump it and after filing order taking it higher )
>buy retest of breakout of the bounce
make profit


VOLTAS Now With LadderHello There,
Hope You all are fine and fit..
As you all aware we are sharing daily one stock analysation report here, Same you might book profit from our analysation..
This is short evaluataion For Voltas.. As per Current chart we can say that Voltas in purely up trend and can made new high soon, If you are holding this share requesting you all do not exit this till our target points which are : 690 - 720 - 735. If you want to make new entry you can but try with limited Qty and holding mindset should be 1-2 Months. You can also check the chart as we have draw some lines of far support and resistence levels with the trend of red and green arrow lines which will help you to understand how Volatas showing trrend reversal on chart.
Hope You like our research and making good profit..
Thanks,
-UD Trade
Desclaimer : This is for educational Perpose We Are Not Sebi Registered You may ask your investment advisor before any action.

Uptrend HH and HL Trading examplehow to spot uptrend
1) adding a trend line in the chart which works as a support .
2) breaking of downtrend
HH : previous high
HL : previous low
trading uptrend market is simple
here HH is acting as a support so take time and add a zone at the higher high and analyze the candle (hammer , pin bar) perfect and at the bounce add some in to portfolio.
HL : price retest this zone and break the HH and again retest the HH as a support .

R-0114 Breakout of a rectangle pattern in VoltasTK cross over at 585 + MACD cross over + ichimoku cloud break out soggest bullish momentum. Price action in Voltas shows a breakout from a horizontal rectangle pattern on July 20 and then price shows a return move to the top end of the rectangle pattern. The pullback is on low volume suggesting low selling interest in the counter. A series of long tails in three days of trading and a green bar shows a return of buying interest in the counter. Traders may buy above Rs 598 for a rally to Rs 625 and above that to Rs 650. Keep a stop below Rs 575.
