TOTAL2 - Very Strong Bullish Favor This trend line is amazing. I know its the regular chart rather than the log but it can still be applied.
Look at the current position on the trend line and the candles that are progressing
A massive breakout is coming for alts
XRP and ETH are leading this breakout I believe
VERY bullish
Total

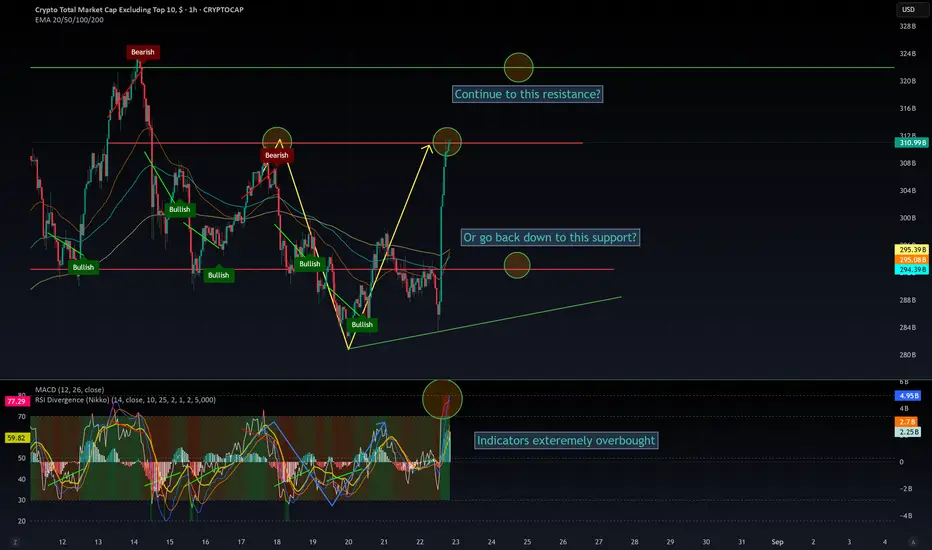
$OTHER Low Timefram (1H) UpdateThe market reacted positively to Powell’s tone, and we saw a massive pump. 🚀
But let me warn you—this move was predictable for a few reasons:
CRYPTOCAP:BTC liquidity was cleared at $111k
A massive $3B short squeeze was lined up for CRYPTOCAP:ETH
👉 This isn’t the first time market makers use Powell as an excuse to liquidate traders—and this time is no exception.
Did Powell announce a rate cut? ❌ No.
He simply tried to de-escalate tensions with Trump. The rate cut still depends on inflation data.
⚠️ Even a 0.5% cut wouldn’t be a revolution. The market isn’t reacting to fundamentals—it’s hunting liquidity. Retail is the target.
Every week the same cycle:
Friday FOMO → lure in retail
Monday dump → wreck them.
📉 Don’t buy the top. The real entry was before the pump. Now is a selling opportunity. If you’re on the sidelines, patience will give you another entry.
DYOR.
TOTAL - total cap crypto "this looks bad," Not saying I've done trivial work in effort to determine the end of an Elliott wave phase peak; so, the chart looks like an Elliott wave does it not? The previously major halving did not have a similar chart where an Elliott wave 1,2,3,4,5 happened. This time it does look like that. Is it possible to have 6,7 phase inclusive to the chart albeit from the idea that Elliott wave means nothing to the new community of virtual currency digital money defi tropes meme derivative foreplay variable online meta landscape of the future? If I was betting on history repeating itself and the looks of the chart here for all cryptocurrency I would say this is not good looking for me, a guy who has made literally no money on cryptocurrency since the last halving despite trying so many times. The world is against me, the trends are fake, the people in society are all brainwashed by propaganda war machine rhetoric political asylums and the minority reports of mainstream majority peoples. Why now? Why not? I'm not looking forward to losing more money then I already have. I haven't made money. Online news doesn't help. Content creators don't help. My family does not help. These indicators which I feel I have a strong understanding of, do not help. Cryptocurrency is too volatile and unpredictable in ways that prevents mathematical decision making becoming profitable. The major players that control the phases of time are established based on the backs of working class people, and savings. We created a monster(s). Now those monsters are eating cryptocurrency for lunch. Cryptocurrency ≠ main course.

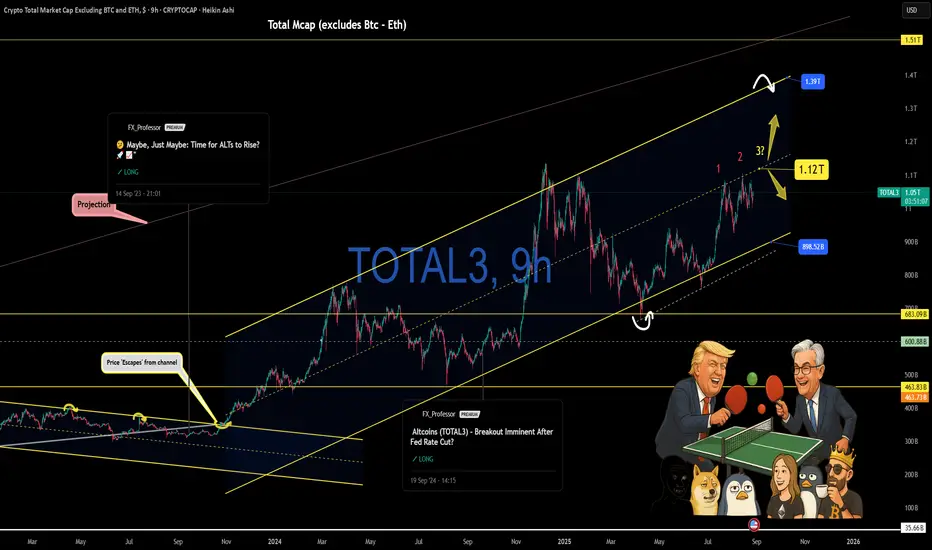
Altcoin Market (TOTAL3) Gearing Up for a Major Test at $1.12T🔥 Altcoin Market (TOTAL3) Gearing Up for a Major Test at $1.12T 📊
Hey guys, Kiri here – the FX Professor.
If you haven’t seen my latest video post, go check it out — I broke down the full story behind Powell, Trump, and the ping-pong match they’re playing with this market. But today, let’s zoom in on what really matters: the Total Crypto Market Cap excluding Bitcoin and Ethereum — TOTAL3 .
🔍 What’s happening?
TOTAL3 is still trading inside its large ascending channel. What we’re watching now is the setup for the third and most decisive test at the $1.12T level.
Why does this matter? Because this level has already caused two strong rejections. A third test here could either confirm the breakout … or become the market’s trapdoor.
🧠 Context:
• S&P 500 is holding above major resistance ✅
• Rate cut decisions expected in September (Powell’s words) 🗓️
• Bitcoin & Ethereum still acting strong — ETH especially outperforming 👑
🎯 What’s the expectation?
I’m leaning more bullish right now. With the macro picture improving and equities pushing higher, I believe we’ll see another test of that 1.12T level soon .
From there, it’s all about the breakout or the rejection.
🚀 If we break out:
Target zones open up at 1.39T and 1.51T — the upper bounds of this long-term channel.
📉 If we reject:
Expect a return to the lower boundary near 898B , adjusting slightly over time since it’s an ascending level.
🧭 Final thoughts:
Markets don’t lie — levels do.
The narrative, the noise, the ping-pong politics… they’re all part of the distraction.
But price? It’s still playing within the structure.
Keep your eyes on 1.12T. That’s the battlefield.
One Love,
The FXPROFESSOR 💙 🌟🤝📈
TOTAL ANALYSIS (4H)After the speech of the currently most hated man in finance, the entire market experienced a strong pump. With this upward move, TOTAL market cap is now signaling a potential trend shift.
The corrective A-B-C wave has already concluded following the formation of a double bottom.
A new impulsive upward wave now appears to be on the horizon.
Key Levels:
The current retracement for Wave 3 should find support around $3.83T.
The main target for Wave 3 is projected near $4.4T.

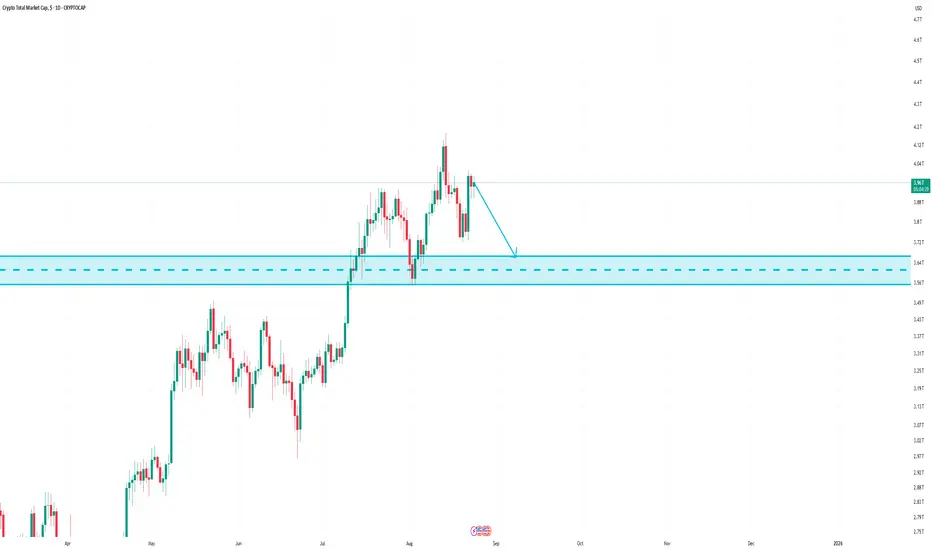

$OTHERS Market Update 📢 CRYPTOCAP:OTHERS Market Update
CRYPTOCAP:OTHERS has been consolidating in my horizontal range, between $193B and $320B.
⚠️ A clear Head & Shoulders pattern is forming — one of the most reliable bearish setups. At the same time, both RSI and MACD are in overbought territory, increasing the probability of a correction.
📉 Main Scenario:
A breakdown of support looks likely, with a retrace toward $260B. I don’t expect it to fall much lower.
✅ This reset would be healthy, clearing short-term exhaustion and setting up for a longer, more sustainable rally.
✅ It would also create great buying opportunities, especially for altcoins that haven’t pumped yet, like CRYPTOCAP:PEPE and $SUI.
📊 Alternative Scenario:
CRYPTOCAP:BTC and CRYPTOCAP:ETH could continue their institutional-driven rally, preventing this retrace. But that would leave many sidelined traders without the chance to reload at lower levels.
⚖️ Key takeaway:
Patience is everything. Even if CRYPTOCAP:BTC pushes higher next week, markets often pull back unexpectedly, offering us a second chance to buy.
🚀 Watch my green zones and check my other ideas for refill opportunities.
🔎 DYOR & trade safe.
🔖 #Crypto #Altcoins #OTHERS #Bitcoin #Ethereum #Altseason #CryptoTrading #TradingView #BTC #ETH #PEPE #SUI #CryptoAnalysis

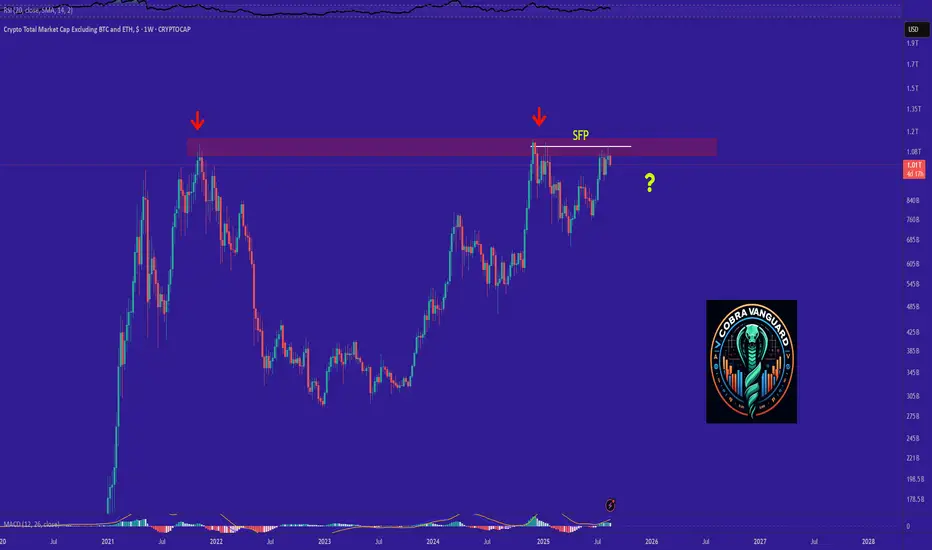
Is an SFP currently occurring ?If this ceiling isn't broken, an SFP (Swing Failure Pattern) could occur, potentially leading to a sharp price drop similar to previous declines.
$TOTAL analysis and the market psychologyOn this chart, I’ve highlighted some reliable patterns showing how the market often moves opposite to public sentiment.
📉 The triple top pattern led to only a small correction, and now we’re entering another one.
It’s the same story every time: when the RSI is overbought, social media explodes with “BUY! BUY! BUY!” — fueling FOMO and pushing late entries. That’s usually the best time to take profits.
Now, with CRYPTOCAP:BTC correcting after touching $124K and eyeing the $111K zone, we’re likely to see fear and negativity on social media, with people calling for the “end of the bull market.” Ironically, that’s exactly when smart money starts buying.
The market is designed to play with your emotions:
When it dumps → that’s your chance to buy at strong entries.
When RSI is overheated and everyone screams ATH → that’s the moment to take profit.
So… are you ready to refill your bags? 🚀
Check my ideas for clear entry zones on coins like CRYPTOCAP:INJ , SEED_DONKEYDAN_MARKET_CAP:BONK , CRYPTOCAP:PEPE , LSE:CFX , SEED_DONKEYDAN_MARKET_CAP:FLOKI , CRYPTOCAP:SUI , and more.
⚠️ DYOR (Do Your Own Research).


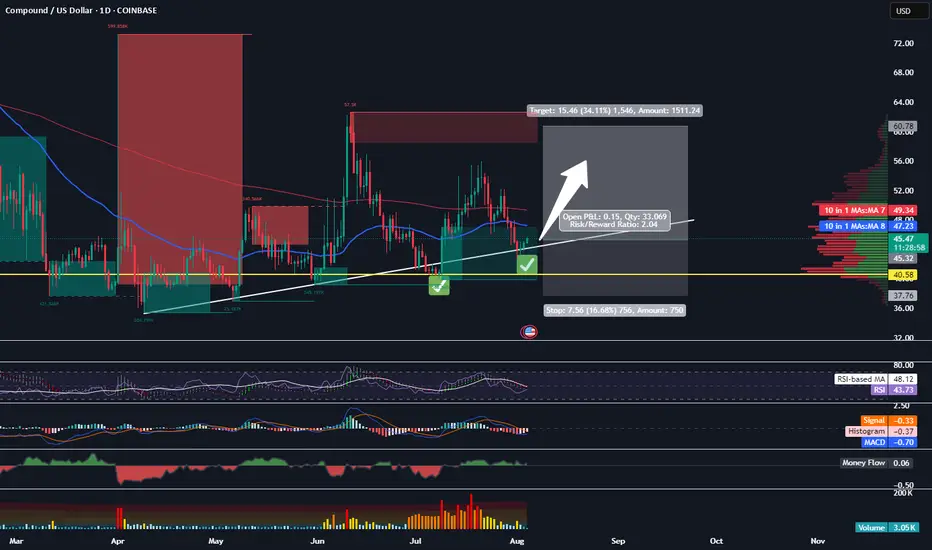
Buying COMP HereMorning Trading Fam,
After a several-week pause, my indicator is starting to light up with BUY signals again on a few alts. You may have noticed the update I gave on my TOTAL chart post. Price has come down to touch that 50-day EMA as expected. There was one more drop possibility (see post), however, I am taking my chance here, being a little more aggressive, and admittedly entering earlier than the crowd. I don't want to miss the run that I expect to come soon.
I received a BUY on FARTCOIN earlier and doubled up once again. Shortly thereafter, I received a signal on COMP here. We look to arrive on good support and are inside a beautiful block of liquidity. That is exactly where I received the signal to BUY, which I was hoping for. I'm jumping on this. Target will be around $60 with my SL set for $37.75 for a 1:2 rrr.
✌️Stew
TOTAL - Gonna Hold My Coins, Wait & See...This is my own experiment, gonna buy the most underrated top 30 coin, the most hated one. Put $5k on it right now and wait until this happens. Maybe this wont work but we will see!

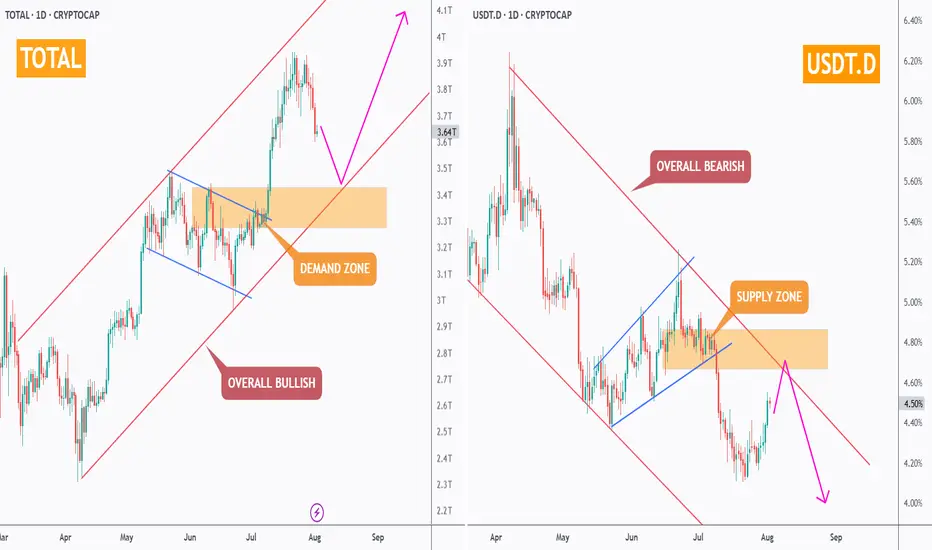
Don’t Panic — It’s Just a Healthy Crypto Correction!While the crypto market has seen some red this week, the bigger picture remains intact. Let’s zoom out and make sense of the current correction.
🔸 TOTAL Market Cap (left chart)
The structure remains overall bullish, trading inside the red rising channel.
After a solid rally, the market is currently pulling back toward a strong demand zone – perfectly aligned with the lower trendline. This area is likely to act as a major support, from which the next bullish impulse could kick off.
🔸 USDT Dominance (right chart)
USDT.D remains overall bearish, trading inside the red falling channel.
It’s currently pushing higher toward a well-defined supply zone, which also intersects with the upper red trendline. As long as this area holds, we expect sellers to take over again — giving altcoins the space they need to bounce back.
📌 In simple terms:
The market is in a healthy correction. Don’t let short-term dips shake your long-term view. The trend is still your friend.
➡️ As always, speak with your financial advisor and do your own research before making any investment decisions.
📚 Always follow your trading plan => including entry, risk management, and trade execution.
Good luck!
All strategies are good, if managed properly.
~ Richard Nasr
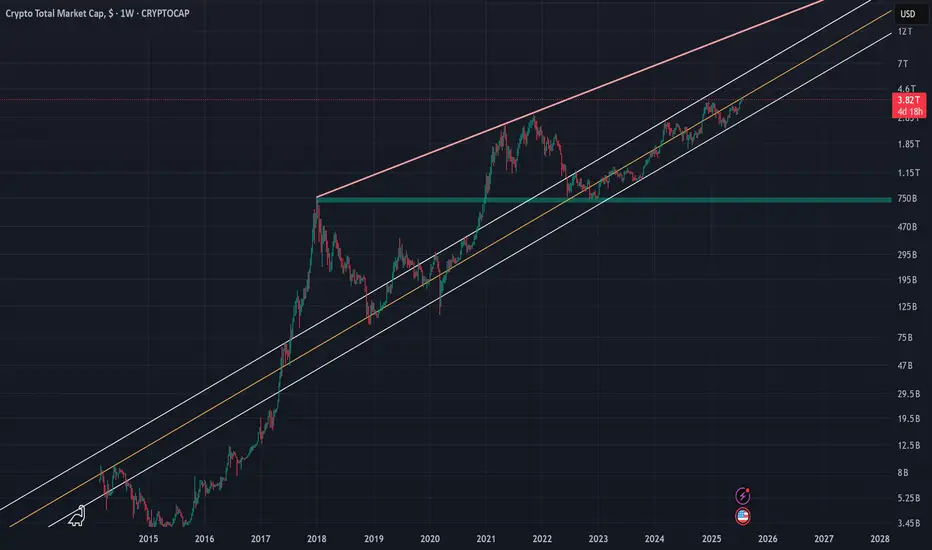
Crypto Total Market Cap (TOTAL) | 1WThe crypto market cap represented by the symbol TOTAL can be considered the most important index for analyzing the cryptocurrency market, although I believe that analyzing Bitcoin itself, given its strong positive correlation with the TOTAL index, would yield similar results. In the attached image, the red line actually indicates the overall resistance level of the symbol, and the drawn parallel channel illustrates the current upward trend of the TOTAL symbol, which is now on the verge of encountering its round resistance at 4 trillion dollars. While we should expect a correction around this level, breaking through the 4 trillion dollar resistance could likely lead to a market cap of 6 to 7 trillion dollars in the next phase. On the other hand, with support at 2.4 trillion dollars based on the 100-week SMA on the weekly timeframe, the 750 billion dollar level—marked by a green zone in the image—can still be considered the most important long-term market support, even before the fifth halving.
I will try to continuously update this analysis of the TOTAL symbol according to market changes and developments. Also, I welcome reading your critiques and comments, so don’t forget to leave a comment!
DeFi’s Make-or-Break MomentThe spotlight today is on TOTALDEFI, an index that could become one of the most exciting charts in the crypto market.
While many altcoins look heavy under selling pressure, TOTALDEFI is holding firmly at the 61.8% Fibonacci support near 116B. This zone is often a turning point where strong reversals begin. If the level continues to hold, we might see a 20% move to the upside, signaling renewed strength in the DeFi sector.
This price action could be a sign that decentralized finance projects are ready to lead the next market phase.

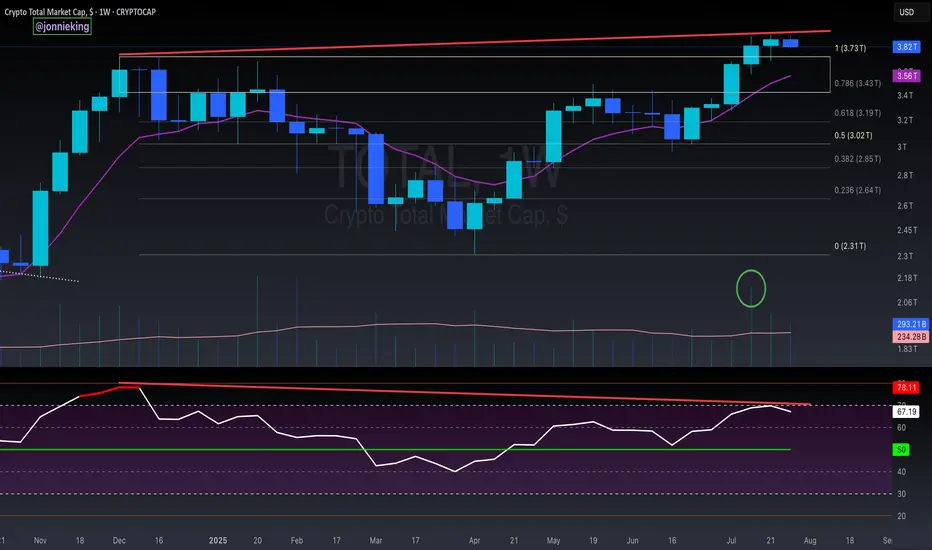
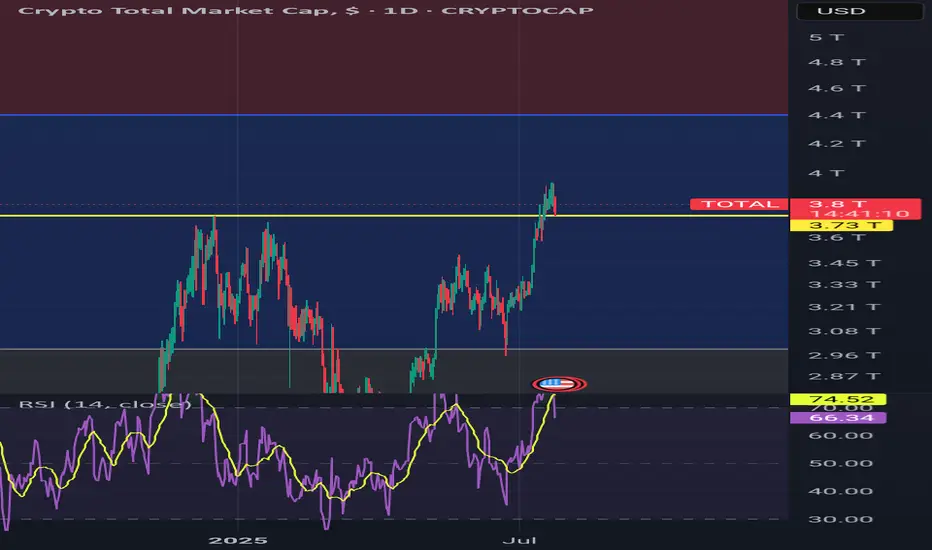
$TOTAL Market Cap Highest Weekly Close - Bearish Divergence?!Once again, highest Weekly Close on the Crypto CRYPTOCAP:TOTAL Market Cap ever.
PA continues to trend above the EMA9 and POI.
It’s worth noting Bearish Divergence on this local level.
I do not believe this is much to worry about however and have discussed this in prior analysis which I will post in the comments.
Strong Volume has shifted in the Bulls favor.
Bulls want to keep PA above $3.7T
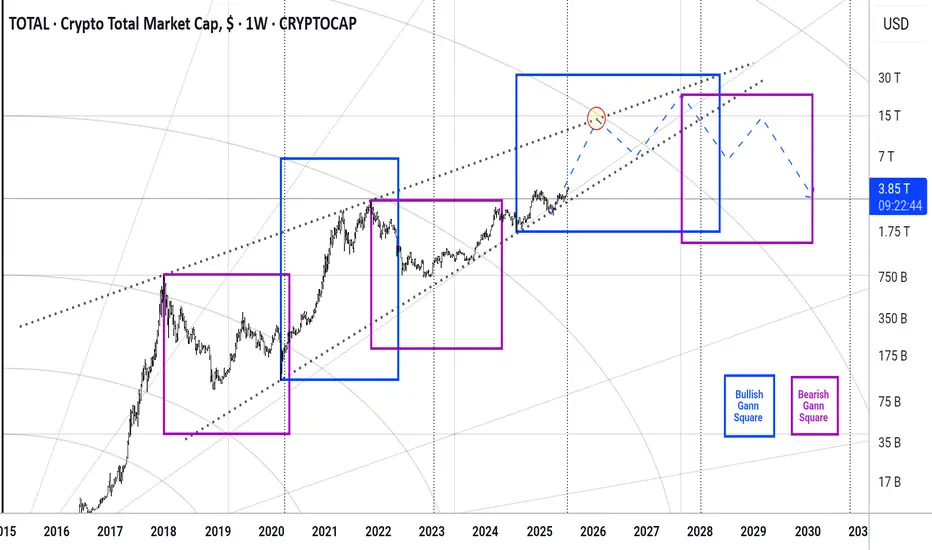
Total #002 ( Look at the Future !!! )Hello dear traders.
Good days.
First of all thanks for your comment and support.
---------------------------------------------------
In beautiful rising wedge of total market cap , the total market in this month broken 0.5 monthly Gann Square price level which means will be ready for test and retest 0.618 for final round befor market collapse.
With refer to the daily Bullish Gann Square ( Blue Square ) and Bearish Gann Square it is expected to within a year market will grow fast .
Safe trades and good luck.
BackTest should be COMPLETEDLet's see what comes next , rally to new ATH ? maybe some other corections along the way , or another wick close to bottom to scare thenpaper hands ? 🤔
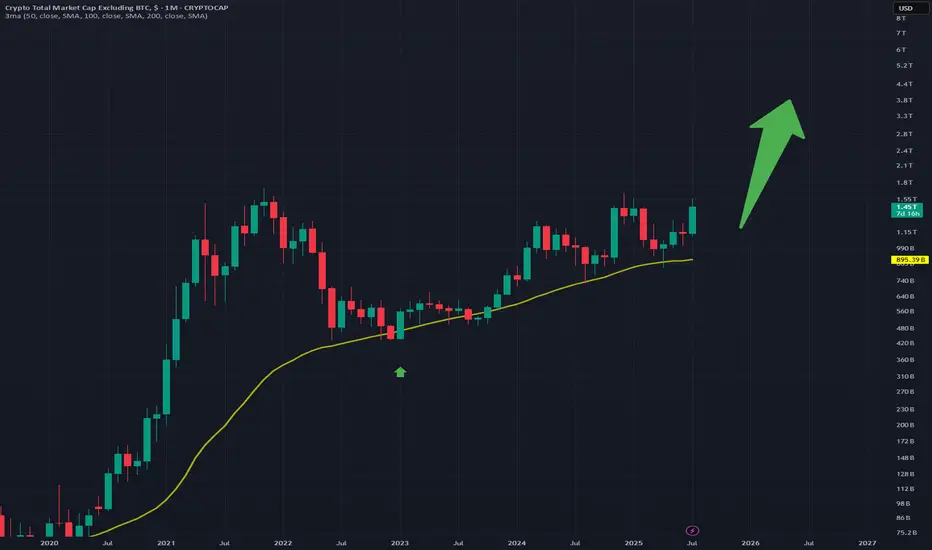
Strong Breakout for AltsBig breakout for the altcoins on this chart
It seems the bull market is starting, right now i think that XRP is the front of this race.
Great buy right now on this weekly
The SqueezeWhile it is logical to assume that the bulls are the ones about to get squeezed, I am going to be a contrarian and bet on the SHORTs getting liquidated, big time.
Good afternoon my fellow Cryptocurrency trader, how are you feeling this Saturday?
Every now and then, every once in a while the market enters a fight between down and up. When tensions rise, when people become anxious, when greed is strong, that's the time for a market squeeze to develop.
Seeing how good Bitcoin is doing, the strong Ether advance, how the altcoins are moving ahead and the rest, it is easy to rationalize that the market will squeeze all the over-leveraged LONG traders. I will repeat myself again, this is a SHORT squeeze.
Let's wait and see. Prices are going up. 1 Billion in liquidations coming next.
Let the bears run. Let's us start a mini bull-run phase.
Namaste.

The Correction Is Over! Bull FlagThe bull flag is a popular pattern. Everybody who has seen a chart is familiar with this pattern. It is a continuation pattern.
When I say that the correction is over I am not talking about the short short-term, I am talking about the bigger picture.
Yes, bullish action is expected to start and intensify within weeks, no!, days. But still, with thousands of projects, it takes lots of time before energy (money) reaches all sectors of the market. Allow for strong variations but the correction is over which means growth.
The correction is over means that the low is already in for most pairs and will be in, in the coming days for all remaining pairs.
The correction is over means that everything will grow, just as it did after the 7-April bottom low. The difference is that this new wave will be many times bigger and stronger than before.
TOTAL2 produced an advance from early April until late May. The retrace produced a bull flag continuation pattern. The pattern has run its course, it will resolve with a new phase of growth. It won't take long. It will be obvious in a matter of days. No need to pray, Crypto is going up.
Namaste.

Crypto Market Update – July 14th🔷Market Update – July 14th: Another Winning Move 🧠🔥
Another week, another breakout – and we’ve been tracking it every step of the way.
💸 Entries? Perfect.
✅ Targets? Hit.
🧠 Psychology? Nailed.
Today, we reached 122,795 , hitting a key target with precision. From there, we took partial profits — and are now watching the next leg toward 127K+ .
We’ve had 4 amazing entries lately, all executed with structure, risk control, and vision.
Today’s move? Just the latest in a series of well-calculated trades.
📉 Support now rests at 120,500 , with deeper support still valid around 114,921 .
This isn’t just a lucky guess — it’s the outcome of following levels, structure, and behavior.
But if you want to go deeper into what’s really happening beneath the surface ...
📊💸 Read the NEW Deep Dive Part III:
The Next BIG Whale Play Unfolds →
Inside it:
🐳 How the bear trap is being set
🧠 Why this is a disbelief rally
⚠️ Why shorting now = adding fuel to the fire
💥 And why this may be the first leg of a much bigger run...
Stay sharp. Stay structured. Stay ahead.
One Love,
The FXPROFESSOR 💙
Disclosure: I am happy to be part of the Trade Nation's Influencer program and receive a monthly fee for using their TradingView charts in my analysis. Awesome broker, where the trader really comes first! 🌟🤝📈
📊💸 And don’t miss Deep Dive Part III – The Next BIG Whale Play Unfolds:
