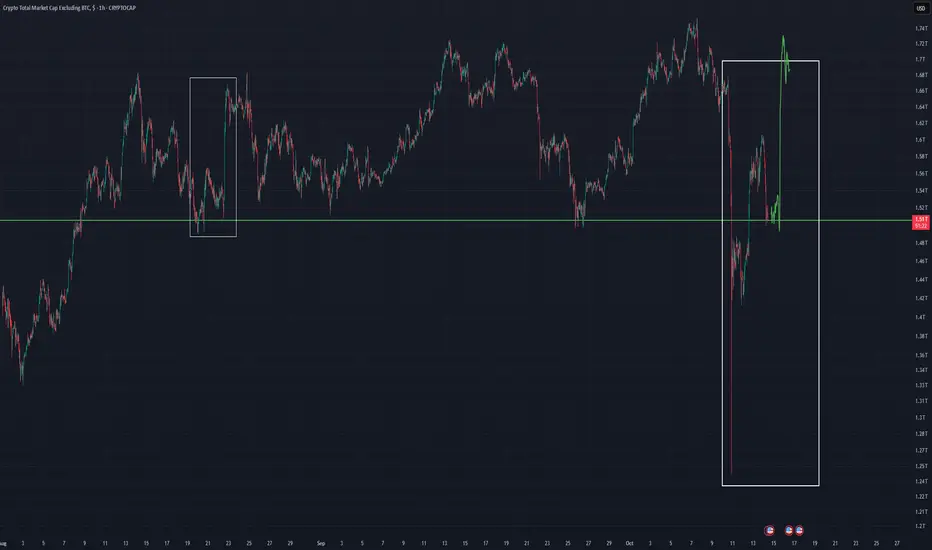
TOTAL2 - Recovered Support An hourly chart for Total2 suggesting price has recovered a horizontal support and may double bottom along this area
A potential bull reversal scenario on this timeframe (hourly)
Lets see what happens
TOTAL2
TOTAL2 - Up Channel An up channel on the daily timeframe for the altcoin market or TOTAL2
Right now price is pressing the middle of the channel which could break to the upside and test the top of the channel again.
Simple Channel analysis

total2+total3 VS. bnbSame scenario, same journey Altcoins following BNB lead
BNB broke through the 2021 ATH resistance and supply zone, completed the retest phase, and started its own bull run.
Now, a similar pattern is forming on the Total2+Total3 chart.
The altcoin market is also in the 2021 peak zone, just like BNB, meaning it's in the final stage before a breakout.
The technical roadmap followed by BNB gives a strong indication of the potential direction for altcoins.
Same technical structure, same momentum... different chart, same goal.
The macro picture is clear.
BNB has started its run.
Altcoins are next.

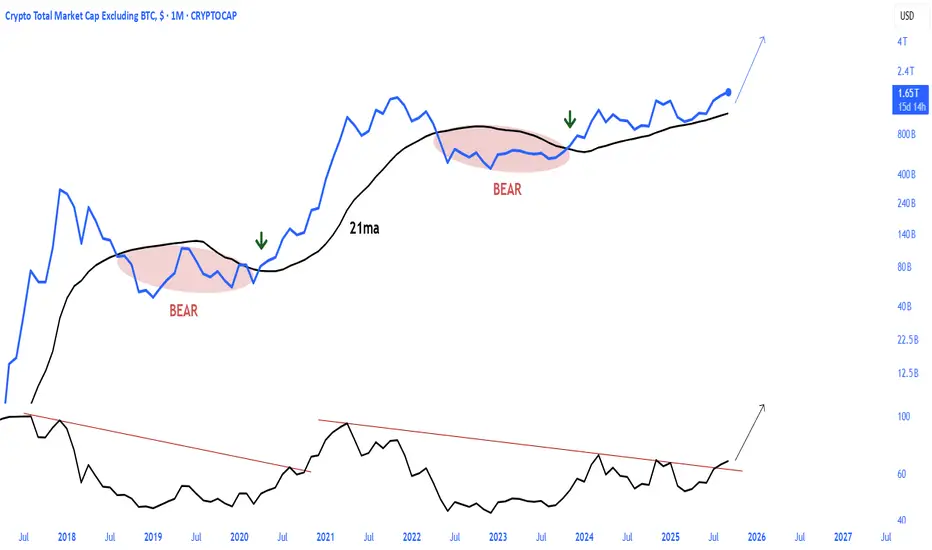
Total2 \ Altcoins The Big picture hasn't spoken yet.
Short term fear and noise cannot overshadow the upward trend in the long term.
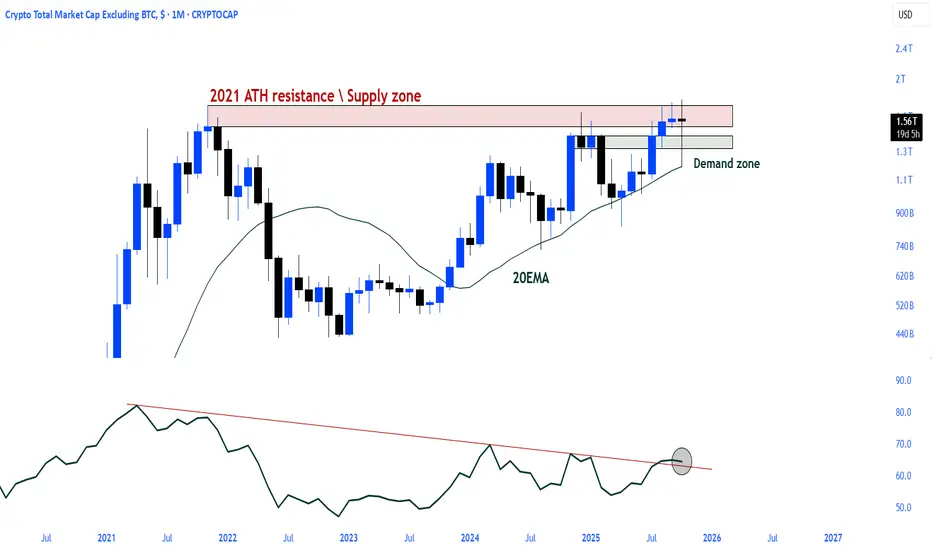
The 1M chart still shows a bullish trend.
The 2021 ATH resistance and major supply zone were tested in November 2024 but rejected. Following this rejection, the market entered a broad correction phase.
The subsequent recovery saw the price retest the 2021 ATH level but was rejected once again.
Nevertheless, the retest of the demand zone formed after November 2024 and the EMA20 region indicates that the structure remains strong.
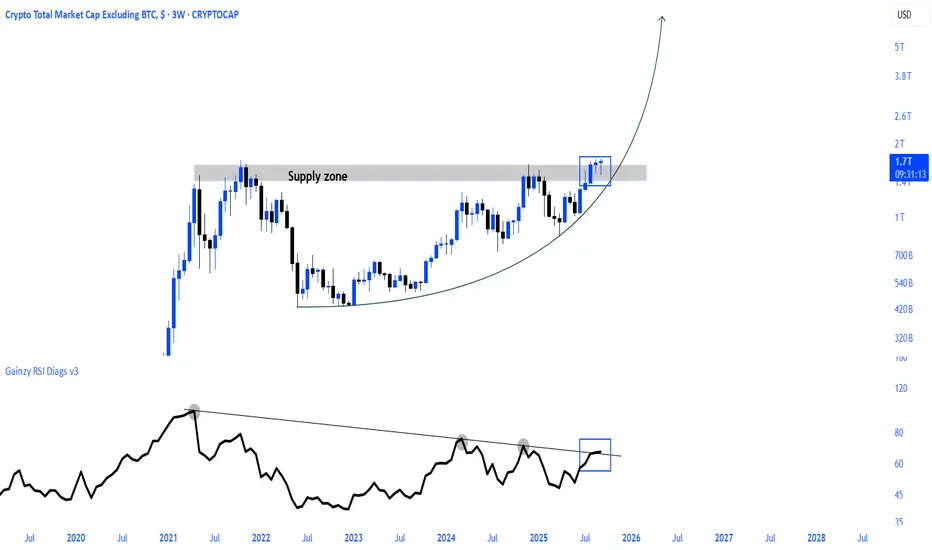
Just before the Altseason.The big picture is becoming clearer in the TOTAL2 and TOTAL3 charts.
The upward trend that began from the 2022 lows has finally reached the critical resistance/supply zone and is gathering strength in this area.
A breakout from this zone and sustained movement above it will trigger a parabolic expansion wave for altcoins.

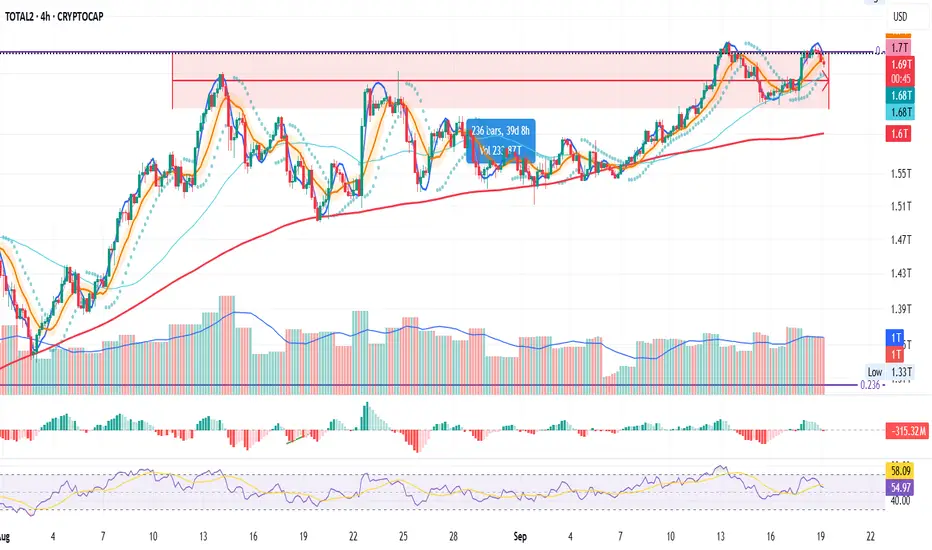
TOTAL2 - Break Out of Curved Channel Price has been moving up along this channel for awhile now and it is now time to break out of it.
This is the 4Hr chart for the altcoin market. A similar pattern occurred on same chart months ago and the bars pattern (in green) is the result of the curved channel breakout.
Lets see what happens.
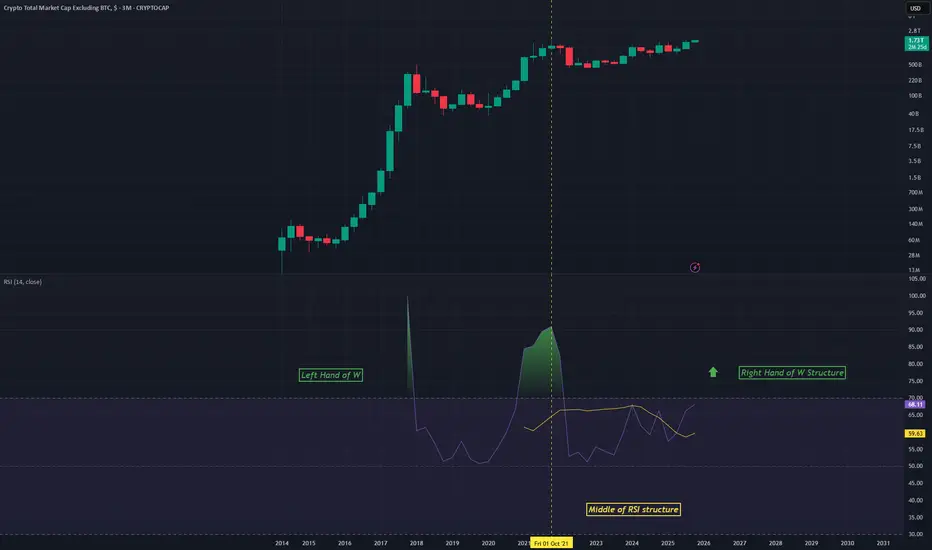
TOTAL2 - RSI StructureAn idea using the RSI on the Monthly chart for TOTAL2
A sort of W pattern is forming on the RSI
We are about to experience the right hand of this W structure which is a bullish phase
Long big altcoins
TOTAL MARKET CAP EXCULADING BTC, ETH! TOTAL3 tracks the combined value of all altcoins, excluding BTC and ETH.
The $1.16T level has long acted as a ceiling for alts every rejection there signaled weak capital flow into the broader market.
Now that we've closed above it, it suggests renewed capital rotation into altcoins and rising market confidence.
If TOTAL3 holds above $1.16T, expect continued expansion: stronger trends, more breakouts, and improved liquidity.
If it slips back below, the breakout fails and altcoin momentum fades until buyers return.
In short: above $1.16T = bullish altcoin flow. Below it = risk-off mode.
DYOR, NFA

TOTAL2 & ETH – On the Edge of Price DiscoveryTOTAL2 & ETH – The Next in Line for Price Discovery
Today, TOTAL2 has officially broken above its previous all-time high, while ETH is still just below it, getting closer with each daily candle.
This tells an interesting story: altcoins as a whole have already entered price discovery, but ETH being the largest component of TOTAL2, hasn’t quite joined yet. This usually means one of two things: either smaller-cap altcoins are currently outperforming ETH, or ETH is simply building strength for a delayed breakout, a move that often pulls the entire market even higher once it happens.
Still, confirmation matters: TOTAL2 needs a daily close above its ATH, while ETH’s reaction around its own ATH in the coming days will likely decide whether it joins the move.
And let’s not forget: we’ve just entered Q4, and this one might be the strongest Q4 the crypto market has ever seen. Everything that once stood against crypto, from regulation to sentiment, is now turning in its favour, across the US, Asia, and even Europe.
That’s why I believe ETH will soon follow TOTAL2 into price discovery, potentially marking the start of the next major leg up for the entire market.
Bias:
Bullish! TOTAL2 confirmed breakout, ETH close behind. Q4 momentum could be the catalyst that sends both into new territory.
Always take profits and manage risk.
Interaction is welcome.

Altcoins VS. SilverSimilar technical structure in two different markets
Price and RSI are breaking above the major resistance level together.
Altcoin market cap (Total2) and silver chart, with the same supply zone and RSI breakout pattern, show a structural bullish signal.

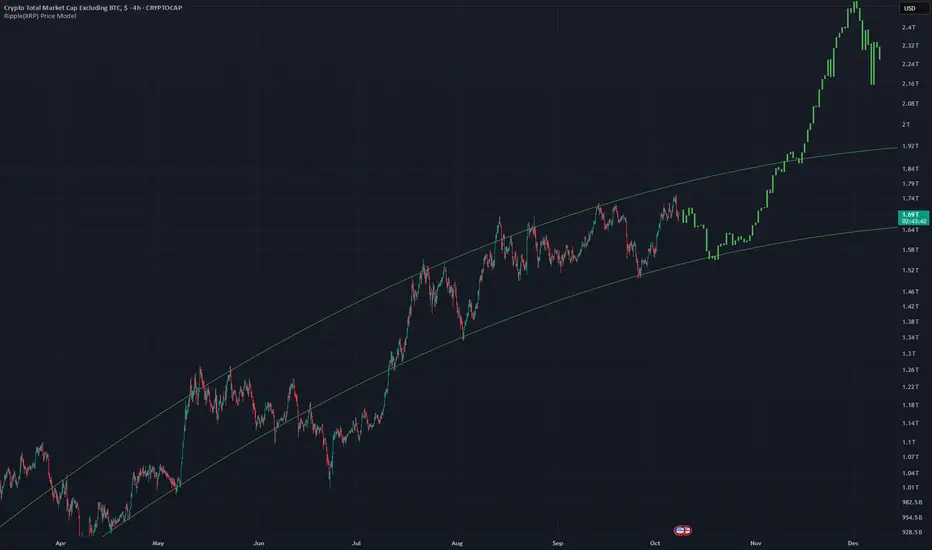
Altcoins Season \ Total2
The Altcoins market cap (TOTAL2) is on the verge of a parabolic breakout.
TOTAL2 has reached a critical threshold,
the Altseason is about to ignite.
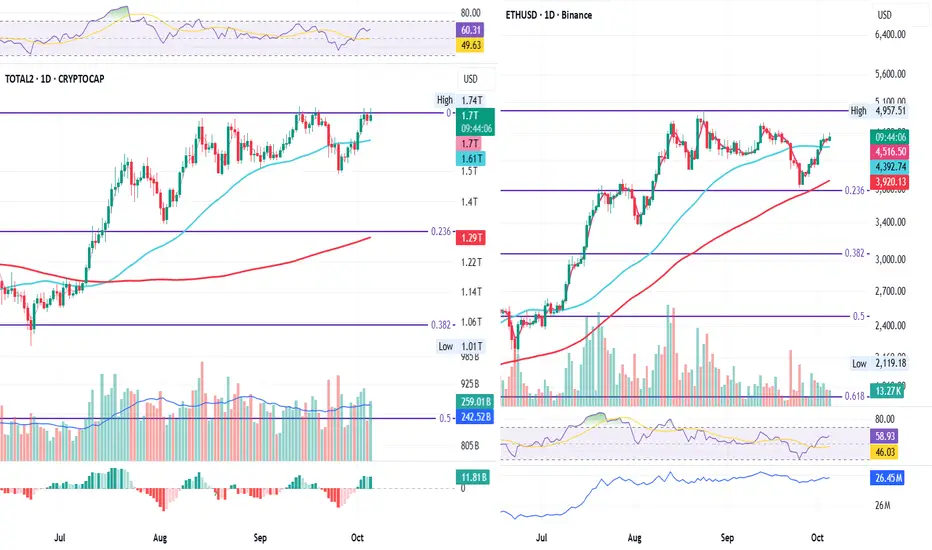
TOTAL2 Battles ATH While ETH Lags BehindTOTAL2 & ETH Daily – Testing the Edge of Structure
On the daily chart, TOTAL2 and ETH are showing a slight divergence.
TOTAL2 is battling its all-time high, while ETH is lagging slightly, hovering just above the 50MA.
If ETH manages to hold this level, it could build strength for another attempt at the highs. But if it loses the 50MA, this current high might turn into a lower high, risking a short-term break in bullish structure.
Today’s close will be key, it might offer the first clue about where momentum wants to flow next.
Key Notes:
TOTAL2 retesting all-time high
ETH consolidating over the 50MA
A hold could fuel another push up
A break below risks a lower high formation
Daily close likely to set short-term direction
Bias:
Cautiously bullish, structure holds, but confirmation depends on ETH defending the 50MA.
Always take profits and manage risk.
Interaction is welcome.
Altcoins Index TOTAL2 and TOTAL3 are on the verge of a major breThe major resistance level that has persisted for almost 4 years since the 2021 ATH in two pairs is also on the verge of breaking the supply zone.

Has the Toxicity of Ethereum been seen? Charts never Lie
It really is as simple as that
THESE ARE THE DAILY TOTAL CRYPTO MARKET CAP CHARTS
Top line - TOTAL Crypto Market Cap - TOTAL 2 (Excluding BTC )
Bottom Line - TOTAL 3 ( Excluding BTC & ETH ) - OTHERS ( Top 125 coins minus Top 50 by market cap )
TOTAL 3 is ALL ALT coins
OTHERS is Mid to Lower Cap ALT coins
These 4 Charts use the VRVP
the Volume Profile Visible Range (VPVR), is a technical analysis indicator on TradingView that displays the distribution of trading volume at different price levels within the currently visible range of a chart.
The Colour Key is below
Value Area High ( VAH ) - Yellow Dashed Line
Value Area Low ( VAL ) - Red Dashed line
Point of Control ( POC ) - Red Dotted line
Developing POC - Blue Dashed line
Developing Value Area - Purple Dotted line
The Thing to note here is how EVERY TOTAL chart is above its own Value Area High EXCEPT the TOTAL 2 Chart
TOTAL 2 is all Crypto except BTC, so it is not BTC holding this back.
The TOTAL 3 chart , that is Everything except BTC and ETH. is above its own Value area High, nothing holding it back.
This clearly shows that ETH is the Stagnant Crypto token here.
We could start talking about how the SEC refused to state if ETH was ever a security in the days gone past, in the Dark and murky world of pre regulation. How ETH was adopted by the USA as "Its own Crypto". How ETH is NOT decentralised because the more you have, the more "Voting" rights you have. How FTX used ETH in its bribery attempts.
Many consider the ETH to have been the 2nd Crypto to arrive after Bitcoin...This is not the case.. LITECOIN was the 2nd....ETH came many years later.
Anyway..The charts say it all..
ETH is not being asopted really......and compared to BITCOIN.....
The ETH BTC chart also says it all
It has recovered a little But has NOT broken the long term resistance
The Next few weeks are Critical for the Toxic Token.
There is room to ETH to recover and it will likely break that line of resistance but there are certainly better returns and projects to invest in.

BITCOIN DOMINANCE has BROKEN DOWN Initially, we have a head and shoulders pattern that has yet to reach its target.
Additionally, there is a significant breakdown from a broadening ascending wedge.
Expanding wedge formations exhibit increasing volatility as they develop.
These ascending broadening wedge chart patterns emerge during uptrends, signalling trend continuation with higher highs and higher lows, often touching the upper and lower boundary lines of the wedge.
When the head and shoulders pattern was formed, it FAILED to reach the upper boundary.
This suggests a exhaustion of the uptrend.
The activation of the head and shoulders confirmed that a reversal was underway.
Now, we are witnessing the breakdown of the wedge, followed by back testing, which confirms the weakness of #Bitcoin compared to the #ALTS, particularly #Ethereum, of course.
I still believe that Bitcoin has higher price targets that will be achieved, so I remain optimistic about BTC.
If you own Bitcoin, it would be wise to stay with that asset and avoid getting caught up in the extreme volatility of alt coins.
For those of us who have been battling and enduring in the trenches over the past few years, the opposite holds true.
We CANNOT give in to Bitcoin maximalism at this point in the game!
This is our Time!

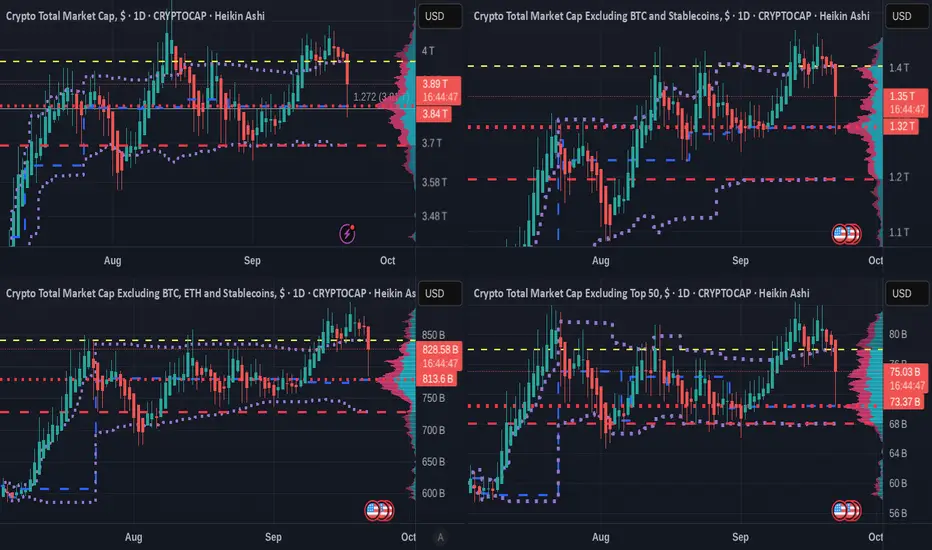
4 X Crypto TOTAL charts and VRVP show DO NOT PANICTHESE ARE THE DAILY CHARTS
Top line - TOTAL Crypto Market Cap - TOTAL 2 (Excluding BTC )
Bottom Line - TOTAL 3 ( Excluding BTC & ETH ) - OTHERS ( Top 125 coins minus Top 50 by market cap )
TOTAL 3 is ALL ALT coins
OTHERS is Mid to Lower Cap ALT coins
These 4 Charts use the VRVP
the Volume Profile Visible Range (VPVR), is a technical analysis indicator on TradingView that displays the distribution of trading volume at different price levels within the currently visible range of a chart.
The Colour Key is below
Value Area High ( VAH ) - Yellow Dashed Line
Value Area Low ( VAL ) - Red Dashed line
Point of Control ( POC ) - Red Dotted line
Developing POC - Blue Dashed line
Developing Value Area - Purple Dotted line
The MAIN thing to take note of here, is how ALL the charts have come down to the POC ( Point of Control) and then bounced back.
This shows VERY Strong support across the entire Crypto Market, though the lower cap are, as always, More volatile.
The Point of Control (POC) on a Visible Range Volume Profile (VRVP) is the price level with the highest traded volume within the specified time period, representing the price at which the most buyers and sellers interacted, indicating a zone of market equilibrium.
The POC can act as a magnet for price action, with prices often gravitating toward it when they move too far away.
The POC can serve as a key support or resistance level, with price trading above the POC suggesting bullish sentiment and trading below it indicating bearish sentiment.
Traders use the POC to identify potential reversal points, entry and exit zones, and to gauge overall market sentiment
PA Arrived at the POC this weekend and Bounced off it.
It is showing BULLISH signs though we do need confirmation of continuation before we all shout with Koy. The target for conformation is ode PA to reach and pass above the VSH ( Value Area High orange dash)
So, DO NOT PANIC just yet but do remain cautious
TOTAL2 – Altcoin Market Cap (Weekly TF) 2025
**Summary:**
The TOTAL2 chart (crypto market cap excluding BTC) is showing a structurally bullish formation after a deep retracement and a higher low confirmation. This setup suggests a potential multi-phase rally toward 2.98T and beyond, with defined support zones and Fibonacci targets aligned with liquidity cycles. This analysis visualizes the expected roadmap based on trend-based Fibonacci extensions, retracement levels, and psychological market phases. Notably, the outlook includes the possibility of an initial correction to retest strong support zones before the market begins its ascent.
**Chart Context:**
TOTAL2 represents the aggregated market capitalization of all crypto assets excluding Bitcoin. Historically, it reflects capital rotation into altcoins, especially following BTC dominance peaks. The current chart shows strong reaccumulation above the 1T support zone, with Fibonacci confluences hinting at a sustained recovery pattern. Dotted arrows illustrate a wave-like projection of accumulation, rally, retracement, and expansion. The possibility of a near-term correction to lower support zones is also embedded in the path structure.
**Key Technical Observations: and Levels**
TP1 = 1.78T
TP2 = 2.05T
TP3 = 2.4T
TP4 = 2.85T
* **Secondary Fib Retracement :** 0% = 1.23T, 100% = 425.89B
* Key zones: 23.6% = 1.04T, 38.2% = \~840.42B, 61.8% = \~569.41B
Possible Support Levels: 1.04T, 930B, 840B, 766B, 735B,
* **Trend-Based Fib (A-B-C):** A = \~420B, B = \~1.23T, C = \~735B
* This projection aligns with TP1 at 1.78T
* **Support Area:** Around 1T psychological zone (930B)
* **Strong Support Zone:** 735 Bto775B
* **First Target Zone:** Between 1.73T and 1.89T (early resistance + Fib cluster)
**Indicators:**
* Weekly structure forming higher lows
* Long-term Fib retracements respected
* Trend-Based Extension projecting 1.618 move
* No divergence, confirming strength
**Fundamental Context:**
* Liquidity conditions are improving globally with rate cuts expected into late 2025.
* ETH and ecosystem tokens are likely to lead altcoin recovery.
* Regulatory clarity and ETF flows add legitimacy to broader crypto allocations.
* Historical alt-seasons emerge from BTC profit rotation—TOTAL2 leads that shift.
* However, several macro risks may trigger a correction before rallying:
* The Crypto Fear & Greed Index is currently high, suggesting overbought conditions.
* Macroeconomic uncertainties (e.g., inflation, rate hike fears) can suppress short-term risk appetite.
* Regulatory tightening across major jurisdictions introduces hesitation in capital deployment.
* Technical signs of a five-wave drop in BTC hint at a larger ABC correction scenario.
* DAT (Digital Asset Treasury) exposure among public firms may lead to forced liquidations during downturns.
**Philosophical or Narrative View:**
This is not just a market cycle—it's a reflection of decentralized innovation reclaiming narrative dominance. After fear-induced lows, TOTAL2's rise echoes the resilience of builders, protocols, and investor conviction. Each Fibonacci level acts like a checkpoint in the unfolding story of crypto's evolution beyond Bitcoin.
**Related Reference Charts:**
*
**Bias & Strategy Implication:**
* **Bias:** Bullish with short-term corrective risk
* **Accumulation Zone:** 1.0T–1.23T
* **Initial Risk:** Price may revisit the **Support Area (1T)** or even the **Strong Support Zone (775B–725B)** before a sustained move higher.
* **Partial TP:** 1.78T–2.05T
* **Extended TP:** 2.4T–2.98T
* Caution near TP4–Bonus zones as distribution risk increases
* Invalidated if closes below 725B (structure break)
**Notes & Disclaimers:**
This is a structural macro outlook and not financial advice. Markets are dynamic and subject to rapid shifts in sentiment, liquidity, and regulation. Always use risk management.

Altcoins season...Altcoins are loading up for a major upward wave.
The Altseason is approaching step by step.

ETH SERIES | Part 5 – TOTAL2 (4H)
Last 40 days:
TOTAL2 (altcoins excl. BTC) looks slightly stronger than TOTAL1.
This suggests BTC might be dragging the broader market down.
Still, ETH looks weak relative to other alts like SOL.
Conclusion: both BTC and ETH may be holding the market back.
Next stop → TOTAL3 to see if altcoins are making up for that weakness.
Always take profits and manage risk.
Interaction is welcome.
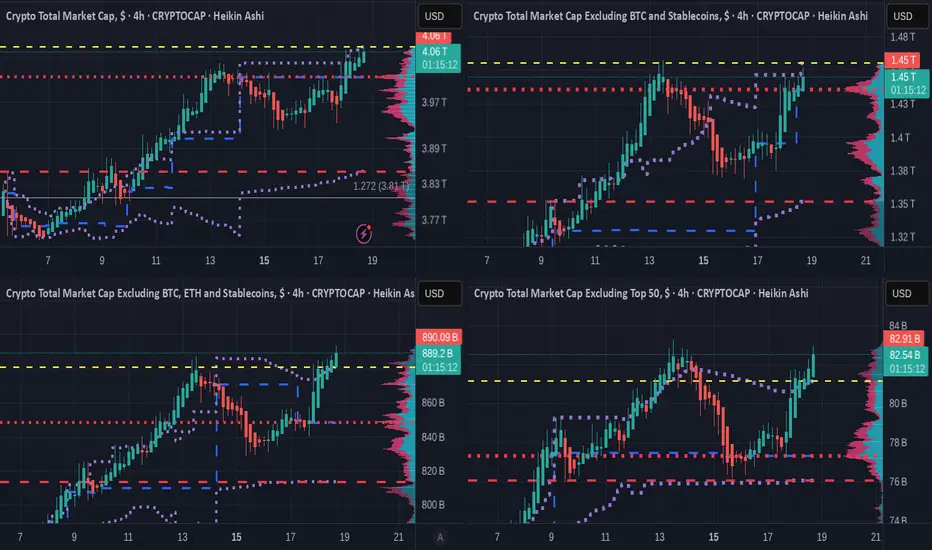
4 X Crypto TOTAL charts showing who is leading the packTHESE ARE THE SHORTER TERM 4 HOUR CHARTS
Top line - TOTAL Crypto Market Cap - TOTAL 2 (Excluding BTC )
Bottom Line - TOTAL 3 ( Excluding BTC & ETH ) - OTHERS ( Top 125 coins minus Top 50 by market cap )
TOTAL 3 is ALL ALT coins
OTHERS is Mid to Lower Cap ALT coins
These 4 Charts use the VRVP
the Volume Profile Visible Range (VPVR), is a technical analysis indicator on TradingView that displays the distribution of trading volume at different price levels within the currently visible range of a chart.
The Colour Key is below
Value Area High ( VAH ) - Yellow Dashed Line
Value Area Low ( VAL ) - Red Dashed line
Point of Control ( POC ) - Red Dotted line
Developing POC - Blue Dashed line
Developing Value Area - Purple Dotted line
The first thing to see is simply that OTHERS has a higher gain than any..
ALT SEASON is here but be VERY Cautious about how long this may last...
IT MAY NOT LAST long.....we MUST watch daily to see what is happening.
Because BTC is poised and ready able to move at any time and when it happens, usually Stops ALTS in their tracks.
Watch the Bitcoin Dominance chart
As you can see, we are in the Zone for a Bitcoin ATH in the next few months.
Be Cautious
So, currently, we have the TOTAL chart just coming up to the VAH. This may prove to be resistance in which Case ALTS may run longer. However, the POC just below could prove to be enough support to push PA above that VAH on a 2nd attempt, IF that is required.
TOTAL 2 is below but rising and the same may apply to the POC just below.
However, the TOTAL 3 and OTHERS are already above the VAH line and so have a clear road ahead but when this fails, the POC sipport is a LONG way below.
This is early days of reaction to the FED 25 point Drp [ and so we need to remain cautious as to the Trend that has yet to prove itself..
But things do look good.....
MARKET READY TO RISE $TOTAL2After almost 4 years TOTAL2 now with the generational breakout and price discovery (!!)
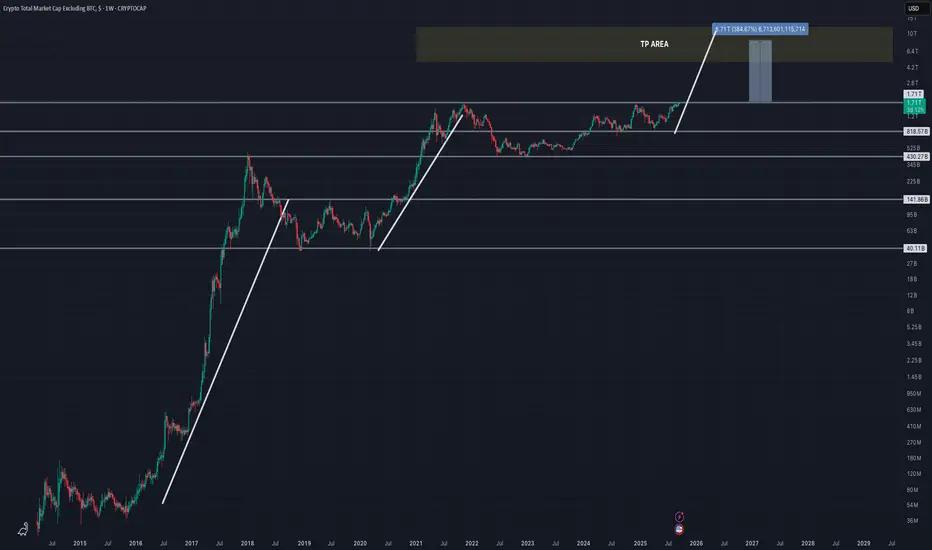

Altcoins with parabolic run coded.
Altcoins have not yet experienced the parabolic run that will generally turn into Altseason.