$OTHERS possible scenariosIt’s decision time for CRYPTOCAP:OTHERS , arguably the most accurate index to gauge the true altcoin market.
We’re now testing the $220 billion level, a critical support zone.
From here, two paths emerge:
either we bounce and start a meaningful trend reversal,
or we break down and revisit the wick from October 10, 2025.
Either way, altcoins may have to bleed a bit more before finding stability.
A massive head-and-shoulders pattern is clearly taking shape — and its theoretical target is near zero (no joke).
If this setup isn’t invalidated soon, we could be heading toward a major correction.
Let’s hope the $220B neckline holds strong.
If it fails, we might be watching the crypto equivalent of the dot-com crash — a potential black swan in the making.
Interestingly, the previous cycle also formed a similar head-and-shoulders pattern pointing to zero.
In reality, the downtrend bottomed out around $82 billion, not zero — so let’s hope history rhymes rather than repeats.
This time, the bad scenario suggests a bottom near $160 billion, which could mark the final stage of the altcoin bear market.
DYOR
#Altcoins #CryptoMarket #OTHERS #CryptoAnalysis #Bitcoin #Ethereum #CryptoCrash #HeadAndShoulders #MarketAnalysis #CryptoTrading #AltcoinSeason #TechnicalAnalysis #CryptoInvesting #BearMarket #CryptoNews #BTC #ETH #CryptoCycles #TradingView #MarketUpdate
Total3

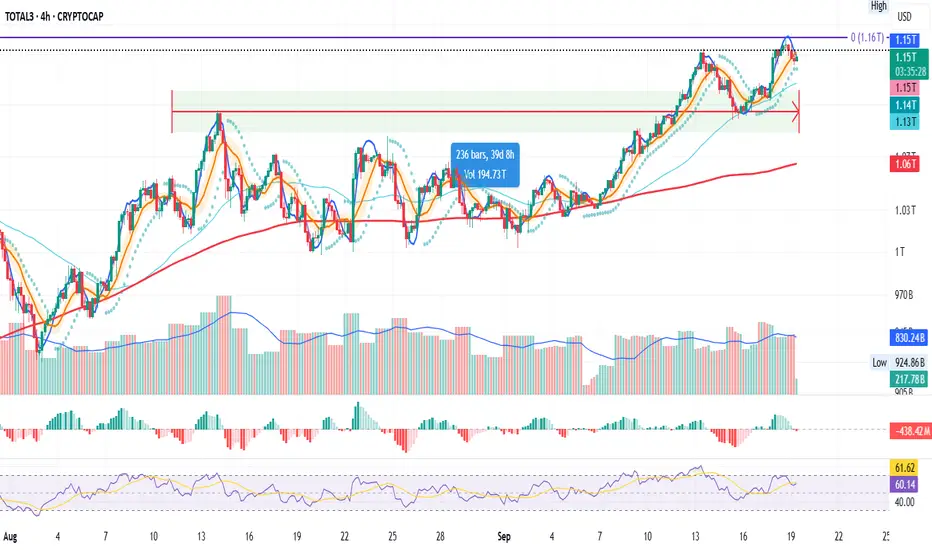
TOTAL 3 Analysis (1D)The TOTAL3 chart is currently retesting a key diagonal trendline that was broken previously. This is a classic bullish retest scenario.
If the current daily candle closes green, and is followed by a strong impulsive candle without invalidation, it could signal the start of a new leg upward, right from this zone.
The $900B market cap level remains the key support.
As long as TOTAL3 holds above this threshold, the bullish bias remains intact.
This structure could lead to momentum across the altcoin market.
total2+total3 VS. bnbSame scenario, same journey Altcoins following BNB lead
BNB broke through the 2021 ATH resistance and supply zone, completed the retest phase, and started its own bull run.
Now, a similar pattern is forming on the Total2+Total3 chart.
The altcoin market is also in the 2021 peak zone, just like BNB, meaning it's in the final stage before a breakout.
The technical roadmap followed by BNB gives a strong indication of the potential direction for altcoins.
Same technical structure, same momentum... different chart, same goal.
The macro picture is clear.
BNB has started its run.
Altcoins are next.

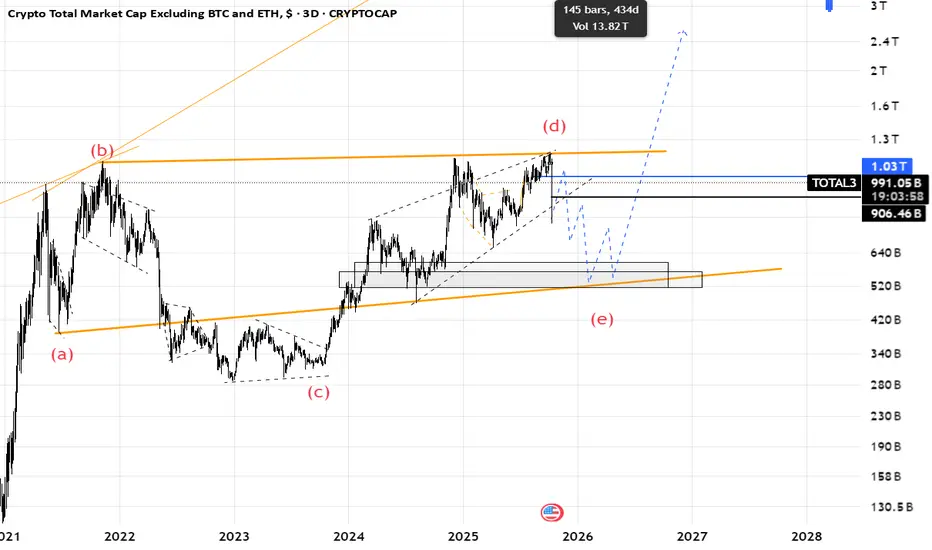
Total3(based on NEo wave)I thought wave (e) is finised but I was wrong.
now I think its the start of wave (e) and we should afraid of altcoins.
when wave (e) is finished altcoins will start to pump.
every upward is a chance to sell.
there is another scenario that I will share it on next post.
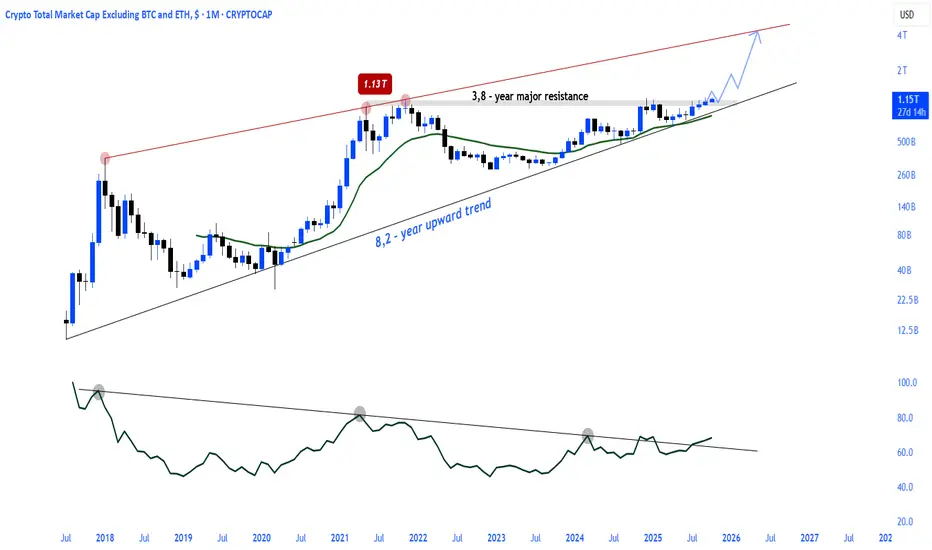
The Altcoins Momentum Period Begins.- Almost 4-year major resistance and breakot
- Major breakout in RSI
- 8,2 -year rising trend
Altseason 🔃💹
TOTAL3 · Breakout or Fakeout · Where’s the Money Going Next?Everyone keeps saying “altseason is here,” but when you actually look at CRYPTOCAP:TOTAL3 , it doesn’t feel like that at all.
Back in 2018, CRYPTOCAP:TOTAL3 - the total market cap excluding Bitcoin and Ethereum, is in price discovery with no resistance above.
But let’s be real, this breakout feels different this time. Volume isn’t surging like it did in 2021, and the candles show hesitation. That means capital is flowing, but it’s not flowing aggressively. Smart money’s rotating, not chasing.
Altcoins as a whole aren’t exploding too, only a few names like CRYPTOCAP:BNB or BINANCE:SOLUSDT ecosystem tokens are showing strength. The rest are flat or fading.
Meanwhile, CRYPTOCAP:TOTAL TOTAL1, the full crypto market cap, keeps pushing higher, driven mainly by Bitcoin. It measn most of the new liquidity is still being absorbed by BTC rather than spreading across the broader altcoin market.
If TOTAL3 holds above $1.14T for a few more weeks, it’ll confirm the breakout and probably push toward $1.5T in Q4, but trust me "NO MORE ALTCOIN SEASON"
So yeah, we got the breakout everyone wanted, but not the fireworks yet.
Best,
The Crypto Fire
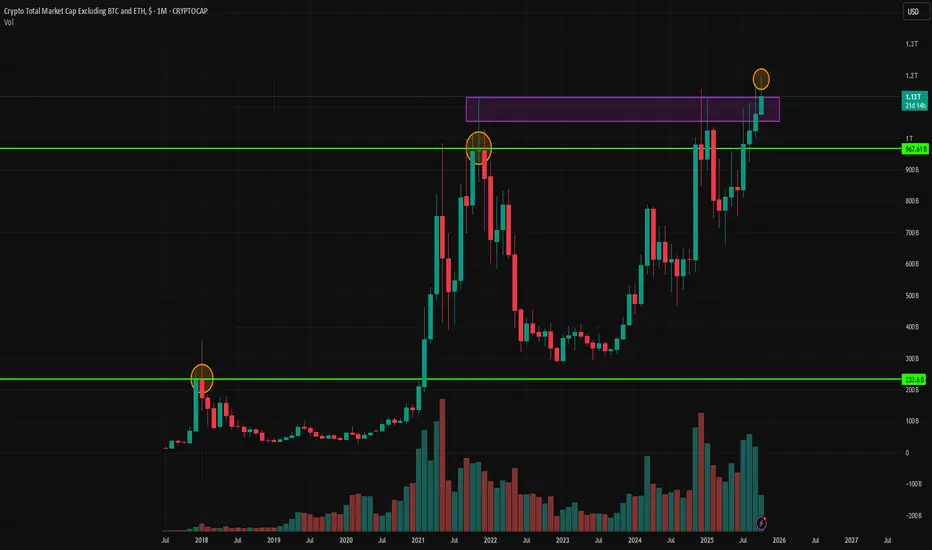
Just before the Altseason.The big picture is becoming clearer in the TOTAL2 and TOTAL3 charts.
The upward trend that began from the 2022 lows has finally reached the critical resistance/supply zone and is gathering strength in this area.
A breakout from this zone and sustained movement above it will trigger a parabolic expansion wave for altcoins.

TOTAL 3 UPDATE !!The TOTAL3 chart is showing some cautionary signs but has not yet broken the key trendline. The price is testing this support level, and a breakout below the trendline will be crucial for determining the next move. Currently, the price is holding above the trendline, but if we see a close below this level, it would signal further weakness in the altcoin market.
Key Levels to Watch:
> The trendline is still intact, but a 4-hour candle close below this could trigger downside pressure.
> The first major support sits around $1.09T. If the price reaches this level and reacts positively, we could see a bounce.
> The next potential support zone is at $1.07T, where more significant buying might come into play.
For now, we remain cautious and need confirmation through price action for any further moves down.
#Altcoins #CryptoTrading

Altcoins are heading toward a parabolic phase.Same setup, same chart, different story, different market
Silver laid the foundation for a parabolic run after breaking through a 3.8-year major resistance level.
The altcoin market cap TOTAL3 similarly broke through a 3.8-year major resistance level.
NASDAQ:ALTS \ TVC:SILVER
Altseason 🔃💹

TOTAL MARKET CAP EXCULADING BTC, ETH! TOTAL3 tracks the combined value of all altcoins, excluding BTC and ETH.
The $1.16T level has long acted as a ceiling for alts every rejection there signaled weak capital flow into the broader market.
Now that we've closed above it, it suggests renewed capital rotation into altcoins and rising market confidence.
If TOTAL3 holds above $1.16T, expect continued expansion: stronger trends, more breakouts, and improved liquidity.
If it slips back below, the breakout fails and altcoin momentum fades until buyers return.
In short: above $1.16T = bullish altcoin flow. Below it = risk-off mode.
DYOR, NFA

BTC smashes 120K, ETH tests 4.5K! Is Altseason finally here?Bitcoin breaks through $120K while Ethereum retests critical $4500 resistance. Our analysis reveals why this "Uptober" rally could signal the start of the biggest altcoin surge since 2021.
🚀 Rally catalysts
US Government shutdown : Dollar weakness from political uncertainty and Fed policy paralysis
"Uptober Effect" : Bitcoin historically averages 20%+ gains in October (currently up 5-6% with 3 weeks remaining)
Institutional flows: $4B+ institutional buying, 850K ETH whale accumulation in past 2 weeks
Q4 seasonality: Crypto's strongest quarter with historical momentum into year-end
📊 Bitcoin Technical Analysis
Pattern : Bullish hidden divergence confirmed with swing high breakout above $118K resistance
Current structure : Potential 5-wave Elliott sequence suggesting final impulse leg
Key levels : Support at $117K (trendline), resistance cluster $122K-$124K
Momentum : RSI recovering, MACD bullish crossover confirms continuation
⚡ Ethereum technical breakdown
Weekly setup : Successful retest and hold above $4K support, pennant/triangle breakout in play
RSI divergence : Bullish divergence confirmed on multiple timeframes, RSI near 60 (room to 70+)
Elliott wave count : Either completing Wave 5 (correction ahead) or early Wave 3 (massive move higher)
Cup & Handle : Measured move target to $6,850 based on long-term pattern
🔥 Altseason indicators - Total3 analysis
Chart pattern : Cup & handle formation on Total3 (altcoins ex-BTC/ETH) approaching ALL-TIME HIGHS
Key level : $1.1T breakout threshold - confirmation needs 3 daily closes above ATH
BTC dominance: Break below 60% support signals potential altcoin rotation
Targets: $1.2T initial, $1.3T extension if breakout sustains
💹 Trading Strategy
ETHEREUM LONG Setup:
Entry: $4,300 on pullback (current: $4,500)
Stop Loss : Below $4,050 (1.618 Fib extension)
Take Profit 1 : $5,200 (2:1 R/R)
Take Profit 2 : $6,850 (measured move target)
Risk Management : Trail stops above breakeven after TP1
Key levels to watch:
Bitcoin : $117K support, $122-124K resistance zone
Ethereum : $4,126 critical support, $4,500 resistance, $6,850 long-term target
Total3 : $1.1T breakout level for altseason confirmation
🎯 Market outlook
October living up to "Uptober" reputation with favourable macro setup. Dollar weakness, institutional flows, and technical breakouts align for potential crypto supercycle. Watch Total3 breakout - if altcoins breach ATH, we could see 2021-style altseason explosion.
This content is not directed to residents of the EU or UK. Any opinions, news, research, analyses, prices or other information contained on this website is provided as general market commentary and does not constitute investment advice. ThinkMarkets will not accept liability for any loss or damage including, without limitation, to any loss of profit which may arise directly or indirectly from use of or reliance on such information.


Altcoins Index TOTAL2 and TOTAL3 are on the verge of a major breThe major resistance level that has persisted for almost 4 years since the 2021 ATH in two pairs is also on the verge of breaking the supply zone.

Has the Toxicity of Ethereum been seen? Charts never Lie
It really is as simple as that
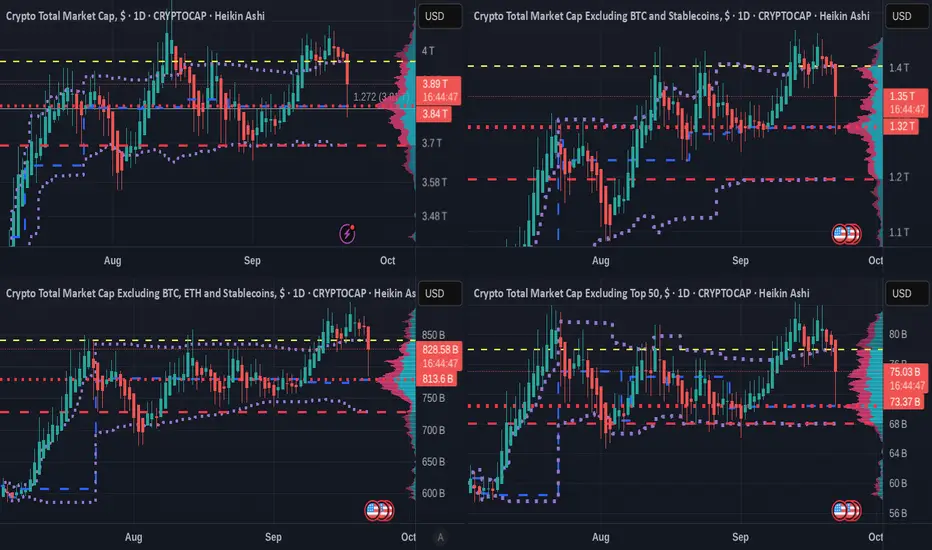
THESE ARE THE DAILY TOTAL CRYPTO MARKET CAP CHARTS
Top line - TOTAL Crypto Market Cap - TOTAL 2 (Excluding BTC )
Bottom Line - TOTAL 3 ( Excluding BTC & ETH ) - OTHERS ( Top 125 coins minus Top 50 by market cap )
TOTAL 3 is ALL ALT coins
OTHERS is Mid to Lower Cap ALT coins
These 4 Charts use the VRVP
the Volume Profile Visible Range (VPVR), is a technical analysis indicator on TradingView that displays the distribution of trading volume at different price levels within the currently visible range of a chart.
The Colour Key is below
Value Area High ( VAH ) - Yellow Dashed Line
Value Area Low ( VAL ) - Red Dashed line
Point of Control ( POC ) - Red Dotted line
Developing POC - Blue Dashed line
Developing Value Area - Purple Dotted line
The Thing to note here is how EVERY TOTAL chart is above its own Value Area High EXCEPT the TOTAL 2 Chart
TOTAL 2 is all Crypto except BTC, so it is not BTC holding this back.
The TOTAL 3 chart , that is Everything except BTC and ETH. is above its own Value area High, nothing holding it back.
This clearly shows that ETH is the Stagnant Crypto token here.
We could start talking about how the SEC refused to state if ETH was ever a security in the days gone past, in the Dark and murky world of pre regulation. How ETH was adopted by the USA as "Its own Crypto". How ETH is NOT decentralised because the more you have, the more "Voting" rights you have. How FTX used ETH in its bribery attempts.
Many consider the ETH to have been the 2nd Crypto to arrive after Bitcoin...This is not the case.. LITECOIN was the 2nd....ETH came many years later.
Anyway..The charts say it all..
ETH is not being asopted really......and compared to BITCOIN.....
The ETH BTC chart also says it all
It has recovered a little But has NOT broken the long term resistance
The Next few weeks are Critical for the Toxic Token.
There is room to ETH to recover and it will likely break that line of resistance but there are certainly better returns and projects to invest in.

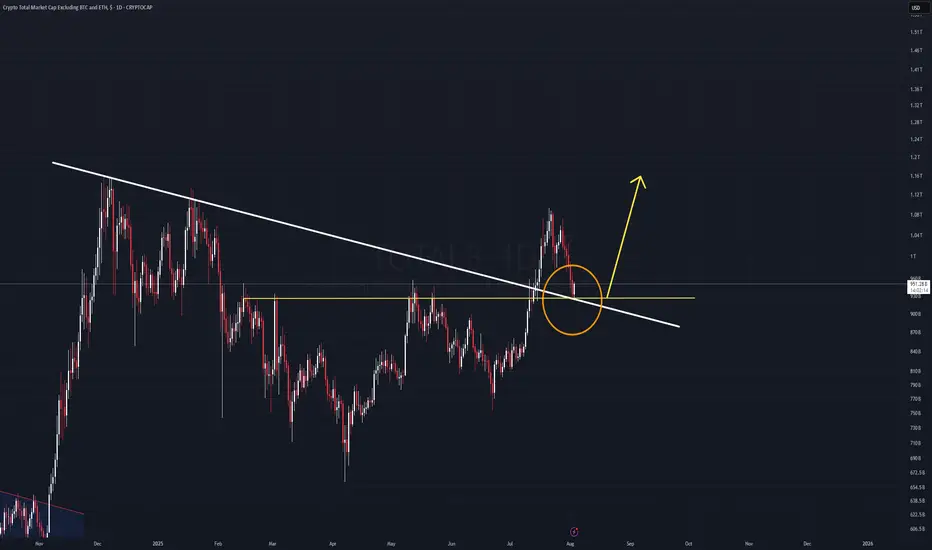
Altcoins season LoadingThe Altseason is approaching.
Altcoins season is inevitable and will be loaded.


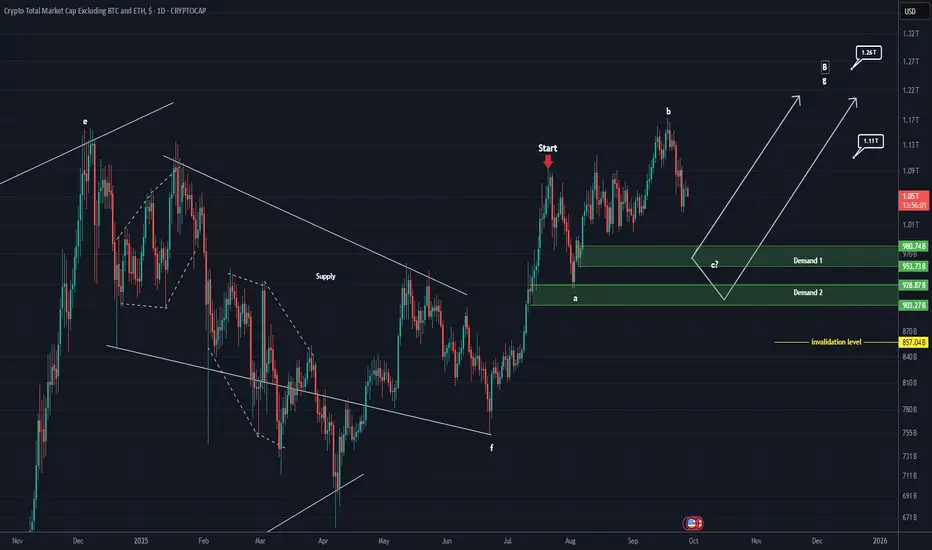
TOTAL 3 Update (1D)This analysis is an update of the analysis you see in the "Related publications" section
An upward move has been added to the previous analysis, and wave b has developed into three parts.
In our view, one more bearish wave c is still remaining, which could complete at Demand Zone 1 or Demand Zone 2. Up to the highlighted green areas, this index still looks bearish to us.
The demand zones in this analysis have been updated, and the invalidation level has also been revised.
Let’s wait and see what happens.
For risk management, please don't forget stop loss and capital management
When we reach the first target, save some profit and then change the stop to entry
Comment if you have any questions
Thank You
BITCOIN DOMINANCE has BROKEN DOWN Initially, we have a head and shoulders pattern that has yet to reach its target.
Additionally, there is a significant breakdown from a broadening ascending wedge.
Expanding wedge formations exhibit increasing volatility as they develop.
These ascending broadening wedge chart patterns emerge during uptrends, signalling trend continuation with higher highs and higher lows, often touching the upper and lower boundary lines of the wedge.
When the head and shoulders pattern was formed, it FAILED to reach the upper boundary.
This suggests a exhaustion of the uptrend.
The activation of the head and shoulders confirmed that a reversal was underway.
Now, we are witnessing the breakdown of the wedge, followed by back testing, which confirms the weakness of #Bitcoin compared to the #ALTS, particularly #Ethereum, of course.
I still believe that Bitcoin has higher price targets that will be achieved, so I remain optimistic about BTC.
If you own Bitcoin, it would be wise to stay with that asset and avoid getting caught up in the extreme volatility of alt coins.
For those of us who have been battling and enduring in the trenches over the past few years, the opposite holds true.
We CANNOT give in to Bitcoin maximalism at this point in the game!
This is our Time!

4 X Crypto TOTAL charts and VRVP show DO NOT PANICTHESE ARE THE DAILY CHARTS
Top line - TOTAL Crypto Market Cap - TOTAL 2 (Excluding BTC )
Bottom Line - TOTAL 3 ( Excluding BTC & ETH ) - OTHERS ( Top 125 coins minus Top 50 by market cap )
TOTAL 3 is ALL ALT coins
OTHERS is Mid to Lower Cap ALT coins
These 4 Charts use the VRVP
the Volume Profile Visible Range (VPVR), is a technical analysis indicator on TradingView that displays the distribution of trading volume at different price levels within the currently visible range of a chart.
The Colour Key is below
Value Area High ( VAH ) - Yellow Dashed Line
Value Area Low ( VAL ) - Red Dashed line
Point of Control ( POC ) - Red Dotted line
Developing POC - Blue Dashed line
Developing Value Area - Purple Dotted line
The MAIN thing to take note of here, is how ALL the charts have come down to the POC ( Point of Control) and then bounced back.
This shows VERY Strong support across the entire Crypto Market, though the lower cap are, as always, More volatile.
The Point of Control (POC) on a Visible Range Volume Profile (VRVP) is the price level with the highest traded volume within the specified time period, representing the price at which the most buyers and sellers interacted, indicating a zone of market equilibrium.
The POC can act as a magnet for price action, with prices often gravitating toward it when they move too far away.
The POC can serve as a key support or resistance level, with price trading above the POC suggesting bullish sentiment and trading below it indicating bearish sentiment.
Traders use the POC to identify potential reversal points, entry and exit zones, and to gauge overall market sentiment
PA Arrived at the POC this weekend and Bounced off it.
It is showing BULLISH signs though we do need confirmation of continuation before we all shout with Koy. The target for conformation is ode PA to reach and pass above the VSH ( Value Area High orange dash)
So, DO NOT PANIC just yet but do remain cautious
TOTAL3 – Altcoin Market Cap (Excluding BTC & ETH) Weekly TF 2025Summary
TOTAL3 is currently in a macro bullish cycle and undergoing a mid-cycle correction. The chart presents a Fibonacci-based structural roadmap with 3 Take Profit zones, identifying both correction supports and breakout targets. There is a high probability of short-term downside before a significant altcoin rally.
🌈 Chart Context
Fibonacci Retracement (Primary Leg):
100% = 285.3B
0% = 1.16T
Trend-Based Fibonacci Extension
A = 285.3B
B = 775B
C = 464.11B
Price as of analysis: ~845.62B
Key Technical Observations
Support Levels:
61.8% Fib Retracement = 618.5B
Strong Confluence Zone: Fib Retracement 48% + Fib Extension 50–61.8% (highlighted on chart)
38.2% Fib Retracement = 824.38B
Resistance Levels:
951.73B: 23.6% Retracement + 100% Extension – strong resistance zone before $1T psychological level
Take Profit Zones:
1 TP (1.1T) = 127% Fib Extension (Upper leg of parallel extension)
2 TP (1.28T) = 161.8% Fib Extension
3 TP (1.7T) = -61.8% Fib Retracement and 261.8% Extension confluence zone
Pattern & Projection:
The structure suggests a possible correction phase to lower support before continuation.
Bullish continuation expected after corrective phase, shown by the projected dotted path.
Structure: Bullish structure with healthy correction in mid-phase of the macro uptrend.
Fundamental Context
Altcoin Lag: TOTAL3 remains ~40% below its ATH, while BTC and ETH have already hit new highs.
Liquidity Shift Expected: Altcoin capital rotation tends to follow after BTC dominance stabilizes or drops.
Macro Backdrop:
Fed expected to cut rates later in 2025
Stablecoin legislation and ETF narratives building altcoin trust
Institutional inflows are slowly diversifying from BTC to ETH and large-cap alts
These suggest a possible shakeout or deeper correction before altseason breakout gains strength.
Bias & Strategy Implication:
Bias: Bullish Mid-Term – Correction Before Continuation
Expected Scenario: Pullback to strong support zones (824B–733B–618B), followed by a sustained breakout toward 1.1T–1.7T.
Invalidation: Weekly close below 618B may delay bullish structure and extend correction.
Strategy:
Long entries at support zones with tight invalidation
Scaling out near TP1, TP2, TP3 based on market momentum
Philosophical View
Patience is the virtue of the second leg in a macro trend. The correction serves to eject the impatient, reprice risk, and strengthen conviction. When TOTAL3 rises from deep support, it will be not just price but confidence that rallies.
Related Reference Charts
TOTAL Market Cap Structural Breakout:
TOTAL2 Altcoin Chart with Fibonacci Path:
✅ Tags
#TOTAL3 #AltcoinMarket #Fibonacci #Altseason #CryptoCorrection #CryptoMacro #TechnicalAnalysis #BullishOutlook #MidCycleCorrection #Crypto2025
⚠️ Notes & Disclaimers
This analysis is educational and not financial advice. Markets are inherently risky. Do your own research and manage risk accordingly.

Altseason Index Proxy (TOTAL3 / BTC.D) Weekly TF
Symbol & Timeframe:
* **Symbol**: CRYPTOCAP\:TOTAL3 / CRYPTOCAP\:BTC.D
* **Timeframe**: Weekly (1W),
* **Purpose**: A clean, data-driven proxy for detecting altseason momentum
Technical Structure:
✅ Key Support Zones
* **13.47B (61.8% Fib)**: Critical golden zone; current price consolidation area
* **12.45B (50.0% Fib)**: Lower bound of golden zone
* **11.00B**: Historical support zone
* **8.15B (0.0%)**: Absolute bottom of retracement range
🔹 Hidden Bullish Divergence
* **MACD Histogram & Signal Lines** show hidden bullish divergence
* Price action forming **higher lows** while MACD makes **lower lows**
* Indicates trend continuation potential
🔢 Fibonacci Targets
TP1: 16.8B (100.0%)
TP2: 22.2B (161.8%)
TP3: 30.7B (261.8%)
🔄 Expected Path
* Potential short-term correction toward 12.4B followed by a breakout
* Bullish continuation path sketched with progressive Fib targets
📈 Macro & Fundamental Confluence
📉 Liquidity and Monetary Easing
* Global monetary policy is easing (e.g., Fed pivot expected mid-2025)
* Increased liquidity historically precedes strong altcoin rallies
BTC Dominance Decline
* BTC.D rolling down from long-term highs
* Signals beginning of capital rotation into altcoins
🚀 Emerging Narratives
* Rise of L2s (e.g., Base, zkSync), AI tokens, real-world asset protocols
* Fresh narratives tend to amplify altseason rotations
💼 Institutional Tailwinds
* Spot ETH ETF approvals pave way for alt ETF flows
* Regulatory clarity expected to reduce uncertainty in late 2025
Related Reference Charts:
🌐 TOTAL3 (Altcoin Market Cap Excluding BTC & ETH)
📊 BTC Dominance (BTC.D)
These charts offer standalone confirmation of:
Altcoin strength forming on TOTAL3
BTC dominance facing structural resistance
Composite Altseason Thesis:
1. Liquidity injections + halving = BTC rally
2. BTC.D breakdown + TOTAL3 support = altcoin strength
3. Technical confirmations: hidden divergence, fib confluence
4. Narrative and regulatory catalysts = widespread rotation
**Conclusion**:
We are entering a prime zone for altseason acceleration. Price reclaim above 13.47B and continued BTC.D drop will validate bullish thesis. Monitor closely for breakouts past TP1 and momentum into TP2/TP3.
📌 Current status:
- Price rebounding in the 12.45–13.47B Fibonacci zone (50–61.8%)
- Hidden bullish divergence on MACD + ascending price structure
- BTC.D has rolled off 65% resistance — suggesting capital rotation
📊 Altseason Thesis:
1. Post-halving BTC rally → profit dispersion into altcoins
2. Macro conditions (Fed pivot, record liquidity) enabling risk-on environment
3. Technical confirmation via index momentum and fib structure
4. Narrative tailwinds: Layer-2 adoption, AI-crypto, altcoin ETF catalysts
📈 Targets:
- TP1 @ 16.8B (100% Fib)
- TP2 @ 22.2B (161.8% Fib)
- TP3 @ 30.7B (261.8% Fib)
🟢 Key support: 12.45–13.47B zone; breakout + BTC.D collapse = altseason trigger.

ETH SERIES | Part 6 – TOTAL3 (4H)
Last 40 days:
TOTAL3 is the strongest chart in this series.
Just printed a new ATH at 1.16T yesterday.
Structure is clean: higher highs + higher lows.
All previous episodes now point to the same conclusion → altcoins are setting up for a powerful push.
Final stop → BTC.D to see if Bitcoin dominance agrees with this scenario.
Always take profits and manage risk.
Interaction is welcome.
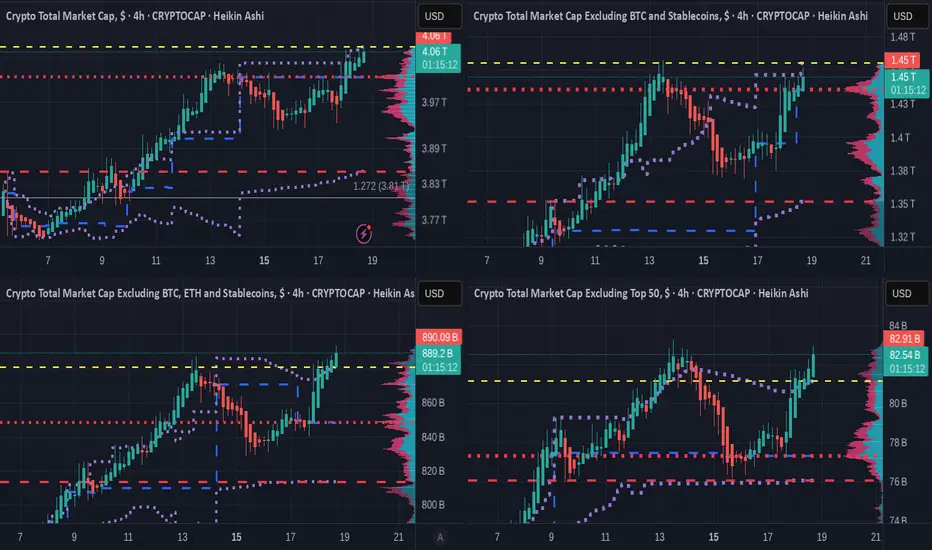
4 X Crypto TOTAL charts showing who is leading the packTHESE ARE THE SHORTER TERM 4 HOUR CHARTS
Top line - TOTAL Crypto Market Cap - TOTAL 2 (Excluding BTC )
Bottom Line - TOTAL 3 ( Excluding BTC & ETH ) - OTHERS ( Top 125 coins minus Top 50 by market cap )
TOTAL 3 is ALL ALT coins
OTHERS is Mid to Lower Cap ALT coins
These 4 Charts use the VRVP
the Volume Profile Visible Range (VPVR), is a technical analysis indicator on TradingView that displays the distribution of trading volume at different price levels within the currently visible range of a chart.
The Colour Key is below
Value Area High ( VAH ) - Yellow Dashed Line
Value Area Low ( VAL ) - Red Dashed line
Point of Control ( POC ) - Red Dotted line
Developing POC - Blue Dashed line
Developing Value Area - Purple Dotted line
The first thing to see is simply that OTHERS has a higher gain than any..
ALT SEASON is here but be VERY Cautious about how long this may last...
IT MAY NOT LAST long.....we MUST watch daily to see what is happening.
Because BTC is poised and ready able to move at any time and when it happens, usually Stops ALTS in their tracks.
Watch the Bitcoin Dominance chart
As you can see, we are in the Zone for a Bitcoin ATH in the next few months.
Be Cautious
So, currently, we have the TOTAL chart just coming up to the VAH. This may prove to be resistance in which Case ALTS may run longer. However, the POC just below could prove to be enough support to push PA above that VAH on a 2nd attempt, IF that is required.
TOTAL 2 is below but rising and the same may apply to the POC just below.
However, the TOTAL 3 and OTHERS are already above the VAH line and so have a clear road ahead but when this fails, the POC sipport is a LONG way below.
This is early days of reaction to the FED 25 point Drp [ and so we need to remain cautious as to the Trend that has yet to prove itself..
But things do look good.....