BTC CAN TURN MONDAY IN A GREEN DAY..📊 Market Update
On the lower time frame, BTC is still in a downtrend. However, there is a possibility of a green day if BTC targets the first level at 113.8K, with a 1-hour time frame confirmation.
The main confirmation for BTC will be at 115.4K. A move from 113.8K could provide an opportunity to consider new day trades.
Trade!

25.08.25 Morning ForecastPairs on Watch -
FX:USDCAD
FX:EURAUD
FX:AUDJPY
A short overview of the instruments I am looking at for today, multi-timeframe analysis down to what I will be looking at for an entry. Enjoy!

TITAN Reversing from Support ZoneNSE:TITAN is reversing from Support Zone. Below are the Targets and Stoploss. Once you achieved the 1st Target, if you are waiting for the next Targets, kindly use Trailing Stop Loss.
You can Buy at the current value.
!st Target - 3600
2nd Target - 3650
3rd Target - 3700
4th Target - 3800
Stop Loss - 3370

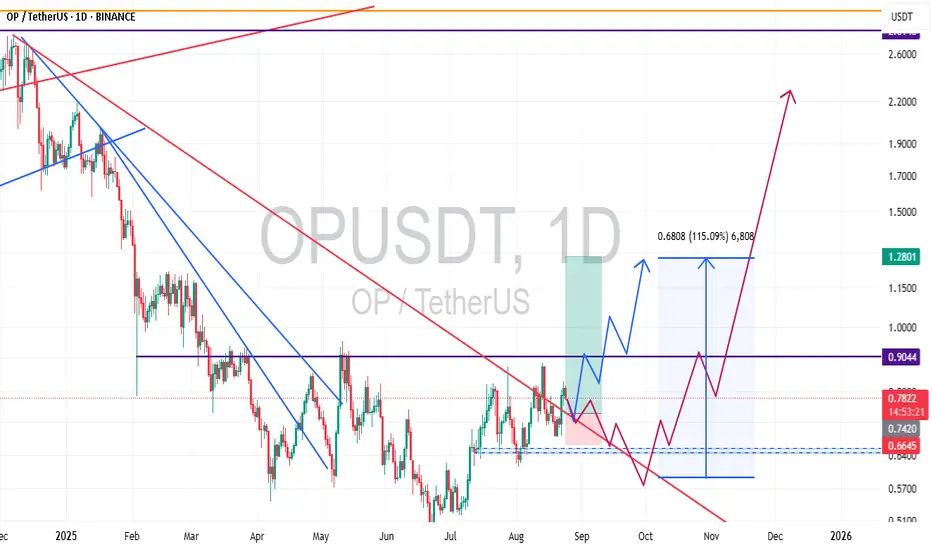
crypto pair opusdt Greetings dear friends
I have two predictions for the OP currency that you see in the picture
I hope they come true and friends will use them
22.08.25 Morning ForecastPairs on Watch -
FX:EURCAD
FX:GBPAUD
A short overview of the instruments I am looking at for today, multi-timeframe analysis down to what I will be looking at for an entry. Enjoy!

CHFJPY / GBPUSD / EURGBP Trade Recaps 22.08.25A tester trade on CHFJPY with the reasons explained as to why this was a test position, a long position executed on GBPUSD, a solid setup that this time around just didn't commit. And lastly a long position on EURGBP playing the failure of sell structure and getting involved in the buys.
Full explanation as to why I executed on these positions and the management plan with all three.
Any questions you have just drop them below 👇

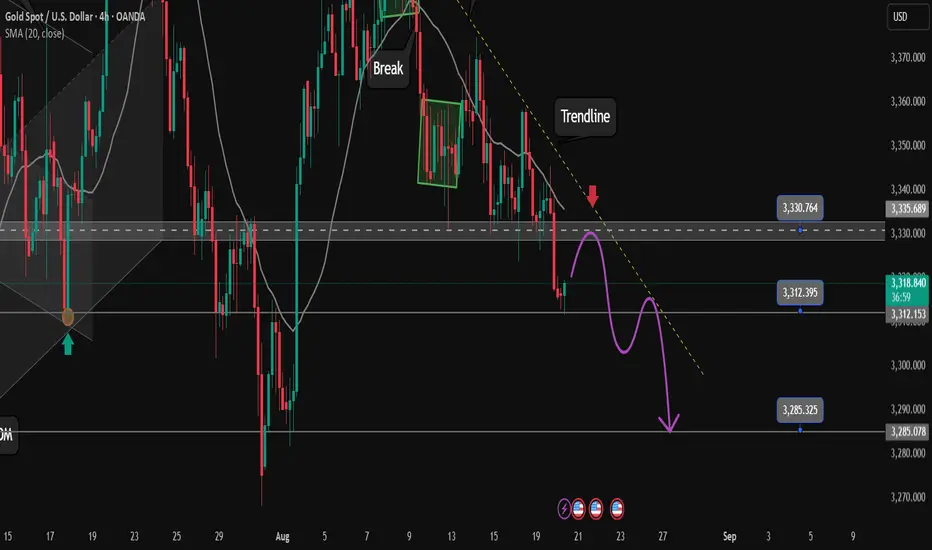
Gold Price Analysis August 21Gold has broken the Trendline and returned to the wide trading range of 3330 - 3360, an important accumulation area in the past few days. This will continue to be the reference area for investors to find entry points.
In the Asian session, the price adjusted to around 3332 - the convergence between the lower edge of the accumulation zone and the 0.5 Fibonacci retracement of yesterday's increase. This is an important milestone to determine the next direction:
✅ If it rebounds from 3332 → the possibility of forming a new uptrend, target 3378.
❌ If H1 closes below 3332 → confirming the return of the downtrend, the price may expand to 3285 in the short term.
📌 Reference strategy:
Buy when the price retests 3333 and there is a clear buy signal.
Sell when it breaks & holds below 3332.
Sell DCA when it breaks 3320 (confluence of trendline + previous break zone).
🔑 Important Zone
Support: 3332 – 3320 – 3310 – 3300 – 3285
Resistance: 3358 – 3378

21.08.25 Morning ForecastPairs on Watch -
FX:GBPCAD
FX:GBPUSD
FX:EURGBP
FX:EURUSD
A short overview of the instruments I am looking at for today, multi-timeframe analysis down to what I will be looking at for an entry. Enjoy!

GBPAUD intraday dips continue to attract buyers.GBPAUD - 24h expiry
Price action is forming a bullish flag which has a bias to break to the upside.
Intraday dips continue to attract buyers and there is no clear indication that this sequence for trading is coming to an end.
20 4hour EMA is at 2.0862.
The sequence for trading is higher highs and lows.
There is no clear indication that the upward move is coming to an end.
We look to Buy at 2.0871 (stop at 2.0811)
Our profit targets will be 2.1051 and 2.1091
Resistance: 2.1006 / 2.1050 / 2.1100
Support: 2.0880 / 2.0820 / 2.0783
Risk Disclaimer
The trade ideas beyond this page are for informational purposes only and do not constitute investment advice or a solicitation to trade. This information is provided by Signal Centre, a third-party unaffiliated with OANDA, and is intended for general circulation only. OANDA does not guarantee the accuracy of this information and assumes no responsibilities for the information provided by the third party. The information does not take into account the specific investment objectives, financial situation, or particular needs of any particular person. You should take into account your specific investment objectives, financial situation, and particular needs before making a commitment to trade, including seeking, under a separate engagement, as you deem fit.
You accept that you assume all risks in independently viewing the contents and selecting a chosen strategy.
Where the research is distributed in Singapore to a person who is not an Accredited Investor, Expert Investor or an Institutional Investor, Oanda Asia Pacific Pte Ltd (“OAP“) accepts legal responsibility for the contents of the report to such persons only to the extent required by law. Singapore customers should contact OAP at 6579 8289 for matters arising from, or in connection with, the information/research distributed.

Confirmation of the continue of the selling side. Ready for SELL✏️ As analyzed yesterday, OANDA:XAUUSD has decreased when looking for selling momentum and target zone 1 has been reached when touching the support zone 3312. This price decrease will soon reach 3285 soon but need to pay a little attention to the statement of FOMC. SELL strategy is the most optimal strategy at the moment for Gold. BUY point must wait for confirmation around 3385 from buyers who want to participate in the market.
📉 Key Levels
SELL trigger: retest resistance 3330 with price rejection from sellers
SELL DCA trigger: break support zone 3312
Leave your comments on the idea. I am happy to read your views.
20.08.25 Morning ForecastPairs on Watch -
FX:GBPUSD
FX:EURUSD
FX:AUDJPY
OANDA:XAGUSD
A short overview of the instruments I am looking at for today, multi-timeframe analysis down to what I will be looking at for an entry. Enjoy!

19.08.25 Morning ForecastPairs on Watch -
FX:EURCAD
FX:GBPUSD
FX:GBPCAD
A short overview of the instruments I am looking at for today, multi-timeframe analysis down to what I will be looking at for an entry. Enjoy!

Gold price heading to 3400 early this week✏️Gold price has a liquidity sweep to 3323 and closes the H4 candle back above the 0.5 fibonacci of the bullish wave structure. The next level that gold is aiming for is the past resistance zone and also the 0.618 Fibonacci zone, which is the price zone of 3358. This is also an area within a trendline that was just formed last week. If trading above the Fibonacci zones, gold will soon regain the 3400 level.
📉 Key Levels
BUY trigger: Break trendline, Break Resitance, Break Fibonacci at 3358
BUY trigger: price action to Fibonacci 0.5 and there is a reaction from the buyers at 3345
Target 3400
Leave your comments on the idea. I am happy to read your views.

Is GBPUSD Setting up for a Long Swing?Hi Traders!
I've been watching this pair. It seems like it could be setting up for a long swing. I would like to see a retest around 1.34900/800, and how it reacts to that area. That'd hit a Daily Order Block. In addition, the weekly made a break of structure, and dipped into a weekly breaker OB, then pushed up. However, the only thing I don't like is it's at a weekly resistance. But, IMO the monthly looks bullish.
So, over all I'm bullish on this pair and will plan to swing, I just need my confluences to match up fully before taking this trade.
*DISCLAIMER: I am not a financial advisor. The ideas and trades I take on my page are for educational and entertainment purposes only. I'm just showing you guys how I trade. Remember, trading of any kind involves risk. Your investments are solely your responsibility and not mine.*

18.08.25 Morning ForecastPairs on Watch -
FX:EURUSD
FX:GBPAUD
FX:AUDNZD
FX:EURNZD
A short overview of the instruments I am looking at for today, multi-timeframe analysis down to what I will be looking at for an entry. Enjoy!

Buy strategy still works until 3345 is broken✏️Gold price has confirmed the break of Fibonacci 0.618 and is continuing the uptrend. However, surprisingly, the Asian trading session attracted some selling pressure, pushing gold to around the 3355 break zone. When confirming the break of 3358, 3345 became the most important zone of the uptrend and this is also a trendline zone in the H4 time frame. The BUY gold strategy is still the main one until 3345 is broken.
📉 Key Levels
Support 3360-3345-3313-3285
Resistance; 3381-3404-3430
BUY now 3360 Break out and Retest Support zone (Fibonacci 0.618)
BUY Trigger 3345 Rejection of the support zone with buying pressure candle
SELL Trigger Break and trading Bellow support 3343
Leave your comments on the idea. I am happy to read your views.

Today's important price zone 3332. Determine the Gold Trend✏️Gold continues to receive some buying pressure at 3332 Fibonacci 0.382 zone. Thus, 3332 zone becomes the Key Level zone in the current trend. Gold is currently trading in a 332-3360 border zone. When Price breaks the trendline as well as Fibonacci 3360, it will confirm clear buying pressure.
📉 Key Levels
SELL Trigger 3332 Confirmation of candle closing below the important support zone 3332.
BUY Trigger 3360 Buying force breaks the Trendline and breaks
Leave your comments on the idea. I am happy to read your views.

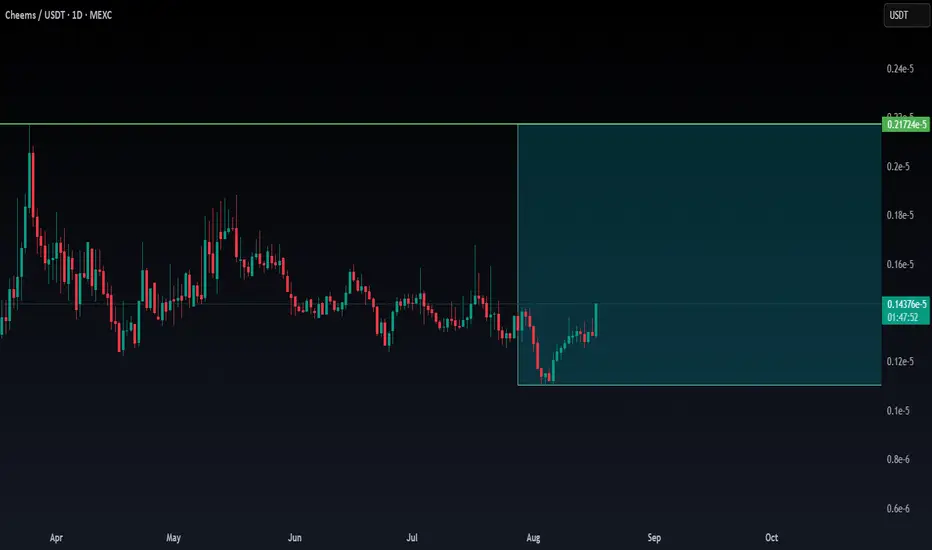
CHEEMS_USDT Can this coin make it on low time frame?Cheems seems to have interesting level confirmation. What could be confirmed in the coming hours?
For this reason, follow this day trade option to see the possibility.
In case there is a confirmation, the update will get a follow-up.
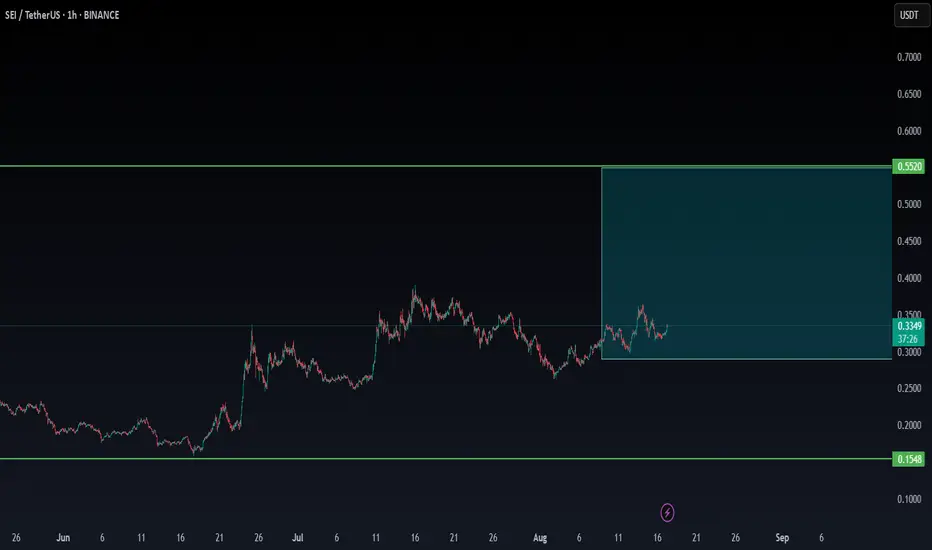
SEI/USDT NEW INCREASE VOLUMESEI is showing a new trend in volume, which may be confirmed in the coming time frames. We will continue to monitor the trend to see if confirmation occurs
POND/USDT AT A BREAK LEVELPOND/USDT: If it breaks and holds above $0.00938 with confirmation, it could get interesting over time. For now, I’m just watching to see how it behaves; without confirmation, it remains risky.
When it's able to confirm the $0,00938 with confirmation, the coin could break to up $0,012
We will follow the coin if it's able to confirm the break and for updates/new targets.
If there is real interest, it should be confirmed in the coming 4H

Recession's here? Don't fear, Gold signifies the new frontier.Gold monthly setting up for an explosive upward move in relation to forex bulletins and potential global bifurcation.

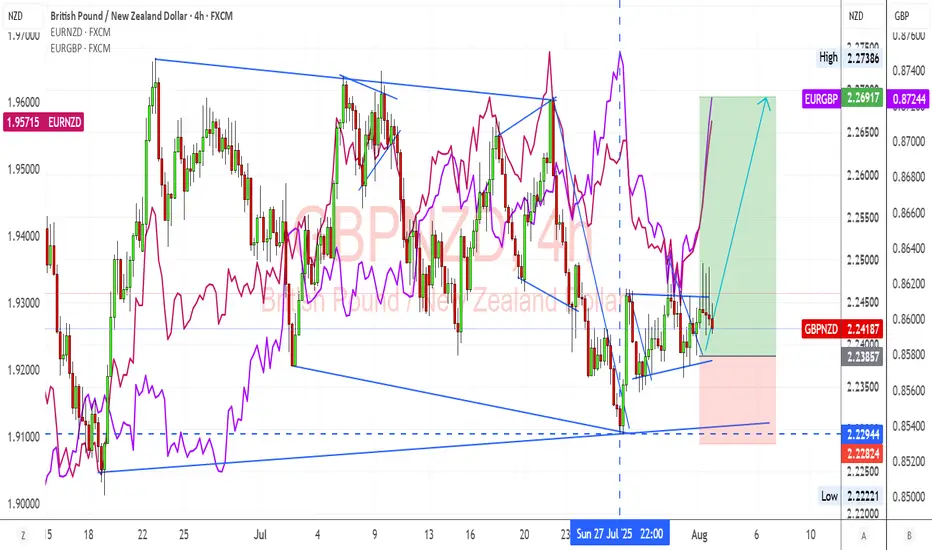
GBPNZD Breakout from Consolidation Bullish Momentum BuildingGBPNZD has broken out of its recent consolidation pattern and is showing signs of bullish continuation. Strong GBP fundamentals combined with NZD weakness from global risk-off sentiment and tariffs support this technical move.
Technical Analysis (4H Chart)
Pattern: Breakout from a descending channel with bullish follow-through.
Current Level: 2.2418, trading above the breakout level, confirming momentum shift.
Key Support Levels:
2.2294 – recent breakout support and invalidation point for bulls.
2.2222 – secondary support if a deeper pullback occurs.
Resistance Levels:
2.2500 – near-term resistance and potential target for the breakout.
2.2690 – extended bullish target if momentum continues.
Projection: Likely to continue higher toward 2.2500, with room for 2.2690 if GBP strength persists.
Fundamental Analysis
Bias: Bullish.
Key Fundamentals:
GBP: Supported by BOE’s cautious stance on inflation and the relative resilience of the UK economy.
NZD: Pressured by global tariffs, weaker risk sentiment, and limited domestic growth catalysts.
USD Factor: Fed rate cut expectations indirectly support GBP crosses against risk currencies like NZD.
Risks:
Hawkish surprise from RBNZ could strengthen NZD.
BOE dovish signals could stall GBP upside.
Key Events:
BOE meeting and UK CPI.
RBNZ policy decision.
Risk sentiment trends globally.
Leader/Lagger Dynamics
GBP/NZD is a leader among GBP crosses, with GBP strength and NZD weakness driving momentum. It also aligns with EUR/NZD upside moves, reinforcing the bearish NZD outlook.
Summary: Bias and Watchpoints
GBP/NZD is bullish, having broken consolidation with upside targets at 2.2500 and 2.2690. The main drivers are GBP’s policy support, NZD’s risk-off weakness, and global tariff concerns. Watch for BOE and RBNZ updates as potential volatility triggers.
HK50 LONGThere is a bat pattern on M30 and H1 showing a reversal zone
This is with the daily and H4 trend
All timeframes are oversold, but must wait for more consolidation and stronger RSI divergence
Stop loss of 150 pips
