Weekly focus list: Dec 15-19Good time of the day, everyone.
I want to introduce a new video format where I’ll be covering the setups I’m tracking for the upcoming week — on both the long and the short side.
Potential swing-long opportunities for this week:
BW - looks the most interesting to me give the nature of the catalyst and consolidation with 3T (tightenings) into 21dEMA
IONS — may have kicked off a new leg higher on Friday
SUPV — shaping up as a possible “cheat” VCP setup
NEO — still looking very constructive
KROS — tight short-term base forming; could work as a continuation set-up
KSS — nice tight action following the post-earnings
INDI — still constructive; low-volume pullback with a 5-day lower low. If it’s going to follow through, this feels like the timing
PRAX — possible delayed reaction setup
SEPN — orderly pullback and consolidation so far; needs a decisive start to the swing (momentum expansion with a close in the top 1/3 of the daily range)
ACHV — similar profile: clean consolidation, but waiting for clear momentum expansion and a strong close to confirm the swing
On swing-shorts watching for follow-through in
SNDK, LUMN, and EOSE (at least for a potential higher-low setup).
Let me know what you think about this new video format, and feel free to share the setups you’re tracking as well.
Wishing everyone a productive and focused trading week ahead
Tradeideas

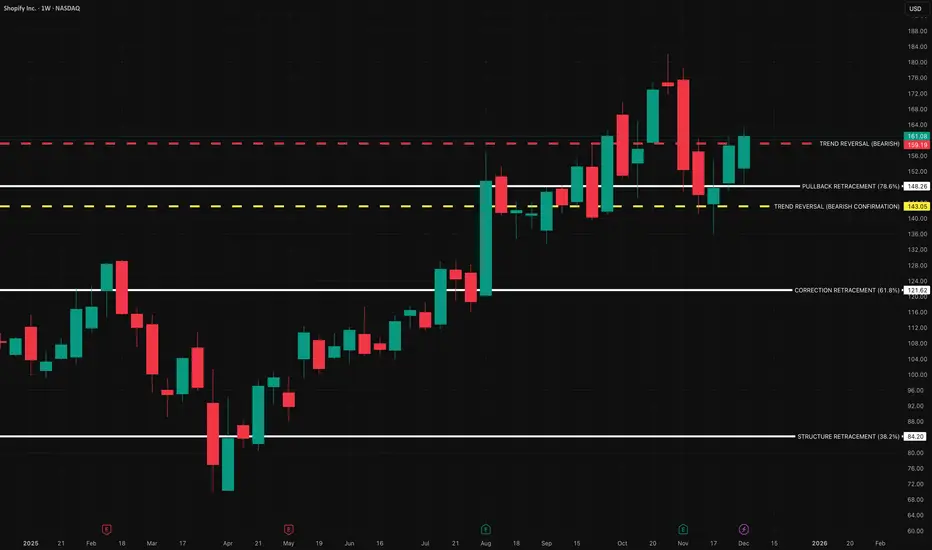
$SHOP | COVERAGE INITIATED — Personal Position Update [W49]COVERAGE INITIATED — Bullish Classification (Trend Shift Identified)
SHOP — WEEK 49 TREND REPORT | 12/05/2025
Ticker: NASDAQ:SHOP
Timeframe: W
This is a reactive structural classification of SHOP based on the weekly chart as of this timestamp. Price conditions are evaluated as they stand — nothing here is predictive or forward-assumptive.
⸻
Author’s Note — Personal Position Update
I initiated my own position on [ NASDAQ:SHOP ] during Week [ 49 ], entering at $ [ 161.08 ].
This decision follows my personal criteria: I only participate when my system identifies a verified structural trend shift supported by both a confirmed weekly flag and a qualifying candle state. This note reflects my activity only and is not a suggestion for anyone else.
As of this update, my position is currently up ~ [ 0% ] from my entry.
My structural exit level is $ [ 159.19 ] on a weekly-close basis. This level will continue to adjust upward automatically as the structure strengthens. If price closes below that threshold, my system classifies the trend as structurally compromised, and that is where I personally exit.
This update exists solely to document my own participation and the structural levels I monitor. It is not predictive and does not imply any future outcome.
⸻
Structural Integrity
1) Current Trend Condition [ Numbers to Watch ]
• Current Price @ $
• Trend Duration @ +0 Weeks
( Bullish )
• Trend Reversal Level ( Bearish ) @ $
• Trend Reversal Level ( Bearish Confirmation ) @ $
• Pullback Retracement @ $
• Correction Support @ $
⸻
2) Structure Health
• Retracement Phase:
Uptrend (operating above 78.6%)
• Position Status:
Healthy (price above both structural layers)
⸻
3) Temperature :
Neutral Phase
⸻
4) Momentum :
Bullish
⸻
Structural Alignment
UPWARD STRUCTURAL ALIGNMENT
This mark reflects a point where market behavior supported the continuation of the existing upward direction. It does not imply forecasting or targets — it simply notes where strength became observable within the current trend. Its meaning holds only while price continues to respect the broader structural levels that define the trend.
⸻
Methodology Overview
This classification framework evaluates directional conditions using internal trend-interpretation logic that references price behavior relative to its structural layers. These relationships are used to identify when price movement aligns with the framework’s criteria for directional phases, transition points, or regime shifts. Visual elements or structural labels reflect these internal interpretations, rather than explicit trading signals or preset indicator crossovers. This framework is observational only and does not imply future outcomes.
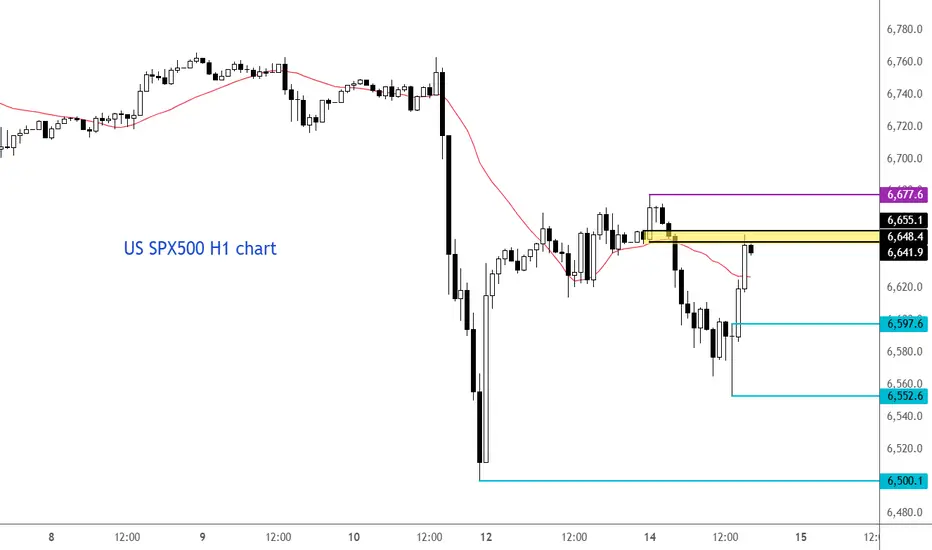
S&P 500 testing resistance after bouncing off lowsMarkets recovered sharply from their earlier lows on the back of comments from US Trade Representative Jamieson Greer, who told CNBC that Donald Trump was still set to meet Chinese premier Xi Jinping. But it remains to be seen whether the US and China will come to some sort of an agreement, perhaps an extension of the tariff truce. That scenario looks more likely than a complete breakdown into a full-blown trade war. However, the risks are undeniably rising.
Anyway, the SPX500 is now testing key resistance here between 6648 to 6655, marked in yellow on the chart. Unless it goes on to make a higher high above 6677 on this hourly chart, and hold above it, there is still the risk we could see another dip as we head deeper in the US session.
By Fawad Razaqzada, market analyst with FOREX.com
Gold eases off records on profit-takingGold continued its remarkable rally today, briefly touching a new record high of $3,871, before easing on profit-taking to turn lower at the time of writing.
Despite last week's small dollar strength from upbeat US data, the metal decisively broke above the next round handle of $3,800, where it was still holding today. The bullish structure remains intact as long as the higher highs and lows persist.
Key drivers for gold include strong central bank demand, ongoing geopolitical risks, de-dollarisation trends, and concerns over US debt and policy credibility. While Fed rate cut expectations have been pared back slightly, the overall case for gold remains resilient, underpinned by structural factors rather than short-term policy shifts.
This week’s focus turns to critical US labour market data, including JOLTS and non-farm payrolls, which could sway the dollar’s direction and gold’s short-term momentum.
Technically, gold’s next upside targets are $3,900 and $4,000, while support lies around $3,790–$3,800 initially. Below this area, you have the short-term trend line and then nothing significant until $3,700. Meanwhile, the RSI is flashing big warning signs on multiple time frames. But despite overbought conditions, momentum remains strong, making dip-buying the preferred strategy in the near term.
By Fawad Razaqzada, market analyst with FOREX.com

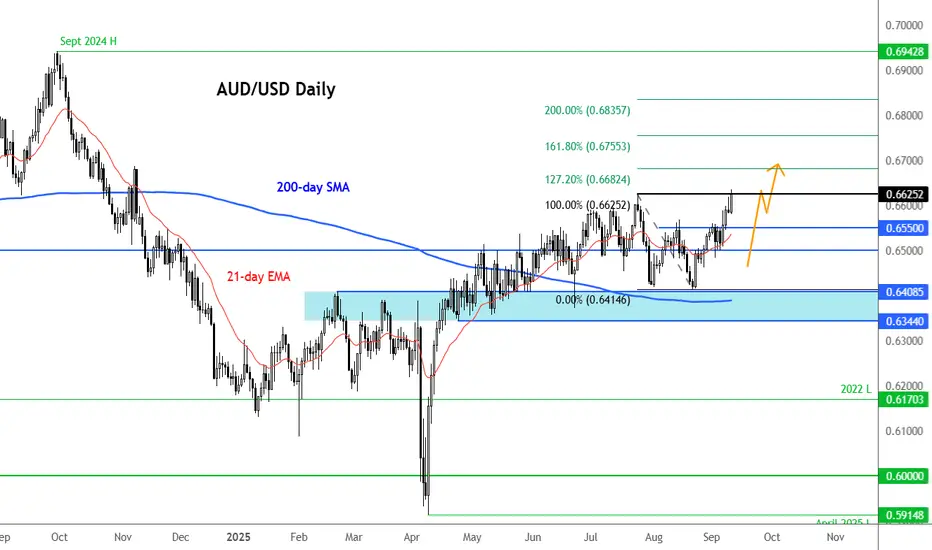
AUD/USD hits new YTD high on USD weaknessThe US dollar weakened further on the back of the unexpected drop in producer prices inflation, which has now raised the bar even higher for CPI to beat expectations tomorrow. This caused the AUD/USD to break to a new high for the year. The Aussie could now start to rise more noticeably after months of underperformance relative to the euro and pound, for example.
As you may have already seen it, headline and core prints fell by 0.1% in August took the market by surprise given that gains of 0.3% were expected on both fronts. What’s more, July was revised down to +0.7% from +0.9% previously. As a result, the year-over-year PPI fell to +2.6% against expectations of 3.3% as energy and services prices took a dip.
From a technical point of view, the AUD/USD repeatedly tested the support zone between 0.6370 and 0.6430 in recent weeks, but the bears failed to cause a breakdown. Instead, rates have started to rally, along with the other major pairs.
The latest rally in the AUD/USD pushed through 0.6560 to create a short-term higher high earlier this week, before a brief pause yesterday. The fact that the July peak at 0.6625 is now taken is a positive development now from a bullish point of view. If the breakout can now hold, then this could open the way towards round-number handles such as 0.67, 0.68, and beyond, with the September 2024 high at 0.6942 the next major objective if momentum holds. The 0.6560 level now acts as the first layer of support. Below that we have 0.6500.
By Fawad Razaqzada, market analyst with FOREX.com
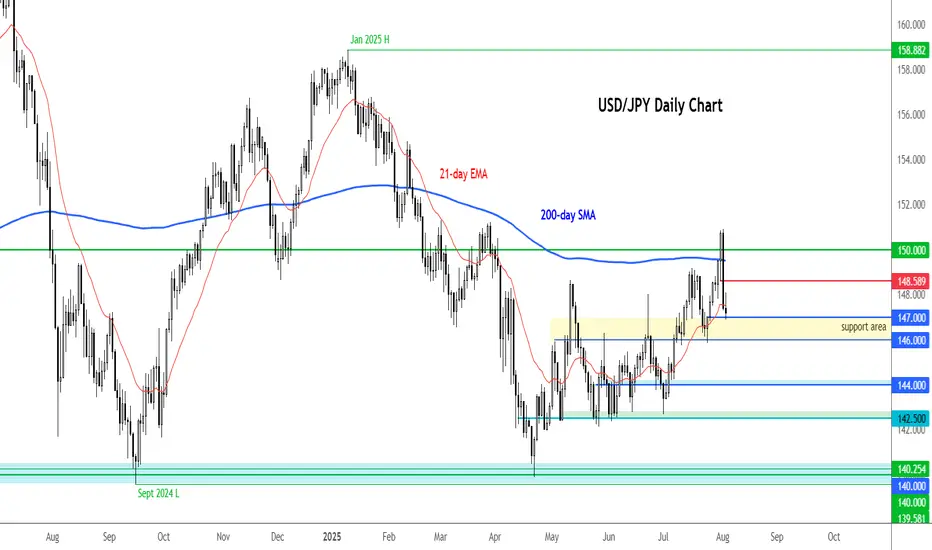
USD/JPY in focus as ADP disappointsThe USD/JPY has tested the 200-day average twice in as many days and has failed to break above it on both occasions. With resistance around the 148.50-149.00 area holding, could we see a break lower in the coming days?
Well, a lot now depends on data. The ADP private payrolls report has missed the mark at just 54K vs. 73K expected. Shortly, we will get more updates on the jobs market with the release of weekly unemployment claims and the employment component of the ISM Services PMI. Friday’s non-farm payrolls report will be quite important in as far as expectations for the Fed’s future policy is concerned.
What the UJ bears would want to see now is some downside follow-through below Wednesday's inverted hammer candle. So far, we haven't had any downside but if rates turned lower again then that could mark the start of a major shift.
By Fawad Razaqzada, market analyst with FOREX.com

OPEN Bulls Charge! $5.50 Call Setup | High Gamma Play
# 🚀 OPEN Weekly Options Trade Idea (2025-09-03)
### 📊 Multi-Model Recap
* **Daily RSI**: 🔥 70.8 (strong)
* **Weekly RSI**: 🚀 80.7 (overbought but bullish)
* **Options Flow**: 💎 C/P = 3.07 (extremely bullish)
* **Volume**: 📉 0.6x (40% drop vs prior week → caution)
* **Gamma/Theta**: ⚡ High risk (2 DTE)
👉 Models in agreement: **ALL bullish** → \$5.50 CALL strike.
* Stops range: 40–50% premium.
* Profit targets: +50% up to +100%.
* Confidence: 65–75% (avg \~72%).
---
### ✅ Consensus Trade Setup
```json
{
"instrument": "OPEN",
"direction": "call",
"strike": 5.5,
"expiry": "2025-09-05",
"entry_price": 0.31,
"profit_target": 0.60,
"stop_loss": 0.16,
"size": 1,
"confidence": 0.72,
"entry_timing": "open"
}
```
---
### 🎯 Trade Details
* 📌 **Strike**: \$5.50 CALL
* 💵 **Entry**: 0.31 (limit/ask at open)
* 🎯 **Target**: 0.60 (+90% R/R)
* 🛑 **Stop**: 0.16 (\~48%)
* 📅 **Expiry**: Sep 5 (weekly)
* 📈 **Confidence**: 72%
* ⏰ **Max Hold**: Close by Thu EOD (avoid Friday gamma bomb)
---
⚠️ **Risks & Notes**
* Overbought RSI → quick reversal risk ⚡
* Volume weakness = 🚨 conviction reduced
* High gamma + theta burn = tight stop & discipline
* Do NOT chase entry above 0.35 ❌

ULTA Earnings Play---Money About TO Print
# 🚀 ULTA Earnings Play (8/28 AMC) 🚀
💎 **Moderate Bullish | 65% Conviction** 💎
🎯 **Trade Setup**
📊 Ticker: \ NASDAQ:ULTA
🔀 Direction: CALL 📈
🎯 Strike: 560.00
📅 Expiry: 2025-08-29
💵 Entry: 6.10 (ASK)
📦 Size: 1 contract (risk 💸 \$610)
🎯 Target: 15.25 (150%+)
🛑 Stop: 3.05 (-50%)
⏰ Timing: Pre-earnings close (8/28 AMC)
⚡ **Why Bullish?**
* 📈 Strong momentum near 52W high
* 🔥 88% beat rate (avg. surprise 7.6%)
* 📊 Options flow call-skewed (\$527–545 cluster)
* 🚀 Technicals > Fundamentals → short-term edge
✅ **Execution Rule**: In before close, out within 2h post-earnings or at stop/target.
---
### 📌 Suggested TradingView Tags
\#ULTA #UltaBeauty #EarningsPlay #OptionsTrading #CallOptions #WeeklyOptions #BullishSetup #MomentumTrading #TradeIdeas #StockMarket 🚀📊

MRVL Earnings Play--Don’t Miss Out
# 🚀 MRVL Earnings Play (8/28 AMC) 🚀
💎 **Moderate Bullish | 75% Conviction** 💎
🎯 **Trade Setup**
📊 Ticker: \ NASDAQ:MRVL
🔀 Direction: CALL 📈
🎯 Strike: 80.00
📅 Expiry: 2025-08-29
💵 Entry: 2.23 (ASK)
📦 Size: 1 contract (risk 💸 \$223)
🎯 Profit Target: 6.69 (200%)
🛑 Stop: 1.12 (-50%)
⏰ Timing: Pre-earnings close (8/28 AMC)
⚡️ **Why Bullish?**
* 🚀 AI/data-center sector tailwinds
* 📈 Heavy OTM call OI at \$78–85 (dealer hedging fuel)
* 🔥 Pre-earnings drift (+2.49% today)
* 📊 IV elevated but not extreme → room for upside
✅ **Execution Rule**: In before close, out within 2h post-earnings or at stop/target.
---
### 📌 Suggested TradingView Tags
\#MRVL #Marvell #EarningsPlay #OptionsTrading #CallOptions #WeeklyOptions #BullishSetup #MomentumTrading #TradeIdeas #StockMarket 🚀📊

BABA Earnings Play---Don’t Miss Out
# 🚀 BABA Earnings Play (8/28 AMC) 🚀
💎 **Moderate Bullish | 72% Conviction** 💎
🎯 **Trade Setup**
📊 Ticker: \ NYSE:BABA
🔀 Direction: CALL 📈
🎯 Strike: 130.00
📅 Expiry: 2025-08-29
💵 Entry: 0.83 (ASK)
⏰ Timing: Pre-earnings close (8/28 AMC)
📦 Size: 1 contract (risk 💸 \$83)
🎯 Target: 2.49 (200%)
🛑 Stop: 0.42 (-50%)
⚡️ **Why Bullish?**
* 📈 Strong margins & FCF cushion
* 🔥 Call OI stacked at \$125–130 (gamma fuel)
* 📊 Price above key MAs, neutral RSI → upside ready
* 🌎 Macro risk still there, but market tilt is bullish
✅ **Execution Rule**: In before close, out within 2h post-print or at target/stop.
---
### 📌 Suggested Tags (TradingView-style)
\#BABA #Alibaba #EarningsPlay #OptionsTrading #CallOptions #WeeklyOptions #BullishSetup #MomentumTrading #TradeIdeas #StockMarket 🚀📊

BULL Earnings Play--Don’t Miss Out
# 🚀 BULL Earnings Play (8/28 AMC) 🚀
💎 **Moderate Bullish | 75% Conviction** 💎
🎯 **Trade Setup**
📊 Ticker: \ NASDAQ:BULL
🔀 Direction: CALL 📈
🎯 Strike: 15.00
📅 Expiry: 2025-08-29
💵 Entry: 0.46 (ASK)
⏰ Entry Timing: Pre-earnings close (8/28 AMC)
📦 Size: 1 contract (risk 💸 \$46)
📈 Profit Target: 1.38 → 200%
🛑 Stop Loss: 0.23 (-50%)
---
⚡️ **Why Bullish?**
* 🚀 Revenue growth + crypto expansion catalysts
* 🏦 Options flow skew → heavy \$15C & \$16C activity
* 📉 Low VIX → cheap volatility for earnings week
* 📊 Risk/reward: 2–3x upside vs. capped downside

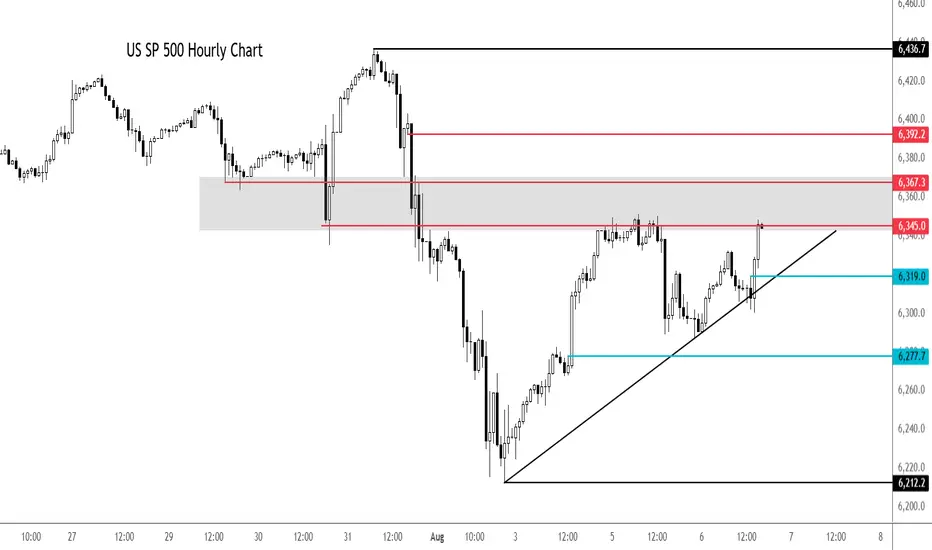
S&P 500 extends rally despite macro concernsThe 5% Apple rally aside, it is all about rate cut bets vs. strong earnings. So far, the latter has helped to keep US markets supported near all-time highs. But if macro concerns increase further, investors' perception about future earnings growth will weaken. And with that, we could see some cracks in expensive stocks.
Looking at the hourly chart of the SPX500, the US benchmark was testing a potential resistance zone in the shaded region between 6345 to 6367, an area which was previously support. Above this zone, 6392 is the next level of potential resistance and then the all-time high of 6436 comes into focus next.
earlier, the index bounced after a failed breakdown below the trend line shown on the chart. Another potential test of the trendline could see the index break lower. Short-term support is seen around 6319 then 6277.
By Fawad Razaqzada, market analyst with FOREX.com
USD/JPY testing key support after Friday's dropThe USD/JPY fell sharply Friday in reaction to the weak US jobs data. But it is now testing the upside of a massive short-term support area, between 146.00-147.00. Can we see a bounce here towards 148.60 zone initially?
By Fawad Razaqzada, market analyst with FOREX.com
EURUSD Analysis – Supply Zones & Reversal Opportunities (MMC)Today’s EURUSD analysis focuses on identifying major supply zones, potential reversal points, and directional bias using the Mirror Market Concept (MMC) on the 8-hour timeframe.
1️⃣ Market Structure & Channel Supply Zone
The market recently formed a descending channel 📉, acting as a full supply zone where sellers dominated.
Every time price touched the upper boundary of this channel, we saw bearish reactions, proving this zone as a strong liquidity grab area.
Breakdown from the channel: After repeated attempts to break the channel to the upside, sellers regained control, pushing EURUSD lower and confirming bearish momentum.
2️⃣ Central Reversal Zone (Decision Point) ⚖️
Currently, price is consolidating around the Central Reversal Zone.
This zone is crucial because it can act as:
Reversal Point 🟢: If buyers step in aggressively, we might see a bullish leg toward previous swing levels, targeting resistance zones.
Continuation Zone 🔻: If sellers maintain pressure and break below this level, momentum will shift strongly bearish, aiming for deeper support.
Price behavior here will define short-term direction. Traders must wait for confirmation before committing to large positions.
3️⃣ Next Major Reversal Zone (High-Probability Demand) 🟩
Marked in green, this zone is expected to attract buyers if the current level fails.
Historically, these areas show high liquidity grabs and institutional activity.
If price reaches this zone, we expect significant bullish interest, making it a high-probability reversal area for medium-term buy setups.
4️⃣ Trade Scenarios
Scenario 1 (Bullish Reaction 🟢):
Price bounces from the Central Reversal Zone.
Possible targets: Previous structure highs inside the channel break zone.
Scenario 2 (Bearish Continuation 🔻):
Price fails to hold above and breaks lower.
Target: Next Major Reversal Zone for fresh liquidity accumulation.
5️⃣ Trading Approach & Risk Management 🛡️
Aggressive Approach: Intraday traders can scalp inside the Central Reversal Zone but must keep tight stop-losses to avoid fake-outs.
Conservative Approach: Wait for a clean break and retest confirmation, especially near the Next Reversal Zone for high-probability trades.
Maintain risk-to-reward (RR) ≥ 1:2 and avoid emotional trading during reversal attempts.
Summary:
EURUSD is at a critical juncture. The current market structure shows a bearish tone, but the Central Reversal Zone can still cause a temporary bullish reaction. A failure to hold will open the path toward the green reversal demand zone, where major buyers are likely to appear.

$IREN could be next...100%+ UpsideNext Retail Darling... NASDAQ:IREN TA looks the part! 👀
Breakout 🎯$22 then $31
CupnHandle almost breaking out here with measured moves a lot higher!
Volume shelf acting as a launch pad.
WR% is uptrnding as well!
This one's looking good based on the TA.

$TEM - GET READY! 30%+ UpsideNASDAQ:TEM - GET READY!
✅ Inverse H&S Breakout
✅ Falling Wedge Breakout
🎯 Targets: $77.43 & $90.63 Before August!

$NVTS is up 125%, but they might not be done yet!NASDAQ:NVTS Could see more upside if...
We close the week above $4.66 Double Bottom Breakout. This would lead us to the following targets...
🎯$6📏$7.76
- Bullish cross on H5_L indicator
- Volume shelf launch with GAP
- NASDAQ:NVDA Partnership
- Small Cap
- High Short Float

MNQ Trade Idea Continuation (3)Continuation into the trade idea we were sharing, we traded through the Daily high level we were targetting of 21,404.75 then rushed lower under the Trendline Phantom line and under the IFVG that was used as support for price to reach 21,419.75.
Will this be another manipulation below 21,362.00 lows before continuation higher, or should I have set a TP at the 21,404.75 highs and called it a day?

Tyree Thomas Jr USD/JPY Bias 4/7/25I believe that U/J will sell to my take profit at the green Fib extension. I will be posting my trade ideas every evening. I use the Fibonacci Retracement tool, the Fibonacci Extension tool, Six EMA's, Market Structure, and the TDIGM in my trading strategy to create my Bias.

Ready to $DASH! H5 Swing TradeReady to NASDAQ:DASH 🏃💨
🎯$215📏$227⏳May2025
Falling Wedge Breakout ✅
Breakout Retest ✅
Bullish WCB ✅
Volume Shelf ✅
Bullish H5_S Indicator ✅
Not Financial Advice

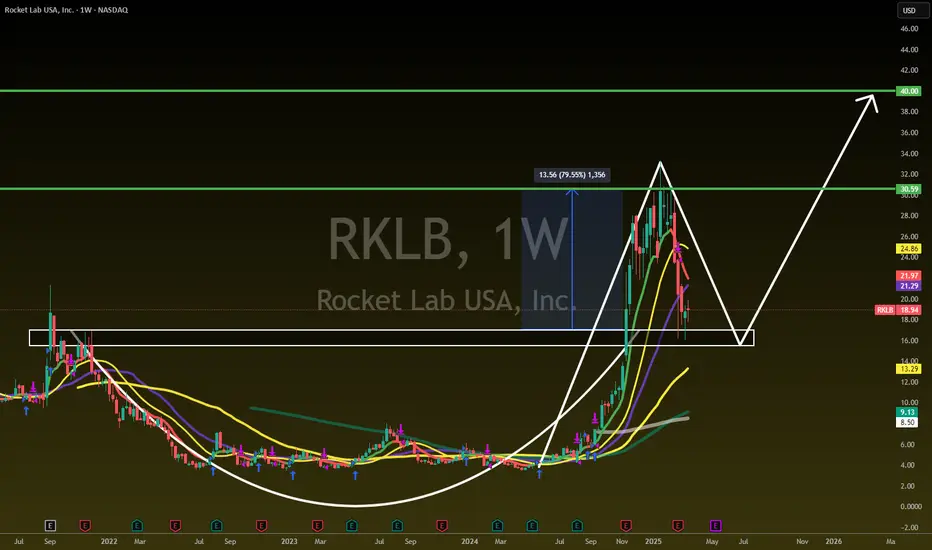
$RKLB - Has landed back at the launchpad! Ready to Re-LaunchNASDAQ:RKLB - Has landed back at the launchpad🚀
Rounded Bottom = $30.59 MM 🎯🏹
Retested and Confirmed with 2 Wick-Offs
Market goes higher = $40 🎯
Not financial advice
META is coming back to life!NASDAQ:META
As we discussed before a breakdown out of this Bullish Trend since 2022 would be very bearish and take META to the $400's.
Well, they said, hold my beer, and bounced hard exactly at the bottom of the channel and Anchored VWAP.
It's not over yet, as we need to follow through next week with a nice engulfing candle to make people into believers!
Not financial advice.

H5 Trade of the Week! 21% UpsideNASDAQ:BIDU Swing Trade is Primed!
In this video, I'll give you:
- Full Trade Idea
- Entry & S/L
- Options Taken
- Profit Targets
Check it out!
Not financial advice
