Continuation Toward Discovery or Liquidity Pullback First?OANDA:XAUUSD on the H1 timeframe has just delivered a strong impulsive breakout, pushing decisively above the previous all-time high and entering price discovery territory. The vertical expansion following the consolidation phase signals aggressive buyer participation and confirms that the broader bullish structure remains firmly intact. This type of breakout typically reflects a release of compressed liquidity rather than an isolated spike.
After the breakout, price is now consolidating just above the former all-time high, which has flipped into a potential support zone. This pause suggests the market is digesting the recent expansion and allowing late buyers to position, while early longs manage risk. The presence of a visible gap below current price further reinforces the likelihood of a short-term rebalancing phase before the next directional push.
From a bullish continuation perspective, holding above the old all-time high keeps the structure constructive. A shallow pullback or sideways consolidation above this level would indicate acceptance and strengthen the case for further upside expansion toward higher liquidity targets, with the next leg potentially extending toward the 4,650–4,680 region as price continues discovery.
However, failure to maintain acceptance above the prior high would shift focus toward a corrective scenario. In that case, price may rotate back to fill the nearby gap and retest the 4,520–4,550 region, where stronger demand is expected to emerge. Such a move would still be considered healthy within the broader uptrend, allowing the market to absorb excess liquidity before resuming higher.
Overall, Gold remains in a dominant bullish regime, with price action now governed by acceptance above prior highs rather than resistance-based trading. Whether the market continues directly into expansion or first retraces to rebalance, the prevailing structure favors higher prices as long as the old all-time high holds as support.
Trader

Gold and Silver Breakout After Jobs ShockFriday’s US jobs report acted as a macro trigger
Not noise
A regime signal
Payrolls printed well below expectations
Labor momentum is cooling faster than policy expected
Markets reacted immediately
✓ Gold pushed into the $4,490 zone
✓ Silver surged toward $79
✓ Weekly momentum confirmed across both metals
Why This Matters
Weak employment data accelerates the path toward rate cuts
That shifts the balance
✓ Real yields fall
✓ Dollar pressure increases
✓ Non yielding assets gain relative strength
This environment historically favors precious metals
Why This Move Has Follow Through
✓ The rate hiking cycle is already over
✓ Inflation has stabilized enough to allow easing
✓ Geopolitical risk remains elevated
✓ Central bank gold accumulation continues
This is structural demand meeting cyclical tailwinds
Silver Is Leading
Silver out performance signals risk appetite within the metals complex
✓ Dual demand from industry and capital flows
✓ Elevated gold silver ratio compressing
✓ Smaller market size amplifies momentum
Historically silver leads during expansionary phases of metals bull cycles
Technical Structure
Gold
✓ Holding breakout above recent consolidation
✓ Prior resistance now acting as support
Silver
✓ Clean expansion from multi week base
✓ Strong acceptance above breakout zone
This is trend continuation behavior not exhaustion
Positioning Insight
Pullbacks into prior breakout zones remain constructive
Invalidation only occurs on sustained acceptance back below support
RB Trading
Educational content only
Risk management required

EURUSD at Major Demand — Is a Multi-Target Recovery Setting Up?EURUSD on H1 has been under sustained bearish pressure, respecting a clear sequence of lower highs and lower lows while trading below the short- and mid-term moving averages. This confirms that the broader short-term structure remains bearish.
However, price has now reached a well-defined support zone around 1.1670–1.1680, where selling momentum has noticeably slowed. The sharp reaction from this level suggests sell-side exhaustion and active buyer defense, indicating that the market may be transitioning from impulsive downside into a corrective recovery phase rather than immediate continuation lower.
At the moment, EURUSD is consolidating just above this support base. While price is still trading below the moving averages — keeping the bearish bias technically valid — the compression at demand opens the door for a mean-reversion move if buyers manage to reclaim key levels.
Bullish scenario: As long as price holds above the 1.1670–1.1680 support zone, a recovery toward Target 1 at 1.1710 becomes likely. Acceptance above this level would open continuation toward Target 2 near 1.1755, with extended upside toward Target 3 around 1.1780.
Bearish scenario: A confirmed breakdown and close below the support zone would invalidate the recovery setup and expose further downside toward 1.1640 and potentially 1.1600.
For now, this is a high-impact decision zone. Patience is key — the safest opportunities will come from confirmation at support or a clean reclaim of resistance, not from chasing price inside consolidation.

BTCUSD WARNING: The Ultimate Bull Trap or a One-Way Ticket......Hello traders! Here’s a clear technical breakdown of BTCUSD (1H) based on the current chart structure.
Market Structure: Bitcoin is currently displaying a textbook bullish trend structure. Following a solid pivot low, the market has transitioned into a series of aggressive impulse moves, characterized by clear Higher Highs (HH) and Higher Lows (HL). The EMA 89 (yellow line) is sloping upward and trending below the price, providing strong dynamic support and confirming that the primary trend remains firmly bullish.
Price Action and Continuation: After the most recent impulse leg, BTCUSD has entered a healthy corrective phase. This pullback is occurring on decreasing volatility, forming what looks like a Bull Flag or an ascending continuation pattern. Crucially, the current pullback is holding well above the previous Higher Low (HL), suggesting that this is a "buy the dip" opportunity for smart money rather than a trend reversal.
Key Levels: The immediate Demand Zone is located around the 93,150 level, which aligns with the current corrective floor and the EMA 89 support. On the upside, the previous Higher High at 94,750 serves as the immediate resistance target.
My Scenario: As long as BTCUSD maintains its structure above the current 93,150 Support Zone, the broader bullish expansion remains the dominant play. I expect a period of accumulation here before an explosive move higher to retest and break the 94,750 peak. However, a decisive close below the EMA 89 would signal a loss of momentum and could open the door for a deeper correction to flush out late longs.
Manage your risk!

EUR/USD Slides as Venezuela Tensions Fuel Dollar Strength EUR/USD Technical Forecast
TICKMILL:EURUSD is trading at $1.1687 on the 4H chart, and after breaking below that rising channel support, it’s now testing the $1.1680-$1.1658 zone. That 200-EMA near $1.1660 is a big deal, because it’s where the next key downside support is – and it’s also where price is looking to head next.
Recent candles have been showing some pretty strong bearish bodies, which is a sign that the bulls are losing control after price rejected near $1.1805 resistance. The prior trendline break is also looking at wearing on the near-term bias, and the next support is at $1.1615. The trade idea is to short the rally near $1.1720 and aim for $1.1620, but set a stop loss above $1.1780.
Market Overview
The dollar has been on a roll for the second day in a row, with the dollar index (DXY) trading around 98.60 during those early European hours. The dollar’s strength is largely due to the renewed safe-haven demand sparked by escalating tensions in Latin America.
The US has reportedly launched a major operation in Venezuela and captured President Nicolás Maduro, sending regional instability into high gear. The situation was only made more uncertain when President Trump warned that possible action could be taken in Colombia, and he went after Mexico and Cuba.
Fed Rate Cut Expectations Continue
Despite the dollar’s strength, the market is still pricing in two or more rate cuts from the Fed by the end of 2026. The Fed did lower rates by a quarter point in December 2025, setting the target range at 3.50%–3.75%, following a total of 75 basis points in cuts during the year.
Notes from the FOMC meeting suggest that more rate cuts could be on the way if inflation continues to decline. Adding to the uncertainty is the looming question of who will be the next Fed chair and what kind of policy that person will implement. All of this is keeping investors on high alert.
Meanwhile, the dollar remains strong due to the safe haven demand, but traders are closely watching key US data, including inflation figures and Friday’s Non-Farm Payrolls, which is expected to come in at 57K – a touch weaker than last month’s 64K. Weaker-than-expected job growth could weigh on the dollar and raise expectations for even more Fed rate cuts.

Buyers Are Back — The Recovery Is Taking ShapeOANDA:XAUUSD has reclaimed the mid-range support after a sharp sell-off and is now building a bullish recovery structure. The bounce from the lower demand zone and the clean gap fill suggest buyers have regained short-term control, shifting momentum back to the upside.
Price is now pressing toward the 4,480–4,500 resistance zone, where reactions are likely. As long as pullbacks remain shallow above support, the structure favors continuation rather than rejection.
Resistance: 4,480 – 4,500, then 4,550
Support: 4,400 – 4,420, then 4,280 – 4,300
➡️ Primary: hold above 4,400 → grind higher → test 4,480–4,500, with potential continuation toward 4,550.
⚠️ Risk: rejection at resistance → pullback toward 4,420 before reassessment.

Gold Is Being Tested at the TopGOLD (XAUUSD) – Daily Structure & Macro Context
Technical Structure (Daily)
On the 1D timeframe, Gold remains in a primary bullish trend, but price action is now clearly hesitating near the previous ATH zone (~4,380–4,400). This area has historically attracted strong supply, and the current behavior confirms that sellers are actively defending it.
Price is still trading inside an ascending channel, respecting the rising trendline from the November lows. However, momentum has slowed notably as candles compress beneath the old ATH, forming overlapping highs and shallow pullbacks rather than clean continuation. This is a classic distribution vs. re-accumulation zone, not an impulsive breakout phase.
Key technical observations:
- Higher highs and higher lows remain intact → macro trend still bullish
- Repeated rejection near old ATH → supply absorption in progress
- EMA structure (34 & 89) remains supportive below → downside currently corrective
A clean daily close above the old ATH would confirm continuation toward new highs. Conversely, failure to hold the rising trendline opens room for a deeper pullback toward the EMA cluster, without invalidating the broader uptrend.
Macro Drivers (What’s influencing Gold now)
1. US Dollar Stabilization
The recent pause in Gold’s advance aligns with a short-term stabilization in the US Dollar. As USD demand temporarily recovers, Gold loses momentum but does not break structure a sign of balance, not weakness.
2. Fed Policy Expectations
Markets continue to price in eventual rate cuts, but the timing remains uncertain. The absence of immediate dovish confirmation from the Fed keeps Gold capped near highs, as traders reduce leverage and wait for clearer signals.
3. Real Yield Sensitivity
While real yields have stopped rising aggressively, they remain elevated enough to slow Gold’s upside acceleration. This creates consolidation rather than reversal.
4. Geopolitical & Risk Hedging Still Present
Despite short-term hesitation, Gold continues to benefit from structural demand as a hedge, which explains why pullbacks remain shallow and well-supported.
Forward Scenarios
Bullish continuation: Acceptance above old ATH → trend expansion resumes
Corrective scenario: Rejection at ATH → pullback toward trendline / EMAs
Invalidation: Only a sustained break below the rising structure would shift the macro bias
Key Takeaway
Gold is not topping out it is being priced under uncertainty.
The market is balancing strong long-term bullish drivers against short-term macro hesitation. This zone is where decisions are made, not where trends end.

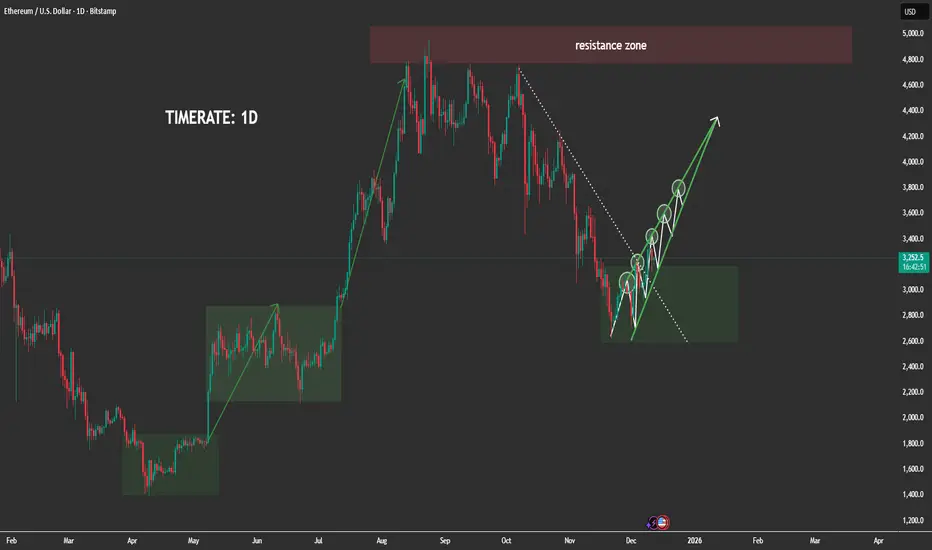
The ETH Move No Trader Is ExpectingETHEREUM 1D MARKET ANALYSIS
1. Current Price Structure
- ETH previously completed a strong bullish impulsive wave, breaking through multiple resistance levels before reaching the major 4,800–5,000 resistance zone, where the market formed a clear distribution top.
-After distribution, price entered a large corrective decline, following the descending dotted trendline visible on your chart.
-Recently, ETH has formed a broad accumulation block (highlighted in green), similar to the previous accumulation phases that triggered massive ETH rallies earlier in the year.
Inside this zone, ETH is now building a series of higher lows, showing early signs of bullish reconstruction.
-The current rising green structure indicates that price is forming a stair-step bullish pattern, preparing for a potential macro reversal.
2. Key Liquidity Zones
-Major Resistance Zone: 4,800–5,000
-This is the next major destination if ETH successfully completes the accumulation and transitions into expansion.
-Accumulation Block: 2,750–3,150
-This is where smart money is currently active — sweeping liquidity, trapping sellers, and accumulating long positions.
-Multiple liquidity grabs have already occurred inside this range, confirming strong institutional absorption.
-The current structure closely mirrors previous accumulation rectangles on the chart that led to massive bullish expansions.
3. Today's Market Scenario (1D Outlook)
Matches perfectly with the upward projection on your chart.
🔹 Main Scenario – Bullish Continuation After Accumulation
ETH is likely to follow this sequence:
-Continue building higher lows inside the accumulation block.
-Retest the inner structure trendline without breaking the macro zone.
-Form a clean break above the descending dotted trendline — signaling a bullish structure shift.
-Retest the broken trendline to form the final higher low.
-Begin expansion to the next major liquidity magnets:
-Short-term targets: 3,600 → 3,800
-Mid-term continuation: 4,200 → 4,500
-Macro target: 4,800–5,000 resistance zone
This is fully aligned with the green arrow projection you drew.
4. Market Psychology
-Big players are actively accumulating within this wide range clear repeated liquidity sweeps prove institutional activity.
-Retail traders are losing positions during sudden spikes and false breakdowns, which is typical behavior during accumulation phases.
-The market is more likely preparing for a major trend reversal, not a continuation downward.
-The price behavior mirrors earlier patterns:
Accumulation → Trendline Break → HL Retest → Massive Expansion
-This repetition increases confidence in the bullish outlook.
5. Intraday Strategy Guidance (1D)
Given the macro accumulation:
-Avoid selling aggressively the probability is against sustained bearish continuation.
-Best opportunities come from buying dips inside the accumulation zone.
-Watch for liquidity sweeps below local lows to identify smart-money entries.
High-probability setups:
✔️ Strategy 1: Buy the Bottom of the Range
Entry zones: 2,750–3,150
Targets: 3,600 → 3,800
✔️ Strategy 2: Buy the Retest After Trendline Breakout
This is the cleanest and safest setup.
Targets: 4,200 → 4,500 → 4,800+
ETH is currently in the prime zone where large investors position themselves before a new bullish cycle.
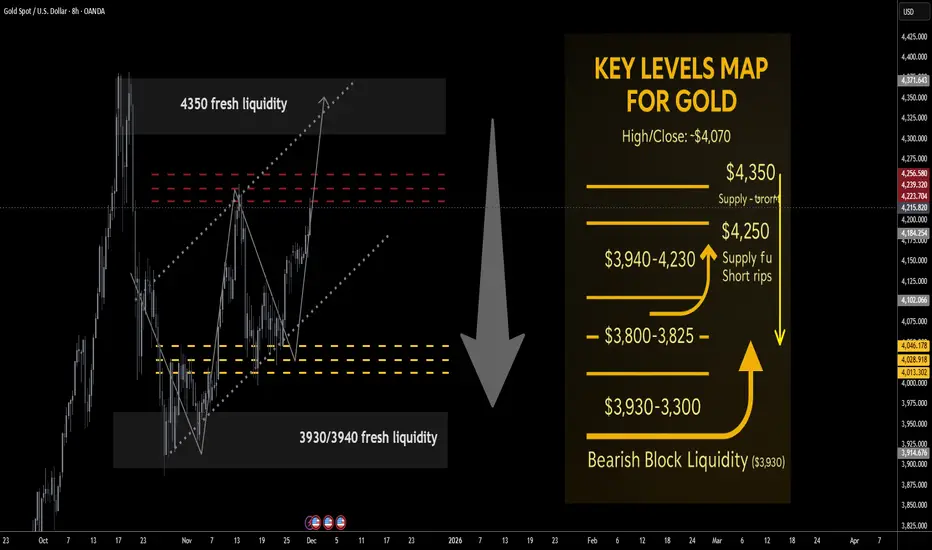
Gold next week Key S/R Levels and Outlook for Traders🔥 GOLD WEEKLY SNAPSHOT — BY PROJECTSYNDICATE
🏆 Swing High / Swing low:
$4,350 → ~$3,930 — clean rejection from the $4,350 bear-liquidity pocket, weekly close back inside prior range and below $4.1k.
📈 Trend:
Structural uptrend still intact above ~$3,900, but near-term momentum has flipped distributive: rallies into $4,250–$4,350 look like supply, not fresh markup. Upside is seen as asymmetric to the downside from overhead resistance.
🛡 Supports:
• $4,060–$4,020: first demand / reaction band below the close.
• $4,000–$3,960: psychological shelf; first downside target on failed rallies.
• $3,940–$3,930: bullish block liquidity — key structural demand; loss of this area risks a deeper de-leveraging leg.
🚧 Resistances:
• $4,200–$4,230: immediate supply from the weekly close; first “sell-the-rip” area.
• $4,250–$4,280: primary bearish liquidity / core short zone.
• $4,300–$4,350: exhaustion band; $4,350 = recent swing high / bear block.
• Stretch: $4,380 prior spike; only expected on an overshoot / stop run.
🧭 Bias Next Week:
Fade strength rather than chase upside.
Base idea: short rips into $4,220–$4,320, scale adds toward $4,350, looking for reversal back into $4,060 → $4,000–$3,960.
• A weekly close above $4,380 would invalidate the short-the-rip bias and open room toward the higher Street targets.
________________________________________
🔝 Key Resistance Zones Short-Side Focus
• $4,200–$4,230: first supply from the weekly close; good area for initial probe shorts.
• $4,250–$4,280: primary bearish liquidity / main take-profit area for trapped late longs.
• $4,300–$4,350: extension / exhaustion band; includes the $4,350 swing high and core “blow-off” liquidity pocket.
• $4,380: prior spike high / stretched stop-run; only expect in a squeeze.
________________________________________
🛡 Support Zones Downside Objectives / Where Shorts Start Covering
• $4,060–$4,020: first reaction band below; scale out partial profits here.
• $4,000–$3,960: key psychological shelf; second profit zone and likely area of responsive dip-buyers.
• $3,940–$3,930: bullish block liquidity; final target for aggressive shorts, and the spot where higher-timeframe bulls are expected to defend. A sustained break below would be a regime change.
________________________________________
⚖️ Base Case Scenario
• Rallies into $4,220–$4,320 encounter selling as late longs de-risk and fresh shorts engage.
• Price fails to sustain above $4,300–$4,350, leaving a wick / rejection on the higher timeframes.
• From there, rotation lower toward $4,060, then $4,000–$3,960 as the primary downside objective.
• Only if the $3,960–$3,930 block cracks cleanly do we start talking about a deeper flush into $3,880–$3,850 as a secondary scenario.
________________________________________
🚀 Breakout / Invalidation Trigger
• Bearish framework invalidation:
o A strong daily/weekly acceptance > $4,380 would suggest bears are trapped and open the door toward $4,450+, in line with the newly raised Street forecasts.
o In that case, shift from short-the-rip to neutral / buy shallow pullbacks until a new top structure forms.
________________________________________
💡 Market Drivers to Watch This Week
• Fed communication and front-end real yields – any hawkish surprise or delay in cuts could extend the correction; dovish surprise risks another squeeze.
• USD index swings around data / politics – sharp dollar bounces favour your short bias from resistance.
• Central-bank headlines (reserve diversification, sanction risk) – supportive in the background but less impactful intraday; use them as context, not trade triggers.
• Geopolitical flare-ups – can create squeezes into your sell zones; be ready for fast spikes into $4,300–$4,350 rather than waiting for slow grinds.
________________________________________
🔓 Bull / Bear Trigger Lines
• Structural bull line:
• Above $3,930–$4,000: long-term bull structure intact; even if you’re tactically shorting rips, treat deep flushes into this band with respect — this is where bigger players are likely accumulating.
• Bear expansion line:
• Below $3,930: opens scope for a faster liquidation wave toward $3,880–$3,850; would indicate that the 2025 blow-off is transitioning toward a broader consolidation or mean-reversion phase.
________________________________________
🧭 Strategy
Use overhead resistance as a place to sell strength, not initiate fresh longs. Expect limited upside and a reversal from liquidity above the market.
1️⃣ Primary Short Setup – Fade the Rips
• Entry zones:
o First scale: $4,220–$4,250
o Add / build: $4,250–$4,280 (primary bear-liquidity block)
o Final add / exhaustion: $4,300–$4,350 (only if tape shows blow-off / stop-run behaviour).
• Stops / invalidation:
o Tactical: hard stop above $4,380.
o More conservative traders can run a soft line at $4,350 and hard stop just beyond $4,380.
• Targets:
o TP1: $4,060–$4,020
o TP2: $4,000–$3,960
o Stretch TP3 (runner): $3,940–$3,930 bullish block.
________________________________________
🌍 Macro Tailwinds
• • Policy / Real Yields
Markets are leaning into lower US real rates and more cuts through 2026, with talk of “fiscal dominance” and persistent deficits. This keeps the medium-term backdrop supportive for gold even after the parabolic run.
• • FX / USD Dynamics
A softer, more volatile dollar driven by rate-cut expectations and concerns over US fiscal sustainability continues to underpin gold on dips, even if short-term dollar squeezes can trigger sharp pullbacks.
• • Flows: Central Banks Still the Backbone
Central banks remain heavy net buyers, with H1 and Q3 data showing robust additions and EM reserve managers diversifying away from sanction-risk USD assets. Recent commentary links record highs to this central-bank bid plus tight physical markets.
• • Flows: ETF & Investor Participation
After several years of outflows, ETF demand has turned back to net inflows, adding to central-bank buying and reinforcing the idea of a higher structural floor in the ~$3.9k area even after corrections.
• • Geopolitics & Safe-Haven Premium
Gold’s 2025 surge is still anchored in elevated geopolitical risk (Russia–NATO tensions, US–China frictions, tariff headlines), plus anxiety about frozen reserves and sanctions. This keeps the safety bid sticky even when positioning looks crowded.
• ________________________________________
XAU/USD – Entry Analysis (H4)📈 XAU/USD – Entry Analysis (H4)
Our previous analysis didn’t quite reach the entry point, but the market structure is still developing nicely, and now we have a clean, rule-based long setup on the H4 timeframe.
After the CHoCH, price broke to the upside and is now expected to pull back into the FVG + Order Block zone. These two POIs align perfectly, increasing the probability that the market will collect liquidity here before continuing higher.
🎯 Entry Setup
Buy limit: 4086
Stop loss: 4062
Take profit: 4160
RRR: excellent, close to 1:3
🧠 Position Management
Once price reaches the 50% RR level (around 4123):
➡️ close 50% of the position
➡️ move the remaining stop loss to break even (4086)
This removes all risk from the trade while allowing the rest to run toward the main target at 4160.

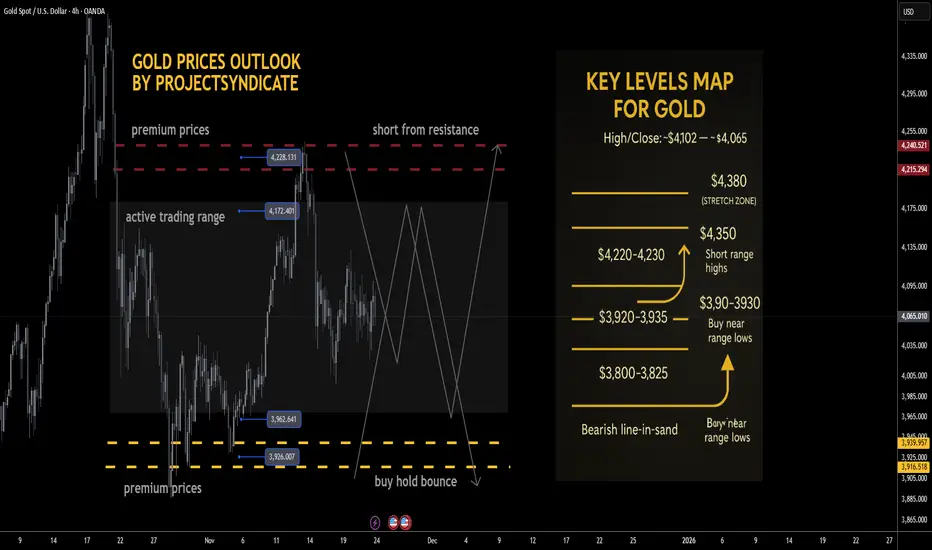
Gold next week: Key S/R Levels and Outlook for Traders🔥 GOLD WEEKLY SNAPSHOT — BY PROJECTSYNDICATE 🏆
High/Close: ~$4,102 → ~$4,065 — tight, inside-feel week with price holding comfortably above the $4,000 handle. Flows look balanced: steady two-way interest, but no strong directional conviction as the market oscillates within a well-defined range.
________________________________________
📈 Trend:
Still bullish on the higher timeframe, but very clearly in range / two-way mode. As long as we’re capped below the $4,350–4,375 ATH supply block and holding above the $3,900s, the playbook remains “range-trade the extremes” rather than chase breakouts.
________________________________________
🛡 Supports Buy Zones
• $3,920–3,930 — key range lows / primary dip zone:
o Your preferred “buy low” area; recent reactions show responsive buyers defending this shelf.
o This is the first major liquidity pocket for range longs and a natural first target for shorts from resistance.
• $3,800–3,825 — deeper demand pocket / fail-safe shelf:
o Secondary, more extreme downside area where higher-timeframe dip-buyers are likely to step in.
o A clean break and daily close below here would suggest the range is failing and a deeper mean reversion is in play, not just a normal pullback.
________________________________________
🚧 Resistances Short Zones
• $4,220–4,230 — immediate range resistance / short-sell zone:
o Your core “short from resistance” idea; this band remains a logical area to fade strength.
o First tests into this region are attractive for tactical shorts, especially if intraday momentum is stalling.
• $4,350–4,375 — ATH heavy resistance block:
o Still the major supply area above.
o Any spike here is a fade candidate unless price starts accepting above it with strong volume and multiple daily closes.
________________________________________
🧭 Bias – Coming Weeks
Base expectation is continued range-bounce price action between roughly $3,920–$4,220, with the broader structure still nested inside the larger $3,800–$4,350 range:
• Preference to fade strength into $4,220–4,230, targeting rotations back toward $3,920–3,930.
• Conversely, buy dips into $3,920–3,930 for moves back toward $4,220–4,230, as long as we hold the $3,800 shelf on a closing basis.
• Invalidation of the “range grind” idea comes on:
o Sustained acceptance above $4,350–4,375 (turns it back into trend-up).
o Or a decisive loss of $3,800–3,825 (opens a deeper corrective leg).
________________________________________
🔝 Key Resistance Zones
• $4,220–4,230 — front-line ceiling; aligns with your tactical short-sell band. Strong candidate to initiate shorts on first, clean tests.
• $4,350–4,375 — prior ATH / macro supply block. Only flips from “sell zone” to “bullish continuation base” if reclaimed and held as support.
🛡 Support Zones
• $3,920–3,930 — primary range low and first major liquidity shelf; ideal first take-profit for shorts and main dip-buy area.
• $3,800–3,825 — deeper support; loss of this level changes the narrative from “sideways digestion” to “larger corrective structure.”
________________________________________
⚖️ Base Case Scenario – Range / Consolidation
Core view: Market continues to oscillate between $3,920–$4,220, within the broader $3,800–$4,350 band.
• Pushes into $4,220–4,230 are sellable for rotations back toward $3,920–3,930.
• Dips into $3,920–3,930 are buyable for rotations back toward $4,220–4,230, as long as structure and flows remain balanced.
• While weekly closes keep rejecting the $4,350–4,375 ATH block, the default remains “sell strength, buy clean range lows.”
________________________________________
🚀 Breakout / Breakdown Triggers
• Bull trigger:
o Sustained acceptance above $4,350–$4,375, with multiple daily closes holding above and that band starting to act as support.
o That would shift tone from “range trading” back to full-on bullish trend, reopening path toward and beyond prior extremes (~$4,400+ in your framework).
• Bear trigger:
o A decisive daily close below $3,800 converts the current “healthy sideways correction” into a deeper, more directional liquidation phase, likely targeting prior lower shelves and expanding volatility.
________________________________________
💡 Market Drivers to Watch
Even in a range, macro and flow catalysts dictate which side of the range gets tested first:
• Real yields & Fed path: Any hawkish repricing or upside surprise in data tends to cap rallies near resistance; dovish shifts / easing fears support the lower end of the range.
• U.S. fiscal / political noise: Episodes of stress typically underpin gold; temporary relief or “risk-on” swings can blunt upside and push price back toward range lows.
• Flows & positioning: After a massive secular run, fast money continues to fade extremes, locking in profits into strength and reloading near range lows.
• Cross-asset behavior: If risk-off hits and gold fails to catch a bid (selling alongside equities), expect deeper probes into the lower end of the range before strategic buyers step back in size.
________________________________________
🔓 Bull / Bear Trigger Lines
• Bullish above: $4,350–$4,375 (sustained acceptance; ATH block reclaimed and used as support).
• Bearish below: $3,800 (shifts from contained range to deeper correction regime).
________________________________________
🧭 Strategy – Focus on Trading the Range
Primary plan – short from resistance (core idea):
• Entry zone:
o Scale into shorts around $4,220–$4,230 (front edge of resistance).
• TP #1:
o $3,920–$3,930 — key range lows; logical place to close majority of the short.
• Runner / extension:
o Leave a runner targeting $3,800–$3,825 if momentum and macro tone turn heavier.
• Risk / invalidation:
o Hard invalidation if price accepts above $4,350–$4,375 (multiple daily closes and successful retests from above).
________________________________________
Alternative plan – buy low from key range lows:
• Entry zone:
o Stagger bids in $3,920–$3,930; add more aggressive size only if we see responsive buying and positive reaction there.
o Optional deeper add zone at $3,800–$3,825 for higher conviction swing longs if structure still looks constructive.
• Exit zone / targets:
o First target back into $4,220–$4,230; heavily de-risk or fully exit as we approach that band.
• Risk management:
o Cut or significantly reduce longs on a daily close below $3,800 or if price accelerates through that shelf on high volume.
XAUUSDbased on tecnical only the breakout and creating new low or high will have the new confirmation what gold really up to? considering as an this week gold had played side ways and din break the inside resistent and support. lets see how gold close as weekly candle.
clear draw on the chart so take a good look and understand.
what you think leave a your comment below.

BTCUSDwhat a hug drop base drop, as my analysis i see continustion drop on btcusd after the confermation or next (nfp) as i have draw some on chart it may help to understand that support and liquidity and new low has been created, now pull back..
let me know what you all thinking drop your comment .
safe trade,

AMGN: the medicine cabinet for your portfolioOn the weekly chart, Amgen (AMGN) trades at $289.56, holding above the key $272–280 support zone, aligned with the 0.705–0.79 Fibo levels. This area forms a clear buy zone, where buyers are likely to step in. The technical structure remains bullish: the uptrend is intact, with targets at $346.85, matching historical highs and the upper boundary of the formation. Price currently sits near the lower part of the range, where volume accumulation could fuel the next upward move.
Fundamentally , Amgen stands as a biotech heavyweight: its drug portfolio remains strong, late-stage pipeline candidates progress steadily, and recent earnings showed stable revenue and profit growth. Investors treat the stock as a defensive asset amid market volatility, with biotechnology demand remaining largely cycle-independent. Additionally, institutional funds have been accumulating positions, providing further support.
Tactically , the $272–280 zone is critical: holding it preserves the bullish scenario. Should the bounce continue, the targets shift to $300 and $346.85. While a retest of support is possible, the broader structure remains upward.
Amgen stays true to its name - when the market is sick, this stock has the cure.

BTCUSD – 1D FVG Retest Completed | BTC is showing classic bearish continuation structure after failing to reclaim the 1D Fair Value Gap (FVG) and rejecting cleanly from the imbalance zone.
Price is now sitting just above the key support around $92,825, and this level is acting as the final line before a larger macro sell-off begins.
📌 Key Points From the Chart
1️⃣ 1D FVG Rejection (Primary Bearish Signal)
Price tapped directly into the purple 1D FVG, showing a wick-to-wick mitigation.
The rejection from this area confirms:
✔️ Smart Money filling inefficiency
✔️ No bullish displacement
✔️ Supply still in full control
This is a textbook continuation pattern in a downtrend.
2️⃣ $92,825 – Last Support Before Breakdown
This level has been tested multiple times, making it both:
➡️ Major psychological level
➡️ Short-term liquidity pool
If price holds below this zone → bearish momentum accelerates.
3️⃣ Liquidity Sweeps Expected Before Breakdown
The projected path shows:
A slight push up into local liquidity
Quick rejection
Break of structure
Continuation towards macro demand
This pattern often appears before strong dumps.
4️⃣ HTF Trend Still Bearish
Both structure and momentum indicate:
🔻 Lower highs
🔻 Lower lows
🔻 No bullish displacement
🔻 No HTF demand breakup
BTC remains in a distribution / markdown phase.
5️⃣ Next Macro Target → $86,145
This is where:
✔️ HTF liquidity rests
✔️ Major demand zone sits
✔️ Previous inefficiency aligns
This level is extremely attractive for Smart Money.
📉 Summary
BTC remains bearish unless bulls break back above the 1D FVG.
Rejecting from imbalance + losing $92,825 = clear path towards $86,145.

Gold’s Next Explosive Move: The Chart No One Is Talking About...Important assumption (stated clearly): I do not have the image of your exact chart or the numeric value of the blue-line target, so this analysis assumes the blue-line target is above today’s spot level and represents a meaningful resistance/target on the weekly/monthly timeframe. If your target is below current price the technical story flips — tell me the exact value or upload the chart and I’ll adapt.
---
Executive summary — the short thesis
Gold’s move toward the blue-line target is plausible because three mutually reinforcing themes are in play:
1. Macro tailwinds (inflation persistence + lower real rates expectation → higher gold demand),
2. Structural demand (central bank buying + ETF/institutional accumulation), and
3. Technical breakout dynamics (momentum, volume confirmation, and common extension targets).
Each theme alone can push price higher; together they create a high-probability path to the blue line — but risks (real yield rebounds, USD strength, rapid risk-on reversals) can abort or delay the move.
---
1) Macro and policy drivers (why gold wants to be higher)
Real interest rates are the single most important macro control on gold. Lower or falling real yields reduce the opportunity cost of holding non-yielding gold, improving gold’s appeal as an inflation hedge. Markets are pricing a path toward easier policy (or lower terminal rates) and that compresses real yields — a pro-gold environment.
Inflation expectations and uncertainty remain elevated. Where inflation expectations stay sticky, investors and treasuries use gold as insurance. If headline or core inflation surprises on the upside, that directly supports continued buying.
Geopolitical & risk-off shocks amplify the move. Any escalation in geopolitical risk (trade tensions, regional conflicts) increases safe-haven demand and often triggers large, fast price jumps.
(Load-bearing facts for this section: central bank buying, inflation drivers, Fed expectations — see cited institutional and market commentary.)
---
2) Structural demand and flows (why the rally can be sustained)
Central banks continue to add to reserves. Persistent, sizeable purchases by official buyers create a structural bid that is different from short-term spec flows — it’s long-dated accumulation. That reduces available supply for investors and supports higher levels over months/years.
ETF and institutional flows are material. Record or heavy inflows into gold ETFs and funds add persistent buying pressure; large inflows can sustain rallies beyond purely technical breakouts.
Retail and seasonal physical demand can reinforce rallies. Jewelry seasons and retail demand (Asia, Middle East) often coincide with price momentum, adding a final push toward technical targets.
---
3) Technical structure — how price actually gets to the blue line
(I’m speaking generically because I don’t have the exact chart; apply these to your time frame — weekly or daily — whichever your blue line sits on.)
Breakout + retest dynamic: If price has broken a multi-week/month resistance (or important swing high) and then retested it successfully with rising volume, the path to the next measured target (often a measured move or Fibonacci extension) becomes much more likely. Traders and algos use these confirmations to add size.
Momentum and moving-average alignment: A stack of moving averages (e.g., 50 crossing above 200 — a "golden cross" on longer timeframes) plus rising RSI and MACD momentum supports an extended impulse leg toward the blue-line.
Volume & open interest: Increasing cash/spot volume and rising futures open interest on advances indicates real participation (not just short covering). That structural participation reduces the chance of a quick reversal and helps sustain a push toward obvious targets like your blue line.
Common extension targets: Traders commonly use Fibonacci extensions (127–161.8%), prior range height projections, or measured moves from consolidation to set the “blue line” style targets. If the blue line aligns with one of these projections, it gains legitimacy as a target because many actors place orders there.
---
4) Market structure and supply-side constraints
Physical mine supply is relatively inelastic short term. Mines can’t quickly add meaningful tonnage, so when demand surges, price adjusts more than quantity. Capital spending and long lead times for new production create upward pressure if demand remains strong.
Scrap supply is cyclical and price-sensitive. As prices rise, scrap supply can increase, capping upside — but that often lags price moves, letting gold run first then supply grow later.
---
5) Alternative scenarios — what would stop it
Real yields rebound fast: A surprise hawkish central bank reaction or unexpectedly strong employment/inflation data could push real yields higher and crush the rally.
US dollar strength returns: A sharp USD rally would subtract from USD-priced gold and can stop a run toward the blue line.
Flow exhaustion / profit taking: If ETF flows stall and positioning becomes one-sided, a volatility spike could trigger a fast unwind.
---
6) Probability framing & tactical checklist (how I’d watch it as an analyst)
High-probability signals that validate the path to the blue line:
Spot > key resistance with a clean retest and higher-than-average volume.
Open interest in futures rising alongside price (not diverging).
Continued central bank purchases / ETF inflows reported weekly.
Macro path: market pricing of Fed easing or lower terminal rates, or at least declining real yields.
Warning flags: real yields spike > 50–75 bps, USD index sharply higher, or a sudden halt/ reversal in ETF flows.
---
Concrete near-term scenarios (example probability splits, adapt to your time frame)
Base case (45–55%): Macros stay supportive, technical breakout consolidates — price reaches the blue line over several weeks. (Most likely if volume and flows continue.)
Bull case (20–25%): Macro shock (big geopolitical event or accelerating inflation surprise) causes an overshoot beyond the blue line — fast, big move.
Bear / failed breakout (25–35%): Real yields rebound or flows reverse; price fails to sustain above resistance and falls back to prior support.
---
Practical phrasing you can post under the chart (English, professional + share CTA)
> Market-leading analysis (professional):
The blue-line target is a natural extension of the current multi-month breakout. Macro conditions — persistent inflation expectations, lower real yields priced by markets, and ongoing central-bank accumulation — create a structural bid. Technically, a confirmed breakout with rising volume and expanding open interest will propel price toward the blue line; Fibonacci and measured-move projections align with this target, increasing its credibility. Counter-risks are a rapid rebound in real yields or a stronger USD, which would likely stop or reverse the move. This is an analysis, not investment advice — monitor real yields, ETF flows and the breakout retest for live confirmation.
Like and comment — tell me your view and what time-frame you want me to focus on.
AUDUSD FRGNT Daily Forecast -Q4 | W46 | D14 | Y25 |📅 Q4 | W46 | D14 | Y25 |
📊 AUDUSD FRGNT Daily Forecast
FRGNT FUN COUPON FRIDAY
🔍 Analysis Approach:
I’m applying Smart Money Concepts, focusing on:
Identifying Points of Interest on the Higher Time Frames (HTFs) 🕰️
Using those POIs to define a clear trading range 📐
Refining those zones on Lower Time Frames (LTFs) 🔎
Waiting for a Break of Structure (BoS) for confirmation ✅
This method allows me to stay precise, disciplined, and aligned with the market narrative, rather than chasing price.
💡 My Motto:
"Capital management, discipline, and consistency in your trading edge."
A positive risk-to-reward ratio, paired with a high win rate, is the backbone of any solid trading plan 📈🔐
⚠️ Losses?
They’re part of the mathematical game of trading 🎲
They don’t define you — they’re necessary, they happen, and we move forward 📊➡️
🙏 I appreciate you taking the time to review my Daily Forecast.
Stay sharp, stay consistent, and protect your capital
— FRNGT 🚀
OANDA:AUDUSD

Mastering Market Momentum with ONE IndicatorLearn how to use the 21 EMA like a pro!
This video walks you through the exact setup I use — plus a unique twist that helps identify momentum shifts and reversals earlier than most traders spot them.
Whether you’re day trading or swing trading, this indicator can become your foundation for better trade timing.
Like and Follow For more Tutorials and Analysis Friends!

Long SolanaTrading Fam,
Received a buy signal from my indicator on Solana the other day. Inside a nice liquidity block, above the 200/350 SMA, and inside a bullish triangle. I'll easily take this trade all day. But with the crypto market continually disappointing, I am not going to risk more than an 8% loss here. Shooting for a target of around 32% profits brings my rrr to a 1:4. Best of luck!
✌️Stew

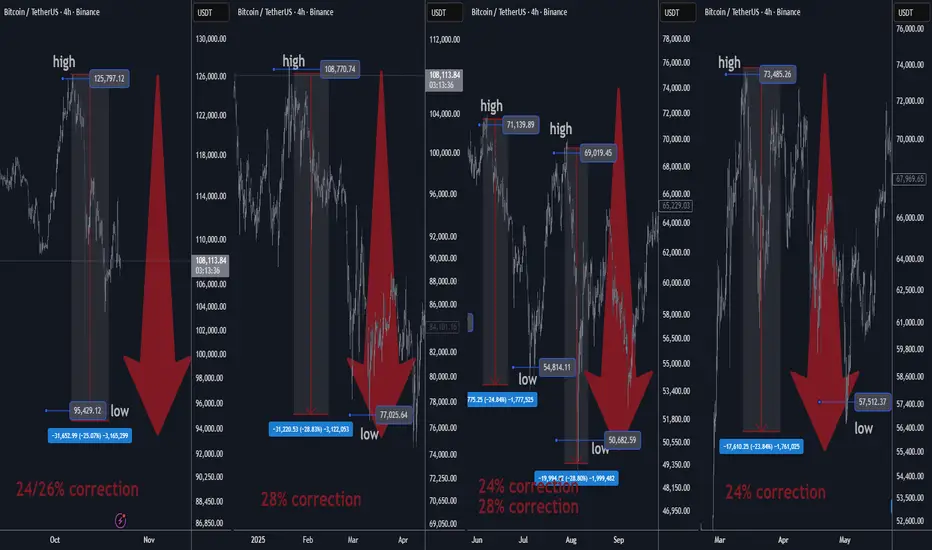
BTC High Probability Forecast Based on Real Math Bitcoin has repeatedly corrected ~mid-20% during the last 12–24 months. Using this empirical drawdown profile, a base-case correction of ~25% from a recent $126,000 high implies a **probable correction low near $94,500–$95,000.
This is a high probability forecast based on real math and stats, not science
fiction. No expanding triangles, Elliott Wave counts, Wolfe and Dragon patterns.
Bitcoin does not trade by the textbook. This is real world TA by a pro trader.
Tactical view: Expect a final flush toward ~$95k, then a reversal/bounce if market structure and liquidity conditions confirm.
Confidence: VERY HIGH —pattern consistency is notable, but crypto remains headline- and liquidity-sensitive. Use disciplined risk controls. 🧠
2) Recent Corrections (Past 12–24 Months)
# High → Low % Drawdown
1 $72,000 → $54,000 25%
2 $108,000 → $76,000 28%
3 $70,000 → $50,000 28%
4 $74,000 → $56,000 24%
Empirical mean drawdown:
(25+28+28+24)÷4 = 26.25%.
We’ll use 25% as the base-case assumption (conservative vs. the 26.25% mean). ✅
Projection for the Current Correction
Reference high: $126,000
Base-case (25%) low:
$126,000 × (1 − 0.25) = $94,500
Empirical-mean (26.25%) low:
$126,000 × (1 − 0.2625) = $92,925
Projected buy-zone: $92.9k – $95k, centered near $95k. 🎯

Gold Market Update: Correction Mode 3750/3500 USD possible🟡 Where We Are Right now
After ripping to fresh records, gold snapped hard — WSJ logged the steepest one-day loss in years last week and a follow-through weekly drop as longs unwound.
Analysts across Kitco and others frame this as a technical/positioning correction after a parabolic run, with a fight around the $4k handle and scope to probe $3,750 → $3,500 if selling persists.
Sentiment/flows flipped: GLD and other gold ETFs saw notable outflows into the selloff after heavy YTD inflows. That flow reversal is consistent with a near-term correction phase.
🔻 Why the Market Is Correcting Now
1️⃣ Positioning & Froth Unwinds
The rally attracted outsized speculative length; once momentum cracked, forced de-risking kicked in. WSJ called out “long unwind” dynamics; Kitco says the correction could persist for months as near-term drivers fade.
2️⃣ $4k Failed on First Retest; Technical Break Triggered Stops
Kitco flagged a “fight for $4k” with downside risk if that shelf gives. Once sub-4k prints hit, systematic sellers likely accelerated.
3️⃣ Flow Flip in ETFs
After massive 2025 inflows, GLD posted a sharp daily outflow during the drop — classic late-cycle reversal behavior for a momentum move.
4️⃣ Macro Balance Less Supportive at the Margin
Even with long-term tailwinds (deficits/geopolitics), the recent leg higher ran ahead of fundamentals. Kitco and others note easing physical tightness and cooling central-bank buying pace compared with earlier in the year, removing a key prop for spot.
⚙️ Near-Term Levels That Matter (Tactical)
$4,000 → Battle zone. Regaining and holding above turns near-term tone neutral.
$3,750 → First meaningful downside target; aligns with multiple analysts’ “healthy pullback” zone.
$3,500 → Deeper correction magnet if flows/positioning continue to bleed; widely discussed as a plausible washout level.
🔮 4–8 Week Catalyst Map (What Can Push Price)
🏛️ Macro / Policy
Treasury Quarterly Refunding (Nov 5): Mix/size guidance can sway the long-end, USD, and real yields — key for gold. A heavier bill tilt (and steady coupons) is less threatening than a surprise coupon ramp.
Fed Communication Cadence: With the Oct 28–29 FOMC just occurred, watch minutes (Nov 19) + any guidance shifts. A less-dovish tone or firmer real yields = near-term headwind; growth scares or easing bias = support.
US Data Prints: CPI/PCE, NFP, ISM — anything that re-prices the path of real rates. (Direction of real yields remains the single most important macro input.)
💰 Flows & Positioning
ETF Flows (GLD/IAU): Continued outflows would confirm distribution; a turn back to net inflows often leads price inflections.
COT Positioning: If spec length compresses materially, downside fuel diminishes — setting up a cleaner base. (Track weekly CFTC updates.)
🪙 Physical / Seasonal
India Demand (festive/wedding season) and China retail demand can stabilize spot if discounts narrow and premiums re-emerge, but Kitco notes near-term tightness has eased versus the squeeze earlier in the rally.
📈 Base Case Outlook (Next 4–8 Weeks)
Trend: We’re in a bull-market correction — momentum currently with sellers — inside a bigger, intact secular uptrend. WSJ + Kitco both frame it as a technical consolidation after a near-vertical ascent.
Range Expectation: $3,500–$4,100 with whipsaws around $4k. The market likely tests $3,750 and could overshoot to $3,500 on negative macro surprises or persistent outflows before attempting a higher-low base.
Bull Re-acceleration Triggers:
(a) USD/real-yield rollover post-Refunding/Fed minutes
(b) A visible reversal in ETF flows
(c) Stabilization in Asia physical premiums
(d) Fresh geopolitical shocks
Bear Extension Risks:
(a) Firmer real yields / stronger USD
(b) Deeper ETF outflows and CTA/systematic supply
(c) Evidence of slower central-bank demand than H1
(d) Soft physical uptake into dips
⚔️ Trade / Hedge Tactics
If Underweight/Flat:
Stagger bids $3,760 → $3,520, scale size smaller into weakness; insist on confirmation (stops above prior day’s high) before adding.
If Long From Higher:
Respect $3,750 — below it, tighten or partially hedge (short miners, long USD vs. FX beta, or buy short-dated puts) targeting $3,500 as a potential flush.
If Momentum Trader:
Let $4,000 decide regime. Sustained reclaims with rising on-balance volume/ETF creations = green light for a bounce to $4,080–$4,150; failure = fade rallies into $3,950–$3,980.
🧭 What I’m Watching Day-to-Day
1️⃣ Treasury refunding headlines (Nov 5) and term-premium reaction.
2️⃣ Fed minutes (Nov 19) and any shift in balance-of-risks language.
3️⃣ GLD/IAU flow tape (creations/redemptions).
4️⃣ Kitco/WSJ desk color on physical tightness and dealer inventories.

Long TronTrading Fam,
A rare buy signal was given a few days ago by my indicator. Tron is one of the few altcoins that remains above the 350 SMA, while at the same time, BTC.D is currently below the 350 SMA.
Additionally, you can see that Tron is testing the bottom side of our triangle. I am expecting a bounce from here to go back up to the top. If we break, I have my target set at .37, though we could go as high as .40 cents with a breakout.
You can see we are in a large buy-side liquidity block, meaning there are a lot of institutional buyer at this level.
Finally, you can see that red 200 dma, which will also help support price should we get that low.
All this being said, this is a higher risk trade since most alts are obviously in a local downtrend. Therefore, I am not willing to take more than a 5% loss on the trade.
✌️Stew
