GBPUSD Institutional Levels: Sell 1.3490 → Buy 1.3360🔱 GBPUSD WEEKLY SNAPSHOT — EXECUTIVE SUMMARY
✨ GBPUSD trading inside a liquidity-driven range with expansion risk
🔄 Current environment: balanced → reactive, awaiting liquidity taps
🧱 Fresh sell-side liquidity / sell zones (premium):
• 1.3460
• 1.3490 upper premium / stop-rich zone
🟢 Fresh buy-side liquidity / buy zones (discount):
• 1.3390
• 1.3360 deeper draw / max pain zone
📉 Price currently oscillating between fresh liquidity pools, not trending
🧠 Both sides are unmitigated → clean reactions likely on first touch
⚖️ Market favors mean-reversion trades until a liquidity sweep occurs
🎯 Expect sharp reactions, not chop, at marked levels
⚠️ Bias is conditional, not directional:
• Above mid-range → sellers gain control
• Below mid-range → buyers gain control
🎯 Recommended strategy:
👉 Buy from fresh buy-side liquidity
👉 Sell from fresh sell-side liquidity
🗳️ GBPUSD WEEKLY SCENARIOS — WHAT’S YOUR PLAY?
Which path do you expect for GBPUSD this week?
🅰️ Tap 1.3460–1.3490 → sharp rejection → move back into range
🅱️ Sweep 1.3360 → strong bounce → rotation higher
🅲 Full range sweep (both sides) → expansion next
🅳 Your level: drop ONE price you’re watching most 👇
________________________________________
🧠 GBPUSD MARKET LOGIC — Institutional Read
• Liquidity is stacked symmetrically above and below current price
• No strong acceptance yet → algos farming both sides
• First touch of fresh liquidity = highest R:R
• Repeated taps weaken the zone → wait for displacement
• Expansion likely after one side is fully swept
________________________________________
⏳ EXPECTATIONS GOING INTO THE WEEK
⬆️ Rallies into 1.3460–1.3490
→ Watch for rejection, displacement, or failure to accept
→ Favor sell-side reactions
⬇️ Drops into 1.3390–1.3360
→ Watch for absorption, divergence, or strong wicks
→ Favor buy-side reactions
🧨 A clean sweep + acceptance beyond either extreme
→ Signals range resolution & new directional leg
Traders

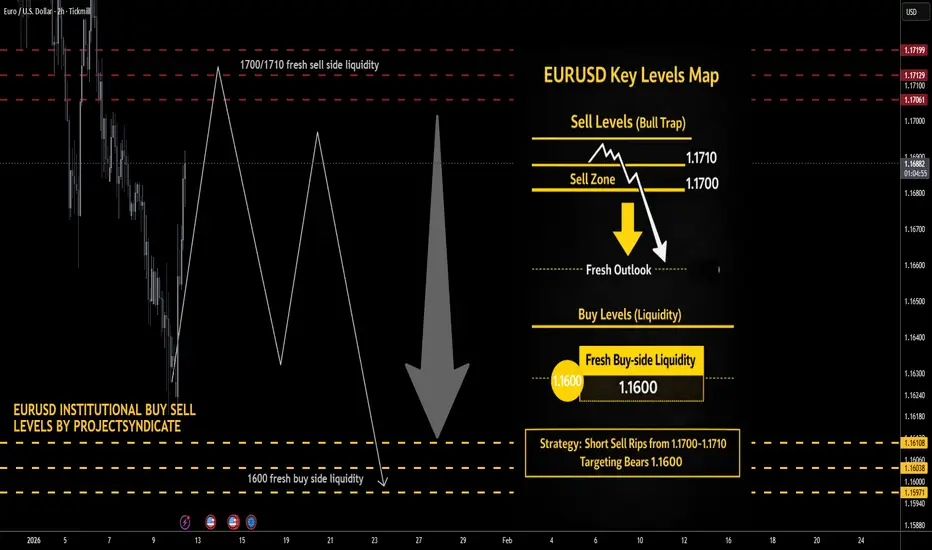
EURUSD Liquidity Trap Short: Sweep 1.1700–1.1710 → Sell the Rip🔱 EURUSD WEEKLY SNAPSHOT — EXECUTIVE SUMMARY
✨ EURUSD positioned in a sell-the-rip environment
📍 Current context: price is below your premium sell liquidity pocket, favoring corrective rallies into resistance
🧱 Fresh sell-side liquidity: 1.1700 – 1.1710
💧 Fresh buy-side liquidity: 1.1600
📉 Bias: bearish while price fails to accept above 1.1710
⏳ Expectation: rallies get capped into 1.1700–1.1710 then delivery toward 1.1600
⚠️ Invalidation: sustained acceptance above 1.1710
🎯 Downside liquidity target this week
• Primary TP and full exit: 1.1600
🎯 Strategy: short sell rips into overhead resistance
🏦 Larger accumulation is more likely only after liquidity is swept near or below 1.1600
________________________________________
🧠 EURUSD MARKET LOGIC — Institutional Read
• Sellers defend premium zones, buyers are reactive
• Upside without acceptance is distribution
• The clean narrative is premium liquidity tap then bearish shift then delivery to 1.1600
• Expect volatility spikes around scheduled macro events this week, plan entries with confirmation
________________________________________
🎯 EXECUTION PLAN — SHORT FROM OVERHEAD RESISTANCE
✅ Entry zone: 1.1700 – 1.1710
Trigger options, pick one
1. Sweep above 1.1700–1.1710 then sharp rejection and close back below 1.1700
2. Lower timeframe market structure shift bearish after tapping the zone, then sell the retest
3. Tap zone then strong bearish displacement candle, enter on pullback into that move
🛑 Risk control
• Hard invalidation: sustained acceptance above 1.1710
• Practical stop placement: above 1.1720–1.1730 to allow for stop hunts
🎯 Take profit
• Full exit: 1.1600
Optional management
• Partial de-risk at intermediate supports on the way down, then trail toward 1.1600
________________________________________
🗳️ EURUSD WEEKLY SCENARIOS — WHAT’S YOUR PLAY
Which path do you expect for EURUSD this week?
🅰️ Tags 1.1700–1.1710 then rejects cleanly then sells off to 1.1600
🅱️ Range grind below 1.1700 then liquidity builds then breakdown to 1.1600
🅲 Wick above 1.1710 bull trap then sharp rejection then impulsive drop to 1.1600
🅳 Your level: drop ONE price you’re watching most this week
________________________________________
🧩 LEVELS QUIZ — EURUSD TRADERS
1. If you’re bearish and want to short from premium, which zone is the best sell idea this week
A 1.1600
B 1.1700–1.1710
C 1.1500
2. What level is the planned full exit and liquidity draw
A 1.1710
B 1.1660
C 1.1600
3. What behavior most strongly invalidates the short idea
A Quick wick above 1.1710 then back below
B Sustained acceptance above 1.1710
C Slow drift down from 1.1680
4. True or False
A sweep into 1.1710 followed by a bearish close back under 1.1700 is a high-quality short trigger
Reply with your answers like this 1B 2C 3B 4True
Ethereum Is Building a Base — Accumulation Before...FLYEthereum is currently transitioning from a strong bearish impulse into a clear accumulation phase, as shown on the 1-hour timeframe. After an aggressive sell-off from the highs, price has slowed down significantly and begun to compress within a defined range, suggesting that distribution has paused and the market is absorbing sell pressure.
1. Market Structure & Context
- ETH previously respected a bearish structure, trading below the EMA and printing lower highs.
- However, the recent price action shows loss of bearish momentum: candles are overlapping, ranges are tightening, and volatility is contracting.
This behavior is typical of accumulation, especially after a strong markdown.
2. Key Zones on the Chart
- Support Zone: ~3,060–3,080
This zone has been tested multiple times with strong rejection, indicating buyers are actively defending this level.
- Accumulation Range: ~3,080–3,180
Price is rotating inside this box, building liquidity on both sides.
- Upper Resistance / Range High: ~3,160–3,180
A break and acceptance above this level would confirm bullish intent.
3. EMA & Momentum Insight
- Price is currently interacting with the EMA 50, which is flattening — another sign of trend transition, not continuation.
- The failure to aggressively break below the EMA after multiple attempts suggests selling pressure is weakening.
4. Scenario Outlook
Bullish Scenario (Primary):
A successful hold above the support zone, followed by a breakout and acceptance above 3,180, could trigger an expansion toward: 3,240 - 3,280 (next major liquidity target)
Bearish Invalidation:
A strong breakdown and close below 3,060 would invalidate the accumulation idea and reopen downside risk.
5. Trading Plan
Avoid trading inside the middle of the range.
Focus on:
- Longs after confirmed breakout above range high
- Or reaction trades at support with clear bullish confirmation
- Patience is key accumulation phases reward discipline, not anticipation.
Conclusion
Ethereum is no longer trending it is preparing. The current structure favors a range-to-expansion model, where smart money builds positions quietly before the next directional move. Until price leaves the accumulation box, expect choppy conditions — but once it breaks, the move is likely to be decisive.
💬 Do you see ETH breaking up from this range, or is this just a pause before another leg down? Let’s hear your view.

Gold at a Liquidity Crossroads — Expansion or Breakdown IncomingGold (XAUUSD) on H1 is currently trading inside a well defined liquidity price range, following a strong bullish expansion earlier in the week. That impulsive rally confirmed buyer dominance, but recent price action shows momentum has slowed, with the market now entering a distribution and decision phase.
Price is consolidating around the mid range near 4,460, closely aligned with the short-term moving average. This area acts as equilibrium not an ideal zone for aggressive entries as liquidity is building on both sides of the range.
The lower boundary of the structure sits around 4,408, marking a critical support and liquidity sweep zone. A clean break below this level would signal a range failure and open the door for a deeper bearish expansion toward 4,350.
On the upside, the upper boundary and key target remain near 4,545–4,550, where previous highs and resting liquidity are located. Acceptance above this area would confirm bullish continuation and trend resumption.
Bullish scenario: As long as price holds above the 4,408 support, buyers may attempt a push higher. A clean break and acceptance above 4,500, followed by continuation, would open upside targets toward 4,545–4,550.
Bearish scenario: A confirmed breakdown below 4,408, with follow-through and failed pullback, would validate a bearish expansion toward 4,350, signaling that liquidity below the range is being targeted.
For now, Gold is compressing inside a liquidity box. Patience is key the highest-probability trades will come after the range resolves, not while price remains trapped in the middle.

Bitcoin Trapped Between Supply and Demand — Range Resolution Bitcoin (BTCUSD) on the H1 timeframe is currently trading inside a clearly defined range structure, following the previous impulsive rally and subsequent corrective decline. The market has transitioned from trending conditions into balance, with price oscillating between strong resistance and support zones.
On the upside, BTC continues to face heavy supply around the 91,600–92,000 resistance zone. Multiple rejection wicks and failed attempts to reclaim this area confirm that sellers are actively defending this level, preventing bullish continuation for now.
On the downside, price is repeatedly finding bids near the 89,200–89,600 support zone, which aligns with prior demand and acts as a liquidity buffer. This zone has absorbed selling pressure several times, keeping the market from breaking down impulsively.
Currently, price is trading near the mid-range around 90,700–90,900, close to the EMA 50. This is a high-risk area for entries, as price can rotate aggressively toward either boundary of the range without warning.
Bearish scenario: Rejection from the 91,200–91,600 resistance zone, followed by continuation lower, opens downside targets toward 89,200, with extension risk toward 88,400–87,600 if support fails.
Bullish scenario: A clean break and acceptance above 92,000, followed by a successful pullback, would invalidate the range and open upside toward 93,900–94,500.
For now, Bitcoin remains in range-trading conditions. Patience is essential — the highest-probability opportunities will come from confirmed breakouts or breakdowns, not from trading the middle of the range.

BTC Coils at a Critical Breakout PointBitcoin remains within a broader bullish market structure, supported by a rising trendline that has guided price action since the impulsive breakout. After printing a local high near the 94.8k area, price has transitioned into a consolidation phase, forming a series of lower highs while still maintaining higher lows a classic compression structure within an uptrend.
This price behavior reflects temporary equilibrium rather than trend exhaustion. The market is digesting prior gains, with volatility contracting as price coils between dynamic support and descending resistance.
The ascending trendline continues to act as structural support, while the descending trendline caps upside attempts, creating a tightening triangle. Price is also hovering around the EMA 50, which has flattened and is acting as short-term balance rather than directional momentum.
This setup typically precedes expansion. As long as price holds above the rising trendline and does Key Levels
Resistance:
Descending trendline near 93.2k–93.6k
Major supply above 94.8k
Support:
Rising trendline / structural support around 92.2k–92.6k
Deeper support near 90.4k (structure invalidation)
EMA / Dynamic Level:
EMA 50 around 92.8k (short-term equilibrium)not break structure to the downside, the bullish bias remains intact.
➡️ Primary Scenario:
Price continues to compress within the triangle before breaking above the descending resistance. A confirmed breakout and acceptance above this trendline would open the path toward the 94.8k high, with potential continuation toward the 96k area as bullish momentum expands.
⚠️ Risk Scenario:
A breakdown below the rising trendline with acceptance under EMA support would invalidate the bullish continuation setup. This would likely trigger a deeper corrective move toward the 90.4k zone before the market attempts to rebuild structure.

Gap Filled, Momentum Flips — Buyers Take ControlOANDA:XAUUSD has rebounded strongly from the gap support zone, reclaiming the short-term EMA cluster and shifting momentum back to the upside. The impulsive recovery suggests buyers are stepping in decisively after the corrective sell-off, turning the recent drop into a higher-low formation rather than trend failure.
As long as price holds above the 4,400 support zone, the structure favors continuation toward higher resistance levels.
Resistance: 4,495 → 4,525 → 4,550
Support: 4,400 – 4,410
Key demand (gap): 4,330 – 4,350
➡️ Primary: hold above 4,400 → pullback buys → continuation toward 4,495, then 4,525–4,550.
⚠️ Risk: loss of 4,400 → revisit the gap support at 4,330–4,350 before reassessment.

Bitcoin Stalls Between Supply and DemandBitcoin continues to trade within a broader bullish context after a strong impulsive advance, but current price action on the H1 timeframe shows clear hesitation as the market compresses between a defined supply zone above and a demand zone below. This type of behavior typically signals a decision phase, where the market is balancing recent buying pressure against emerging profit-taking and short-term distribution.
At present, price is rotating around the 92,800 area, unable to generate sustained momentum toward the upper supply zone near 94,400–94,500. Previous reactions from this region highlight active seller interest, making it a key level that must be reclaimed with acceptance for bullish continuation to unfold. As long as price remains capped below this supply zone, upside attempts are vulnerable to rejection rather than clean continuation.
From a corrective perspective, failure to build acceptance above current levels increases the probability of a pullback toward the 91,400 demand zone. This area previously acted as a strong base before the impulsive rally and is likely to attract responsive buyers on a first test. A clean reaction here would support the view of a healthy higher low within the broader uptrend.
However, if demand around 91,400 fails to hold, the structure opens the door for a deeper retracement toward the 89,500 region. A move into this zone would represent a more significant liquidity sweep and reset, yet would still remain technically corrective rather than trend-breaking, provided the higher-timeframe structure remains intact.
Alternatively, a decisive breakout and sustained acceptance above the 94,500 supply zone would invalidate the corrective outlook. In that scenario, Bitcoin would likely transition back into expansion mode, targeting the 95,500 region and potentially extending further as fresh upside liquidity is unlocked.

Gold Is Holding Key EMA Support — Bulls Preparing the Next BULLPrice is holding firmly above the EMA50 around 4,450, showing clear signs of buyer absorption after a shallow pullback. The market structure remains constructive, with higher lows still respected, suggesting this is a pause rather than a reversal.
A sustained hold above 4,450–4,440 strengthens the bullish case and sets the stage for an upside continuation toward 4,480, followed by 4,500–4,520 as the next expansion zone.
If bullish momentum accelerates and price breaks and closes above 4,500, the move could extend toward the higher target near 4,545–4,550. Only a decisive break back below 4,420 would weaken the bullish outlook, but for now, the upside scenario remains the primary focus.

Gold Holds Key Support — Is the Next Expansion to the Upside Gold (XAUUSD) on H1 continues to trade within a broader bullish recovery structure after rebounding strongly from the previous accumulation zone. The impulsive leg higher confirmed buyer dominance, and price has since transitioned into a controlled consolidation phase rather than a reversal.
Currently, price is reacting inside a clearly defined support zone around 4,418–4,435, which aligns closely with the rising moving averages. This area has repeatedly attracted buyers, confirming it as a critical demand base. As long as this zone holds, the bullish structure remains technically intact.
On the upside, Gold is capped by a well-defined resistance zone around 4,485–4,500, where previous distribution and profit-taking occurred. Price is now compressing between support and resistance, signaling a pause before the next directional move.
The current location is a decision area. Trading in the middle of this range carries elevated risk, as price can rotate aggressively toward either boundary.
Bullish scenario: If price holds above the 4,420–4,435 support zone and breaks above 4,500 with a clean close and acceptance, bullish continuation toward 4,540–4,560 becomes the primary target.
Bearish scenario: A confirmed breakdown below 4,415, followed by a failed pullback, would invalidate the bullish setup and open downside toward 4,380, with extended risk toward 4,340.
For now, patience is key. Gold is compressing inside a high-impact range, and the highest-probability trades will come from confirmed breakouts, not from anticipation within consolidation.

Repeated Rejections at Resistance — Is Gold Deeper Drop?Gold is trading inside a broader corrective range after a prior bullish impulse, with price repeatedly failing to break and hold above a well-defined higher-timeframe resistance zone. Multiple rejections from this area clearly show that upside momentum is being absorbed, not expanded.
While the larger structure has not fully flipped bearish yet, the current price action reflects distribution near the highs, not accumulation. Buyers are struggling to generate follow-through, and each push into resistance is met with increasing selling pressure.
The resistance zone around the 4,48x–4,50x area has been tested several times, with clear rejection wicks and weak closes a classic sign of supply dominance. At the same time, the EMA 200 is flattening below price, indicating a loss of bullish momentum rather than trend acceleration.
Volume behavior further supports this view: recent upside attempts are occurring on declining volume, suggesting the move higher lacks participation and strength. This divergence often precedes either a deeper pullback or a full corrective leg.
Resistance: 4,480 – 4,510 (major supply / rejection zone)
Support:
4,420 – 4,430 (intermediate reaction level)
4,350 (major downside support / correction target)
EMA / Dynamic Level: EMA 200 around 4,425 (loss of momentum / balance level)
➡️ Primary Scenario (Bearish Continuation):
Failure to break and accept above the resistance zone leads to another rejection. A move back below the 4,420–4,430 level would confirm distribution and open the path toward the 4,350 support zone, where a broader corrective leg is likely to unfold.
⚠️ Risk Scenario (Bullish Extension):
If price manages a clean breakout and acceptance above the 4,510 resistance with expanding volume, the distribution thesis would be invalidated. In that case, gold could transition into renewed bullish continuation rather than correction.

GOLD (XAUUSD) — Sell From Resistance | Targets 4,412 → 4,330Gold prices are currently holding firm in strong demand after a positive correction within a bullish market structure. Prices have broken through resistance levels several times, but the next resistance is the all-time high (ATH). Sellers will likely prevent the price from breaking through and reaching a new peak just before news from the White House.
A sharp drop is expected when the price reaches the predicted resistance level of 4,491.
If the price fails to break through and holds below this resistance, a liquidation is likely to occur, and the price will quickly fall to 4,400.
Despite being in an uptrend, a sharp correction is expected to consolidate for a stronger subsequent rally. It will also fill the gap left by the previous day.
A breakdown above the resistance level would invalidate this setup.

Bullish Channel Under Pressure — Continuation or Breakdown XAUUSD / M30 — Market Update
Market Context & Structure
Gold is trading within a well-defined ascending channel, confirming that the broader market structure on M30 remains bullish. The sequence of higher highs and higher lows is still intact, and the prior impulsive leg shows strong bullish commitment rather than exhaustion.
However, after testing the upper boundary of the channel, price has shifted into a corrective pullback phase. This move is corrective in nature and currently unfolding inside the bullish structure, not yet signaling a trend reversal.
Technical Confluence
The lower boundary of the ascending channel aligns closely with a short-term demand area, making it a critical reaction zone. Price has already shown an initial response from this region, suggesting buyers are still active.
At the same time, the mid-range horizontal level (previous intraday balance) is acting as a decision point. Market behavior around this level will determine whether gold resumes its bullish continuation or transitions into a deeper corrective phase.
Resistance:
Upper channel resistance near 4,550–4,570
Mid-range supply around 4,490–4,500
Support:
Channel support near 4,450–4,460
Major downside level at 4,320–4,340 (structure risk zone)
Scenarios
➡️ Primary Scenario:
If price holds above the lower channel support and forms a higher low, gold is likely to resume its bullish trajectory. A clean push back above the mid-range level would confirm continuation toward the upper channel boundary, with potential extension to new highs.
⚠️ Risk Scenario:
A decisive breakdown below the channel support would invalidate the bullish structure. In that case, downside momentum could accelerate toward the 4,320–4,340 support zone, signaling a broader corrective move rather than a simple pullback.

Relief Rally or Trend Continuation? EURUSD Tests Key SupportEURUSD / H1 — Market Update
Market Context & Structure
EURUSD remains under a bearish market structure on the H1 timeframe, defined by a sequence of lower highs and lower lows. The descending trendline has been respected multiple times, confirming sustained selling pressure and clear directional control from sellers.
However, after the latest impulsive sell-off, price is now trading near a well-defined support zone, where downside momentum has started to slow. This suggests the market is transitioning from expansion into a short-term corrective phase, rather than continuing to sell aggressively at market price.
Technical Confluence
The current support zone aligns with a previous reaction low, making it a logical area for profit-taking from shorts and a potential bounce. At the same time, the descending trendline overhead remains the key structural resistance that caps any upside attempt.
This creates a classic pullback-in-a-downtrend environment, where corrective rallies are expected to be capped below the trendline unless structure is decisively broken.
Resistance:
Descending trendline resistance
1.1700 – 1.1725 (prior reaction / target zone)
1.1760 – 1.1770 (major structural resistance)
Support:
1.1670 – 1.1680 (key demand / reaction zone)
Scenarios
➡️ Primary Scenario:
Price reacts from the support zone and stages a corrective bounce. A move toward the 1.1700 level is the first logical upside target, followed by a potential extension into the descending trendline near 1.1725. This move would be considered a pullback, not a trend reversal, as long as price remains below trendline resistance.
⚠️ Risk Scenario:
Failure to hold the support zone would signal continuation of the bearish structure. A clean breakdown and acceptance below 1.1670 would open the path for further downside, extending the trend rather than triggering a corrective rally.

Is This the Base for a Trend Reversal or Just a Temporary Pause?📊 MARKET STRUCTURE & PRICE ACTION OVERVIEW
Hello traders! Here’s a clean technical breakdown of EURUSD (1H) based on the current chart structure.
EURUSD has been trading within a broader bearish structure, marked by consistent lower highs and lower lows. After a sustained sell-side move, price reached a key reaction area and printed a sharp bullish impulse, signaling short-term buyer participation and the formation of a potential pivot low.
Following this rebound, the market failed to sustain bullish momentum and rolled back into a corrective pullback, respecting prior structure levels. This behavior reflects a market still under bearish pressure, but now transitioning into a critical evaluation phase near demand.
🟦 SUPPLY & DEMAND – KEY ZONES
Primary Demand (Support Zone):
The 1.1665–1.1670 area is a well-defined demand zone, where strong buying previously entered and halted the sell-off. This zone represents institutional interest and is the key level preventing further downside.
Intermediate Resistance:
The 1.1700 level acts as a short-term structure barrier. Price rejection here confirms that sellers are still defending lower highs.
Major Supply Zones:
Overhead supply remains layered at:
1.1745–1.1760 (previous consolidation and EMA alignment)
1.1780–1.1790 (higher-timeframe supply and distribution zone)
These zones define the path price must reclaim to confirm a broader bullish shift.
🎯 CURRENT MARKET POSITION
Currently, EURUSD is trading just above the primary demand zone, placing price at a high-importance decision area. This is where the market will determine whether recent selling pressure is exhaustion-driven or simply a pause before continuation.
The proximity to demand suggests risk is becoming asymmetric, with sellers needing a clean breakdown to regain momentum.
🧠 MY SCENARIO
As long as EURUSD holds above the 1.1665 demand zone, the current price action can be treated as a corrective base-building phase, with potential for a push back toward 1.1700, followed by a retest of the 1.1745–1.1760 supply zone. Acceptance above that area would be the first signal of a meaningful trend shift.
However, a decisive hourly close below 1.1665 would confirm bearish continuation, opening the door for further downside expansion beyond the current structure.
For now, price is testing demand, not breaking structure.
⚠️ RISK NOTE
This is a critical inflection point. Let price confirm direction at demand, avoid early bias, and always manage your risk.

EURUSD Tests Key Support — Is This the Base for a Bullish ReversFX:EURUSD on the H1 timeframe has been in a corrective bearish phase following a prolonged distribution period at the highs, with price trending lower beneath declining moving averages. Momentum weakened sharply during the selloff, culminating in a strong downside extension that swept liquidity below prior lows before price began to stabilize.
Current price action shows FX:EURUSD reacting directly from a clearly defined support zone around the 1.1670 region. The sharp rejection from this area suggests the presence of responsive buyers stepping in after the liquidity sweep, creating conditions for a potential short-term base. While the broader intraday structure remains corrective, this reaction indicates that selling pressure is beginning to lose momentum.
If price can continue to hold above the support zone and build higher lows, a corrective rebound toward the 1.1710 region becomes the first area of interest. This level aligns with prior intraday structure and represents the initial objective where sellers may attempt to re-engage. Acceptance above this zone would improve the probability of further upside rotation.
A sustained move beyond 1.1750 would signal a deeper mean reversion within the range, opening the path toward the 1.1780 region where prior distribution occurred. Such a move would reflect a broader corrective recovery rather than an immediate trend reversal, but it would still offer constructive upside potential in the near term.
However, failure to hold the 1.1670 support would invalidate the recovery scenario and expose the pair to further downside continuation. In that case, price could extend lower as the market searches for deeper liquidity before any meaningful structural shift develops.

EURUSD Institutional Levels: Short Premium 1750–1800 → 1600🔱 EURUSD WEEKLY SNAPSHOT — EXECUTIVE SUMMARY
✨ EURUSD positioned in a corrective bearish structure (distribution → continuation)
🔴 Primary sell impulse: 1.1800 → 1.1600 confirms bearish control
🔄 Current price action: corrective rallies (sell-the-rip environment)
🧱 Institutional sell zone: 1.1750 – 1.1800 (major resistance stack)
🟡 Intermediate resistance: 1.1750 (reaction zone before continuation)
📉 Bearish bias remains valid below: 1.1800
🎯 Downside liquidity targets:
• First buy-side liquidity: 1.1600
• Expansion support / max pain: 1.1500
⬇️ Market structure: lower highs + weak retracements = continuation risk
⏳ Expect rallies to be capped before range expansion lower
⚠️ Invalidation: sustained acceptance above 1.1800
🎯 Strategy: Short sell rips / rallies into resistance
🏦 Larger accumulation likely only after liquidity is swept below 1.1600–1.1500
________________________________________
🧠 EURUSD MARKET LOGIC Institutional Read
• Sellers defend premium zones (1.1750–1.1800)
• Buyers are reactive, not aggressive
• Downward arrows dominate flow → bearish continuation favored
• Any upside without acceptance = distribution
________________________________________
🗳️ EURUSD WEEKLY SCENARIOS — WHAT’S YOUR PLAY?
Let me know in the comments section below.
Which path do you expect for EURUSD this week?
🅰️ Rejects 1.1750–1.1800 → clean selloff toward 1.1600
(Textbook sell-the-rip continuation)
🅱️ Range grind below 1.1750 → liquidity build → breakdown to 1.1500
(Slow bleed before acceleration)
🅲 Fake breakout above 1.1750 → sharp rejection → impulsive drop
(Bull trap / stop-hunt scenario)
🅳 Your level: drop ONE price you’re watching most this week 👇

Market Analysis & Reaffirmation of Trading PlanMarket Analysis & Reaffirmation of Trading Plan
- Today's market is moving exactly as planned yesterday. After a consolidation phase and absorption of liquidity around the 4.38x – 4.40x range, the price has clearly broken out, confirming the return of large capital flows. The market structure on the H4 timeframe has shifted to a higher high – higher low, indicating that the uptrend has been established and is being maintained.
- The price holding above the breakout zone not only reinforces the trend but also proves that following the structure was the correct choice. The current corrections are merely technical, serving to create more liquidity for the market to continue expanding its range.
Message to the community:
- The market is not random. When you correctly read the structure, identify the correct price zone, and patiently wait for confirmation, the advantage will automatically be on your side.
- A correct plan doesn't need fanfare The results are the clearest evidence of a leader's position.
TODAY'S LIMITED STRATEGY JAN 6
Intraday trading: Increase
📌 SET UP 1. Timming Sell Zone
XAUUSD SELL ZONE: 4517 - 4520
💰 Take Profit(TP): 4514 - 4509
❎ Stoploss(SL): 4524
Note capital management to ensure account safety
📌 SET UP 2. Timming Buy Zone
XAUUSD BUY ZONE: 4394 - 4397
💰 Take Profit(TP): 4400 - 4405
❎ Stoploss(SL): 4390
Note capital management to ensure account safety

Bitcoin Is Not Overextended — This Is a Structured Trend Hello everyone,
On the H1 timeframe, Bitcoin remains in a clean, well-respected bullish trend, and the current price action continues to validate trend continuation rather than exhaustion.
Market Structure Breakdown
The chart shows a clear ascending structure, defined by:
Higher highs and higher lows
Price consistently respecting the ascending trendline
Each pullback forming a rounded corrective base, followed by impulsive expansion
Every highlighted orange circle marks a successful reaction at trend resistance, which was later converted into support. This is a textbook example of break → accept → continue, not rejection.
Key Technical Observations
The impulsive leg from ~91,000 to above 92,800 was followed by tight consolidation, not aggressive selling.
Current candles are holding above the prior breakout level (~92,300), confirming acceptance, not a fake move.
Pullbacks remain shallow and overlapping, indicating buyers are in control and sellers lack follow-through.
Scenario Logic
The projected path is structurally sound:
Hold above 92,300 → continuation remains valid
Minor consolidation / flagging → fuel for expansion
Upside continuation toward 93,900, then 94,400+
Importantly, there is no distribution signature:
No sharp rejection from highs
No aggressive bearish displacement
No loss of trendline structure
Invalidation Conditions
This bullish continuation thesis only weakens if:
Price loses 92,300 with acceptance
Followed by a breakdown below 91,800, which would indicate a deeper corrective phase
Until then, any pullback is structural, not directional.
Conclusion
Bitcoin is not “too high” — it is doing exactly what a strong trend should do:
Break levels
Pause briefly
Continue higher
As long as price remains above the reclaimed supports and respects the rising structure, the path of least resistance remains upward.
Trade safe and stay disciplined.

Gold Nears $4,440 — Is This a Real Breakout or ........
OANDA:XAUUSD has extended its rebound aggressively, pushing into the $4,430–$4,440 area after a sharp recovery from the prior sell-off. The speed of the bounce is notable, but price is now approaching a technically sensitive zone where upside momentum historically begins to stall. At this stage, the market is no longer trading in “easy trend” conditions; instead, it is transitioning into a decision area where positioning matters more than direction.
Key Resistance and Price Reaction
The $4,400–$4,440 region is acting as a clear resistance band. This level previously served as a breakdown point and is now being retested from below — a classic role-reversal zone. The most recent candles show reduced follow-through and early signs of hesitation, suggesting that buy-side momentum is slowing as price runs into resting supply. Without a clean impulsive break and acceptance above this level, upside continuation remains questionable.
Gap Structure and Mean-Reversion Risk
Below current price lies a clearly defined inefficiency (GAP) zone, created by the impulsive upside move. Markets rarely leave such gaps unresolved, especially when they form after emotional rebounds. From a structural perspective, this gap represents unfinished business — an area where price may return to rebalance liquidity before choosing a sustained directional move. The highlighted “fill gap” area aligns well with prior consolidation, increasing its technical relevance.
Support Zone and Downside Scenarios
The broader support zone around $4,300 remains the key downside magnet. If price fails to hold above $4,400 and begins to roll over, a controlled pullback toward the gap is the first logical scenario. A deeper retracement into the $4,300 support zone would still be considered corrective rather than trend-breaking, as long as buyers defend that area with structure and volume.
Trend Structure Assessment
Despite the short-term pullback risk, the higher-timeframe structure remains constructive. Higher lows are still intact, and price continues to trade above major dynamic supports. However, from a professional trading perspective, this is no longer a location to chase longs. Risk-to-reward now favors patience — either waiting for confirmation above resistance or looking for reactions at lower, more favorable levels.
Technical Conclusion
Gold is currently at a crossroads. A clean breakout and acceptance above $4,440 would invalidate the gap-reversion thesis and open the door for continuation higher. Conversely, failure at this level increases the probability of a corrective move toward the gap and potentially the $4,300 support zone. Until one of these scenarios confirms, gold remains in a high-risk, low-conviction zone where discipline matters more than bias.

XAUUSD Price Forecast: US Venezuela Tensions Test $4,500Market Overview
- Gold (XAU/USD) opened the week with strong upside momentum, briefly pushing above the $4,400 handle during the early European session. However, that initial advance stalled relatively quickly. The primary driver behind the early strength was not technical in nature, but rather a renewed surge in geopolitical risk. Developments in Latin America, particularly the U.S.-led military action in Venezuela and the arrest of President Nicolás Maduro, have significantly increased global risk sensitivity. Additional rhetoric suggesting that Colombia and Mexico could face similar pressure has further unsettled markets.
- Beyond Latin America, unresolved conflicts in Ukraine, persistent instability involving Iran, and ongoing tensions in Gaza continue to reinforce a fragile global backdrop. In this environment, capital preservation has become a priority. Investors are rotating into traditional safe-haven assets, and gold remains one of the primary beneficiaries of this risk-off positioning.
Strong U.S. Dollar Fails to Suppress Gold Demand
- Despite the broader risk-off tone supporting the U.S. dollar, gold has proven resilient. Normally, a stronger dollar would act as a headwind for bullion, but current market conditions suggest that safe-haven demand is strong enough to offset currency pressure. This divergence highlights how elevated geopolitical uncertainty is currently overriding conventional correlations.
- Looking ahead, U.S. macroeconomic data will be a key driver. Inflation-related releases throughout the week, followed by Friday’s U.S. employment report, are critical inputs for Federal Reserve expectations. Any signs of labor market softening could reinforce expectations for additional rate cuts, which would further support gold by reducing real yield pressure.
Short-Term Forecast
In the near term, gold is likely to remain range-bound as the market digests both geopolitical headlines and upcoming economic data. A consolidation range between $4,410 and $4,450 appears reasonable over the next few sessions. As long as safe-haven demand remains intact, upside pressure persists, and a clean break above the $4,500 level cannot be ruled out.
Technical Structure and Key Levels
- From a technical standpoint, gold is currently trading near $4,421 after rebounding from the recent sharp pullback off the $4,550 high. Price has successfully reclaimed the $4,412 Fibonacci retracement level, and short-term EMA closes above this zone suggest improving near-term structure. Importantly, the broader uptrend that has been in place since December remains intact.
- Imediate resistance is located near $4,445, aligning with the 61.8% Fibonacci retracement, followed by a higher resistance zone around $4,498. Recent price action has produced a sequence of higher lows, signaling renewed dip-buying interest and improving market confidence.
- Momentum indicators support this view. The RSI has recovered toward the 50 level, indicating stabilization and early momentum recovery rather than overextension. From a tactical trading perspective, pullbacks toward the $4,410 area remain attractive, with upside targets toward $4,500, while a protective stop below $4,340 helps manage downside risk if the recovery fails.

Gold Is Not Done — H1 Structure Favors ContinuationHello everyone,
On the H1 timeframe, the key focus right now is not the short-term hesitation, but the fact that gold has successfully transitioned from a corrective phase into a recovery structure and is now reacting constructively below resistance.
After the sharp sell-off earlier in the session, price found strong demand inside the 4,280–4,300 support zone, where selling pressure was fully absorbed. The impulsive rejection from this area marked a clear structural low, followed by a steady sequence of higher lows. This confirms that the downside move has already completed and that the market is now in a rebuilding phase.
From a structural perspective, gold has reclaimed multiple intraday levels and is currently trading above the 4,350–4,360 area, which previously acted as resistance. This level has now flipped into short-term support, indicating acceptance at higher prices. The current pause just below the 4,400–4,405 resistance zone is therefore a reaction point, not a sign of weakness.
The projected paths drawn on the chart reflect realistic scenarios rather than predictions:
- A shallow pullback toward the 4,350–4,370 region to retest demand, followed by continuation higher.
- If momentum persists, acceptance above 4,405 would open the door for a push toward 4,450–4,480, and potentially higher toward the upper resistance cluster.
- Only a clean breakdown back below 4,330 would invalidate the bullish continuation structure and shift the market back into range behavior.
Importantly, price action remains orderly, with no impulsive selling and no expansion to the downside. This tells us that current consolidation is part of a trend continuation process, not distribution. As long as gold holds above the reclaimed support levels, the path of least resistance remains to the upside.
Wishing you all effective and disciplined trading.

Gold Turns at Key Support — Break or Fake Into Resistance?Gold on the H1 timeframe has completed a clean rebound from the major support zone, confirming that buyers are actively defending this area. The sharp rejection from the lows suggests the recent sell-off was corrective rather than the start of a sustained bearish trend.
Price is now recovering above the short-term structure and pushing back toward the key resistance zone around 4,425–4,450. This area is critical, as it previously acted as a strong supply region and aligns with prior breakdown levels. The current move should be treated as a reaction leg, not a confirmed continuation yet.
Two clear scenarios are in play.
Scenario 1: Price holds above the recent pullback level, consolidates, and breaks cleanly through resistance. This would open the path toward higher levels and a potential retest of the upper range and ATH zone.
Scenario 2: Price stalls or rejects at resistance, forming a lower high, which would signal ongoing range behavior and a possible rotation back toward mid-range or support.
In summary, Gold has turned bullish from support , but confirmation depends on acceptance above resistance. Until a clean breakout occurs, the market remains reactive and range-controlled, with resistance being the key decision point.
