Bitcoin crashed.!!!!! The bull Market support band should hold.Hello Traders,
It was quite a shock yesterday but you shouldn't have been worried if you are following my chart properly. As for those who are new trust me, believe me when i tell you something important that no one would. You don't have to fear anything. Don't get scared of this slight pullback. Look at the bright side you weren't fallen from $64k but just mere $52k with 20% correction. Absolutely normal. You could have easily recovered the profits if you had a backup money which you should always have regardless of the bull or bear run.
So now arises an important question. Where to from here?????????
Fundamental Analysis :
If history has been any indication then we are right on track and we must carry our journey forward. But you have to know its september. Crazy things must happen this month and we have got three major dates for you.
!. On 13th-14th september depending on your timezone we have CPI data coming. A very important if you must know. (April 15) A high CPI is good because crypto loves inflation
2. On 21st-22nd september we have annual meeting of FED's. Some say we might get an idea about taper from there. If taper happens this year then you cant stop this rocket from going to the moon
3. We also should mark those dates when options are expiring. One such is on september 21 and one on last week of september. Do keep that in mind.
Technical analysis :
1. Charts are looking bad tbh but we have good news. No new shorts right now.
2. Fear is back in the market which is good opportunity to fill your bags.
3. Now we must hold bull market support band around 42-43k if we don't then maybe bears smell blood and will attack right away. Even i will join their party XD
4. 42.5k, 36k, 35k 31k, some major resistance to watch out if we break to downside.
Or at the end we all are in a bull trap in the mercy of institutions, financial cartel, big banks, IMF etc
Till then do not trade. Just accumulate with no leverage
Happy trading my bears and bulls
Regards
Dante. An artist of crypto.!!!
Traders

RVNUSDT - End of Cup HandleRVNUSDT - End of Cup Handle
RVN could be about to break through towards higher levels, what do you think?
Support has held and bounce off a few times, could we see 0.3?
Thanks,
TraderPaps

ASIAN PAINTS - Strong support!!.618 Fibonnaci level or 2960 is a crucial support for the stock.
Also, it is respecting the 50 EMA.
Less likely to breach.


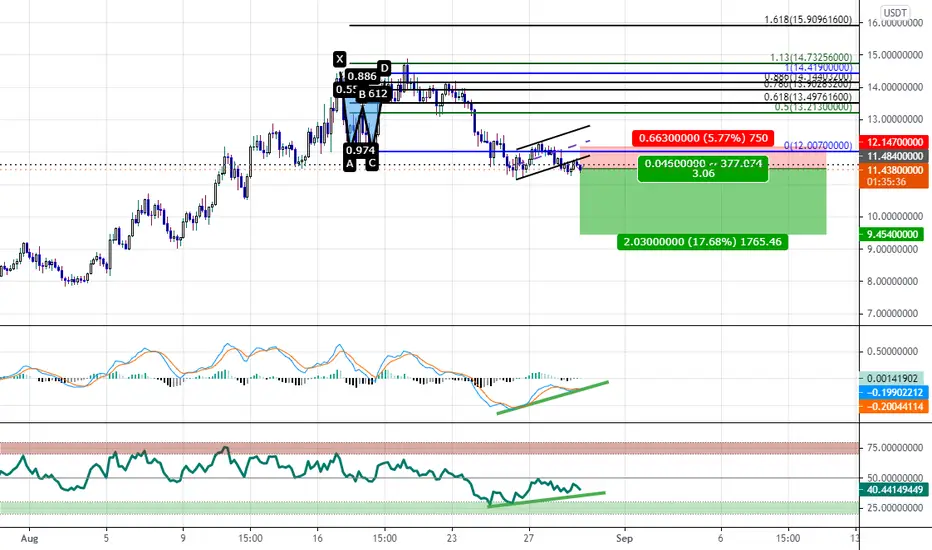
It Looks Like A Double Bottom But Very Likely Could Be A TrapI was looking at this earlier as a potential double bottom with bullish divergence and was looking to take a position after the sessions opened but after a few hours of waiting and letting the trading of this asset go on during the sessions i have not seen anything that would signal immediate bullishness.
I think that this "Double Bottom" Has potential to trap many bulls and instead send the price down to around $9.
The signal i will be using to enter short is once the MACD breaks the trendline and crosses bearishly i think we will see a nice move down to the $9s
Short term buy : ES1! / Emini / SPY500Price tried to break lower but got reversed & broke higher.
This has trapped a bunch of seller.
When they exit, it'll create a bullish trade idea.
We can trade along!

BAJAJ AUTO - Multiple Bullish indicator1. Watch the support at 200 EMA always.
2. Formed a bullish candle at demand zone.
3. There was no major sell volume while the price was falling.


LINCOLN PHARMA - Bullish script!Look at the rally whenever 5*21 crossover happenns.
We have a similar crossover this time.
Also, note the bull volumes in the recent trend.

DVL - Fake breakout to remove the retailers!A similar pattern was observed in CDSL near 1200 levels.
A big SHORT was created to remove the retailers by lowering the price to unprecendented levels.
CDSL made a high of 1600 in next 2 weeks.!

COLPAL - Possibility of a reversalStanding on a strong demand zone.
There are good chances of a reversal from here.
The RSI has shown +ve momentum.
View negated below 1670 close.


#BTCUSDTPossible move of Bitcoin in the coming days.
The above analysis is a prediction and may be incorrect.
According to the above analysis, MA200 is breaking MA300, which you can see the price reaction between these two MAs
Also, the speed and power of price movement is predicted and drawn based on Price Action.
I hope you do not get fomo and invest with strategy and at more reasonable prices.

WABAG - Highest strength stockThere is a niche concept of consolidation and breakout going on at the moment.
Poised for an upmove from here!!
Keep SL as today's low.

FIRST TP triggered #BITCOIN+31.26% profit made as planned we might still go forward if a bullish candle close above yea so but for now we are still rejecting the main level so we wait for a break to ride the trend
Like share follow
Thanks for reading ✌️✌️

EURJPY forecast Price has broken support turned resistence. However, it formed below the resistence a hammer candle. The current becoming candle is most-likely to fill the hammer's wick till friday this week. So we need to have a bit patience and maybe we need to adjust our SL so we don't get into a bull trap.

GBPJPY H4 - Short SetupGBPJPY H4
Very similar chart to the EURJPY and USDWTI chart we have, clear and concise trading zones, with clear bearish direction. Evident lower highs and lower lows.
Trading zones seem to be responding well which is the first step. Measurable risk to reward too which is perfect. Already in EJ shorts, so this isn't something I'll explore, but good to see for pair comparative purposes.

NZDCAD H4 - Long SetupNZDCAD H4
Long setup indicated here, again another one carried forward from last week, looking to see if we double bottom from our interim support/resistance price. If we do, we have a solid 4.2R trade measured from our buy zone to take profit target.
We pushed just slightly shy of 2R on the latest bounce, but again, fresh week more volume. Lets see what we can capitalise on.

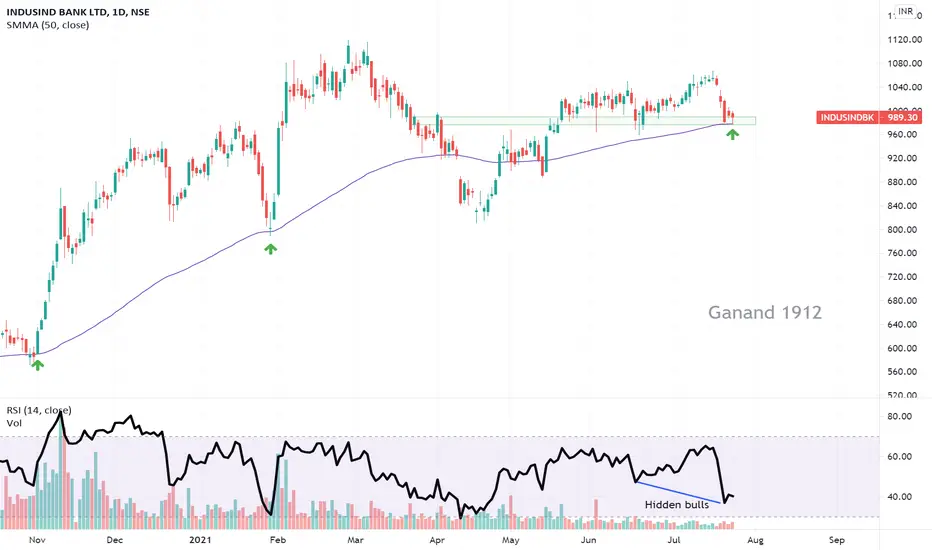
INDUSINDBANK - POSSIBLE REVERSALstock taking support of 50 smma and showing hidden bulls with RSI.
can reverse from here.
view negated below 960.


MARUTI - POSSIBILITY OF TREND REVERSAL!!Took support of 50 SMMA & demand zone simultaneously.
Good chances of a reversal here.

PETRONET - Reversal trade With the formation of a bullish doji at the demand zone, the chances of a trend reversal from here, are high.
View negated below demand zone close.
